Potential Solar Power Dataset in 0.25° Grid in the Belt and Road and Surround Region (2015)
Xin, X. Z.1 Zhang, Q.1,2 Zhang, H. L.1* Gong, W.1,3 Li, L.1 Liu, Q. H.1*
Zhong, B.1 Wu, S. L.1,4
1. State Key Laboratory of Remote Sensing Science, Jointly Sponsored by Institute of Remote Sensing and Digital Earth of Chinese Academy of Sciences and Beijing Normal University, Beijing 100101, China;
2. University of Chinese Academy of Sciences, Beijing 100049, China;
3. Chongqing Normal University, Chongqing 400047, China;
4. Chongqing University of Posts and Telecommunications, Chongqing 400065, China
Abstract: Research on the solar power generation potential in the Belt and Road and surround region can provide a basis for future clean energy development planning. Multiple factors were considered, such as solar radiation, surface cover and terrain. GLCNMO (global land cover by national mapping organizations) 30” land cover products were used to determine the factors of different land cover types, in order to calculate the available area. SRTM30 (shuttle radar topography mission global coverage with 30-second resolution) elevation data were used to obtain the areas restricted by slope. MuSyQ (multi-source data synergized quantitative remote sensing production system) radiation products in 2015 were used to obtain the surface incident solar radiation of the entire year. Combined with the multi-criteria evaluation model, a solar power generation potential dataset with 0.25° grid in the Belt and Road and surround region (2015) was obtained, based on the potential formula of solar power generation. The results show that the Arabian Peninsula, the Iranian Plateau and the African Sahara Desert have the greatest potential for solar power generation, up to 400 kWh/m². The spatial resolution of the dataset is 0.25°. The data was archived in .tif data format with data size of 3.75 MB.
Keywords: the Belt and Road; the solar power generation potential; solar energy resources
1 Introduction
Renewable energy has recently become the focus of attention because of the increasingly serious air pollution problem and greenhouse effects caused by direct combustion of fossil fuels, such as coal[1]. Solar energy is characterized by abundant reserves, uses clean and environmentally friendly technology and is recognized as one of the most promising new energy sources[2]. Currently, the solar power generation industry is developing rapidly. In 2016, the global generation capacity of renewable energy increased by 161 GW, with solar power generation contributing 71 GW; thus, solar energy is expected to play a major role in achieving a global power generation system based on renewable energy[3].
The theoretical potential of solar power generation refers to the capacity of electricity generated with full utilization of solar energy, which is far from realistic due to many factors, including the availability of light energy in various geographical areas, which affects its solar power generation potential. Based on GIS, Sabo Lurwan[4] and Charabi[5] determined suitable areas for constructing photovoltaic power plants and estimated their solar power generation potential, respectively. Based on MuSyQ (multi-source data synergized quantitative remote sensing production system) radiation products, GLCNMO (global land cover by national mapping organizations) land cover products, and SRTM30 (shuttle radar topography mission global coverage with 30-second resolution) elevation data, as well as by using the calculation formula of solar power generation potential and spatial analysis functions within ArcGIS, we obtained a solar power generation potential estimation dataset for the Belt and Road and adjacent regions[6]. Based on these data, the power generation potential was counted for each country, and compared to photovoltaic installed capacity, GDP (gross domestic product) and so on.
2 Metadata of Dataset
The metadata of solar power generation potential dataset in the Belt and Road and surround region (PSPG_B&R) are summarized in Table 1. It includes the dataset full name, short name, authors, year of the dataset, temporal resolution, spatial resolution, data format, data size, data files, data publisher, and data sharing policy, etc.
Table 1 Metadata summary of the solar power generation potential dataset in the Belt and Road and surround region
|
Items
|
Description
|
|
Dataset full name
|
Potential solar power generation dataset at 0.25° resolution in the Belt and Road and surround region (2015)
|
|
Dataset short name
|
PSPG_B&R
|
|
Authors
|
Xin, X. Z. S-3681-2016, xin_xzh@163.com
Zhang, Q. M-9694-2017, 2270211857@qq.com
Zhang, H. L. L-6186-2016, zhlnjnu@163.com
Gong, W. Q-8293-2017, 1271129410@qq.com
Li, L. S-4533-2016, lili3982@163.com
Liu, Q. H. S-1647-2016, liuqh@radi.ac.cn
Zhong, B. L-4528-2016, zhongbo@radi.ac.cn
Wu, S. L. S-1572-2016, wsl0579@163.com
|
Institute of Remote Sensing and Digital Earth, Chinese Academy of Sciences
|
|
Geographical region
|
Asia, Europe, Africa and Oceania
|
|
Year
|
2015
|
|
Temporal resolution
|
One year Spatial resolution 0.25°
|
|
Data format
|
.tif
|
(To be continued on the next page)
(Continued)
|
Items
|
Description
|
|
Data size
|
3.75 MB
|
|
Data files
|
Only one .tif file
|
|
Data publisher
|
Global Change Research Data Publishing & Repository, http://www.geodoi.ac.cn
|
|
Address
|
No. 11A, Datun Road, Chaoyang District, Beijing 100101, China
|
|
Data sharing policy
|
Data from the Global Change Research Data Publishing & Repository includes metadata, datasets (data products), and publications (in this case, in the Journal of Global Change Data & Discovery). Data sharing policy includes: (1) Data are openly available and can be free downloaded via the Internet; (2) End users are encouraged to use Data subject to citation; (3) Users, who are by definition also value-added service providers, are welcome to redistribute Data subject to written permission from the GCdataPR Editorial Office and the issuance of a Data redistribution license; and (4) If Data are used to compile new datasets, the ‘ten per cent principal’ should be followed such that Data records utilized should not surpass 10% of the new dataset contents, while sources should be clearly noted in suitable places in the new dataset[7]
|
3 Methods
3.1 Basic Data
MuSyQ radiation products, GLCNMO land cover products and SRTM30 data were used for developing the potential solar power generation dataset. The data used is shown in Table 2.
Table 2 Summary of basic data information
|
Data Sources
|
Data types
|
Time
|
Spatial resolution
|
Data size
|
|
Institute of Remote Sensing and Digital Earth of Chinese Academy of Sciences
|
MuSyQ radiation
products
|
2015
|
0.05°
|
95.50 GB
|
|
Geospatial Information Authority of Japan, Chiba University and collaborating organizations
download link:
http://www.iscgm.org/gmd/download/glcnmo.html
|
GLCNMO land
cover products
|
2003
|
30″
|
0.87 GB
|
|
National Aeronautics and Space Administration
download link:
http://vterrain.org/Elevation/SRTM/
|
SRTM30
elevation data
|
2004
|
30″
|
1.45 GB
|
3.2 Algorithm
The authors use the methods presented by Wang[8–9] to evaluate the solar power generation potential, which takes into account the geographical potential and technical potential of solar power generation. Geographical potential accounts for the fact that different land cover types receive different proportions of solar energy. To calculate the available area within each land grid, since not all land types can be used to collect solar energy, this study considers the suitable factor for each land type, which is defined as the ratio of the area that can be used to collect solar energy to the total area of the land. The available area for each grid is the sum of the products of the land type area and the corresponding available factor. The technical potential accounts for the lost geographical potential from solar energy to electrical energy and illustrates the more realistic solar power generation potential.
The solar power generation potential formula is defined as follows:
 (1)
(1)
where G is solar power generation potential (kWh/m2), E is annual surface incident solar radiation (MJ/m2), A is the available area for solar energy (km2), and P is the efficiency with which solar system converts sunlight into electricity (0.168).
A is defined as
 (2)
(2)
where πj is the available factor for land cover type (j), aj is the area of land cover type (j) in a grid, and n is the number of land cover types.
Additionally, regions with a slope of more than 5° are not suitable for the construction of large-scale power generation facilities such as photovoltaic power stations, and these regions are defined as the restricted area of solar power generation.
|

Figure 1 Flowchart of solar power generation potential estimation
|
3.3 Algorithm Implementation
According to the formula of available area, the GLCNMO land cover product was used to determine the factors of different land cover types, in order to calculate the available area of each land grid. The annual surface incident solar radiation was obtained from the daily and monthly accumulation of shortwave radiation datasets in the MuSyQ radiation products. Based on the calculation formula of solar power generation potential, the annual surface incident solar radiation, and available area of the grid, all using the ArcGIS grid calculator tool, the power generation potential was calculated.
4 Results
The dataset is archived in .tif data format and the resolution is 0.25°. The data show that the Arabian Peninsula, the Iranian plateau in West Asia and parts of the Sahara in Africa have the highest solar power generation potential, above 330 kWh/m². These regions are rich in solar energy and sparsely covered with vegetation, which makes them suitable for the development of solar energy resources. The northwestern region of East Asia, parts of Central Asia, southern Africa and the Midwest of Australia have large areas with high power generation potential, over 230 kWh/m².
Based on the solar power generation potential in the Belt and Road and surround
Regions (Figure 2), the total and per capita solar power generation potentials in countries were calculated as shown in Table 3. Australia has the highest total solar power potential, 1.59 × 10⁶ TWh, followed by China with 1.05×10⁶ TWh. China’s newly added and accumulated photovoltaic installed capacities in 2016 are the highest in the world at 35.5 GW and 78.1 GW, respectively.
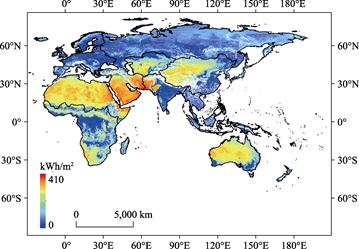
Figure 2 The solar power generation potential in the Belt and Road and surround region in 2015
Table 3 The statistics on solar power generation potential and economic indicators
|
Country
|
Area
|
PV installed capacity (GW) (PV penetration of total electricity demand)
|
Solar power generation potential (103×TWh)
|
GDP
(1011×
dollars)
|
Per capita power generation potential (104×kWh)
|
Per capita GDP
(103×
dollars)
|
Per capita electricity consumption
(102×kWh)
|
|
China
|
East Asia
|
78.1 (1.8%)
|
1051.0
|
110.1
|
76.6
|
8.0
|
39.1
|
|
Japan
|
42.8 (4.9%)
|
8.2
|
43.8
|
6.5
|
34.5
|
78.4
|
|
Korea
|
4.4 (1.15%)
|
2.1
|
13.8
|
4.1
|
27.2
|
105.2
|
|
Germany
|
Europe
|
41.2 (7%)
|
14.0
|
33.6
|
17.2
|
41.3
|
88.8
|
|
Italy
|
19.3 (7.3%)
|
10.3
|
18.2
|
16.9
|
30.0
|
50.0
|
|
United Kingdom
|
11.6 (3.4%)
|
7.6
|
28.6
|
11.7
|
43.9
|
50.9
|
|
France
|
Europe
|
7.1 (1.63%)
|
24.6
|
24.2
|
36.8
|
36.2
|
68.9
|
|
Spain
|
5.5 (3.33%)
|
27.9
|
12.0
|
60.1
|
25.8
|
53.6
|
|
Belgium
|
|
3.4 (4.25%)
|
1.1
|
4.6
|
9.7
|
40.3
|
76.6
|
|
Greece
|
|
2.6 (7.4%)
|
5.8
|
1.9
|
53.6
|
18.0
|
50.9
|
|
Netherlands
|
|
2.1 (1.78%)
|
1.1
|
7.5
|
6.5
|
44.3
|
66.8
|
|
Czech Republic
|
|
2.1 (3.4%)
|
2.0
|
1.9
|
19.0
|
17.5
|
62.4
|
|
Switzerland
|
|
1.6 (2.83%)
|
1.9
|
6.7
|
22.9
|
80.9
|
74.3
|
|
Romania
|
|
1.5 (2.88%)
|
9.4
|
1.8
|
47.4
|
9.0
|
25.9
|
|
Austria
|
|
1.1(1.78%)
|
2.9
|
3.8
|
33.7
|
43.8
|
82.9
|
|
Denmark
|
|
0.9 (2.75%)
|
0.5
|
3.0
|
8.8
|
52.0
|
58.3
|
|
India
|
South Asia
|
9 (1.55%)
|
132.9
|
21.0
|
10.1
|
1.6
|
8.0
|
|
Pakistan
|
|
1.7
|
160.8
|
2.7
|
85.1
|
1.4
|
4.6
|
| |
|
|
|
|
|
|
|
|
(To be continued on the next page)
(Continued)
|
Country
|
Area
|
PV installed capacity (GW) (PV penetration of total electricity demand)
|
Solar power generation potential (103×TWh)
|
GDP
(1011×
dollars)
|
Per capita power generation potential (104×kWh)
|
Per capita GDP
(103×
dollars)
|
Per capita electricity consumption
(102×kWh)
|
|
Thailand
|
Southeast Asia
|
2.2 (1.93%)
|
27.6
|
4.0
|
40.6
|
5.8
|
25.6
|
|
Philippines
|
|
0.9
|
9.9
|
2.9
|
9.8
|
2.9
|
7.0
|
|
Israel
|
West Asia
|
0.9 (2.85%)
|
4.2
|
3.0
|
50.1
|
35.7
|
64.7
|
|
Turkey
|
|
0.8 (0.48%)
|
75.3
|
7.2
|
95.7
|
9.1
|
39.0
|
|
Australia
|
Oceania
|
5.9 (3.85%)
|
1,592.4
|
13.4
|
6,696.1
|
56.3
|
99.4
|
|
South Africa
|
Africa
|
1.5 (1.03%)
|
202.6
|
3.1
|
368.7
|
5.7
|
41.7
|
Note: photovoltaic installed capacity and photovoltaic penetration of total electricity demand data are from the 2016 Global PV Market Bulletin of PVPS (Photovoltaic Power System Project); total electricity consumption data are from IEA (International Energy Agency).
5 Discussion
Solar energy is characterized by abundant reserves, uses of clean and environmentally friendly technology and is recognized as one of the most promising new energy sources. Although the solar power generation potential is optimistic, new technology is needed to make them happen.
Author Contributions
Liu, Q. H., Xin, X. Z., Zhang, H. L. and Zhong, B. designed the algorithms of dataset. Gong, W. and Wu, S. L. collected and processed data and made maps. Zhang, Q., Zhang, H. L. and Li, L. completed the data analysis and wrote the data paper.
References
[1] You, S. J., Sun, H. J., Ma, D. G., et al. Solar energy resource and application potential in china [J]. Urban Environment and Urban Ecology, 2002(2): 57-59.
[2] Li, K., He, F. N. Analysis on mainland China’s solar energy distribution and potential to utilize solar energy as an alternative energy source [J]. Progress in Geography, 2010, 29(9): 1049-1054. DOI: 10.11820/dlkxjz. 2010.09.004.
[3] Renewable Capacity Statistics 2017 [ED/OL]. http://www.irena.org/menu/index.aspx?mnu=Subcat&.
[4] Lurwan, S. M., Idrees, M. O., Ahmed, G. B., et al. GIS-based optimal site selection for installation of large-scale smart grid-connected photovoltaic (PV) power plants in Selangor, Malaysia [J]. American Journal of Applied Sciences, 2017, 14(1): 174-183. DOI: 10.3844/ajassp.2017.174.183.
[5] Charabi, Y., Gastli, A. PV site suitability analysis using GIS-based spatial fuzzy multi-criteria evaluation [J]. Renewable Energy, 2011, 36(9): 2554-2561. DOI: 10.1016/j.renene.2010.10.037.
[6] Zhang, Q., Xin, X. Z., Zhang, H. L., et al. Potential solar power generation dataset at 0.25° resolution in the Belt and Road and surround region (2015) [DB/OL]. Global Change Research Data Publishing & Repository, 2017. DOI:10.3974/geodb.2017.03.17.V1.
[7] GCdataPR Editorial Office. GCdataPR Data Sharing Policy [OL]. DOI:10.3974/dp.policy.2014.05 (Updated 2017).
[8] Wang, S. F., Leduc, S., Wang, S. C., et al. A new thinking for renewable energy model: remote sensing-based renewable energy model [J]. International Journal of Energy Research, 2009, 33(8): 778-786. DOI: 10.1002/er.1518.
[9] Wang, S. F., Koch, B. Determining profits for solar energy with remote sensing data [J]. Energy, 2010, 35(7): 2934-2938. DOI: 10.1016/j.energy.2010.03.025.