1 km/daily Evapotranspiration Data Product over China-ASEAN (2013)
Jia, L.* Hu, G. C. Zheng, C. L. Zhou, J. Wang, K. Li, Z. S. Liu, Q. H.*
State Key Laboratory of Remote Sensing Science, Institute of Remote Sensing and Digital Earth, Chinese Academy of Sciences, Beijing 100101, China
Abstract: Terrestrial actual evapotranspiration (ET), including evaporation from soil and water surfaces, evaporation of rainfall interception, transpiration of vegetation canopy and sublimation of snow and glaciers, is an important component of the terrestrial water cycle, it impacts the hydrological, energy, and carbon cycles. Considering the diverse landscapes and multi-climatic features in China and the Association of Southeast Asian Nations (ASEAN) region, a hybrid remotely sensed ET estimation model named ETMonitor was developed to estimate the daily actual ET of China-ASEAN region for 2013 1km resolution. The ETMonitor model uses a variety of biophysical parameters derived from microwave and optical remote sensing observations as input data to estimate the daily ET for all sky conditions. The 1km/daily Evapotranspiration Product over China-ASEAN (2013) was achieved in the Sinusoidal tile grid, and distributed in 40 adjacent non-overlapping tiles that are approximately 10°×10° (at the equator). The data size is 40 GB in compressed .tif format.
Keywords: China-ASEAN; Evapotranspiration; MuSyQ; ETMonitor
1 Introduction
Terrestrial actual evapotranspiration (ET), including evaporation from soil and water surfaces, evaporation of rainfall interception (wet canopy evaporation), transpiration of vegetation canopy and sublimation of snow and glaciers, is an important component of the terrestrial water cycle. In addition, ET (latent heat flux) is a crucial component of the land surface energy balance, and links the hydrological, energy, and carbon cycles. Accurate estimates of terrestrial ET are thus critical for the study of global and regional climate change, biogeochemical cycles, water balance, droughts and irrigation.
ASEAN is located south of China, covering a total land area of 4.436×10⁶ km2. The ASEAN is comprised of the Indochina Peninsula, Malay Peninsula and Malay Archipelago, and surrounded by seas and gulfs such as the South China Sea, the Andaman Sea and the gulf of Thailand. In 1967, the ASEAN was formed consisting of Indonesia, Malaysia, Philippines, Singapore and Thailand. Since then membership has expanded to include Brunei Darussalam, Vietnam, Laos, Myanmar and Cambodia making up the 10 member countries of ASEAN. Due to being located in the tropical area and the transition zone between Asia and Australia, the study of its climate and ecology is of special significance. The 1km/daily Evapotranspiration Data Product over China-ASEAN (2013)[1] was developed based on microwave and optical remote sensing observations. It was produced for all sky conditions, and is continuous and consistent at spatial and temporal scales. The characteristics of the ET product, the methodology and the procedures used to estimate the ET, the spatial distribution and its reliability, are presented in this paper, respectively.
2 Metadata of Dataset
The summary of the metadata of 1 km/daily Evapotranspiration Product over China-ASEAN (2013)[1] is summarized in Table 1. It includes the dataset full name, short name, authors, year of the dataset, temporal resolution, spatial resolution, data format, data size, data files, data publisher, and data sharing policy, etc.
3 Methods
Conventional ET estimation techniques, i.e., weighing lysimeter, Bowen Ratio (BR), Eddy Covariance (EC), and Large Aperture Scintillometer (LAS), are based on in-situ measurements. Alternatively, remotely sensed data are very promising due to their capability of spatial coverage and yet frequent repeat in time, and can be used to characterize land surface biophysical properties and serve as the main forcing of ET models[3,4].
3.1 Algorithm Methodology
Considering the diverse landscapes and multi-climatic features across China and the ASEAN countries, a hybrid remotely sensed ET estimation model named ETMonitor was developed to estimate the daily actual evapotranspiration. The ETMonitor model combines different ET parameterizations for the following land cover types: (1) water body; (2) snow/ice surface; and (3) soil-vegetation canopy. The theoretical formulation of the ETMonitor was given in previous work by Hu and Jia[5].
For the soil-vegetation canopy, the model is constructed with a dual-source scheme that distinguishes the energy partitioning and water fluxes between soil (evaporation) and vegetation (transpiration). The Shuttleworth-Wallace dual-source model[6], which is a variant form of Penman-Monteith equation, is adopted to account separately for the energy balance for vegetation and soil components of a soil-vegetation canopy unity. The aerodynamic and surface resistances are parameterized based on the remote sensing data and near-surface meteorological forcing data[6–9]. The soil surface resistance to vapor flux is parameterized as a function of minimum soil surface resistance and water content of the soil surface layer. The canopy surface resistance is estimated by scaling up leaf stomatal resistance with canopy leaf area. The leaf stomatal resistance depends on the minimum stomatal resistance, the environmental factors (solar radiation, air temperature, vapour pressure deficit), and the root zone available soil moisture. The minimum stomatal resistance, corresponding to optimum ambient conditions, is dependent on vegetation types.
Interception is the rainfall intercepted by the vegetation canopy and subsequently evaporated back to the atmosphere. The interception of the vegetation canopy (wet canopy evaporation) was estimated using a remote sensing based Gash model called RS-Gash model[10–11]. The reformulated Gash model[12] is forced by remote sensing observations of canopy structure (e.g., fractional vegetation cover, leaf area index) and rainfall intensity.
The classical Penman equation was used to estimate the evaporation from water surface. With respect to the sublimation of snow and ice (lake ice or glaciers) which occurs when the near-surface water vapor pressure is less than the saturated water vapor pressure, was estimated using the formula developed by Kuzmin.
Table 1 Summary of the MuSyQ-ET-1km-2013 metadata
|
Items
|
Description
|
|
Dataset full name
|
1 km/daily evapotranspiration product over China and the Association of Southeast Asian Nations for 2013
|
|
Dataset short name
|
MuSyQ-ET-1km-2013
|
|
Authors
|
Jia, L. I-1457-2014, State Key Laboratory of Remote Sensing Science, Institute of Remote Sensing and Digital Earth, Chinese Academy of Sciences, jiali@radi.ac.cn
Hu, G. C. L-6160-2016, State Key Laboratory of Remote Sensing Science, Institute of Remote Sensing and Digital Earth, Chinese Academy of Sciences, hugc@radi.ac.cn
Zheng, C. L. L-6182-2016, State Key Laboratory of Remote Sensing Science, Institute of Remote Sensing and Digital Earth, Chinese Academy of Sciences, zhengcl@radi. ac.cn
Zhou, J. G-6760-2011, State Key Laboratory of Remote Sensing Science, Institute of Remote Sensing and Digital Earth, Chinese Academy of Sciences, zhoujie@radi.ac.cn
Wang, K. L-6189-2016, State Key Laboratory of Remote Sensing Science, Institute of Remote Sensing and Digital Earth, Chinese Academy of Sciences, wangkun@radi.ac.cn
Li, Z. S. L-6882-2016, State Key Laboratory of Remote Sensing Science, Institute of Remote Sensing and Digital Earth, Chinese Academy of Sciences, lizs@radi.ac.cn
Liu, Q. H. S-1647-2016, State Key Laboratory of Remote Sensing Science, Institute of Remote Sensing and Digital Earth, Chinese Academy of Sciences, liuqh@radi.ac.cn
|
|
Geographic region
|
The geographic region covers the area: 10°55′12″S-53°32′24″N, 73°37′12″E-141°0′36″E
The region covers the area of the following 11 nations: Brunei, Cambodia, China, Indonesia, Laos, Malaysia, Myanmar, Philippines, Singapore, Thailand, and Vietnam
|
|
Year
|
2013
|
|
Temporal resolution
|
Daily
|
|
Spatial resolution
|
1 km
|
|
Data format
|
.img (ENVI)
|
|
Data size
|
40 GB
|
|
Data files
|
The MuSyQ-ET-1km-2013 dataset was archived in the Sinusoidal tile grid, and distributed in 40 adjacent non-overlapping tiles that are approximately 10°×10° (at the equator). The data type is 16-bit signed integer, the scale factor is 0.001, and the unit is mm/day
|
|
Foundation(s)
|
Ministry of Science and Technology of P. R. China (2012AA12A304, 2012AA12A305, 2013AA12A301)
|
|
Data publisher
|
Global Change Research Data Publishing & Repository, http://www.geodoi.ac.cn.
|
|
Address
|
No. 11A, Datun Road, Chaoyang District, Beijing 100101, China.
|
|
Data sharing policy
|
Data from the Global Change Research Data Publishing & Repository includes metadata, datasets (data products), and publications (in this case, in the Journal of Global Change Data & Discovery). Data sharing policy includes: (1) Data are openly available and can be free downloaded via the Internet; (2) End users are encouraged to use Data subject to citation; (3) Users, who are by definition also value-added service providers, are welcome to redistribute Data subject to written permission from the GCdataPR Editorial Office and the issuance of a Data redistribution license; and (4) If Data are used to compile new datasets, the ‘ten per cent principal’ should be followed such that Data records utilized should not surpass 10% of the new dataset contents, while sources should be clearly noted in suitable places in the new dataset[2]
|
3.2 Algorithm Implementation
The flow chart of the algorithm is shown in Figure 1. The ETMonitor model combines different ET parameterizations for the following land cover types: (1) for water body, the evaporation from water surface is estimated; (2) for snow/ice surface, the sublimation of snow and ice (lake ice or glaciers) is estimated; and (3) for soil-vegetation canopy, the canopy interception, transpiration and soil evaporation is estimated, respectively.
In the ETMonitor model, the biophysical variables derived from microwave and optical remote sensing observations include NDVI[13], albedo, surface layer volumetric soil water content, and land cover types. The near-surface meteorological forcing data, including air temperature, air pressure, dew point temperature, wind speed, precipitation, downward short-wave and long-wave radiation fluxes are essential to drive the ETMonitor, and can be derived from the European Centre for Medium-Range Weather Forecasts (ECMWF) Interim Re-Analysis (ERA-Interim) meteorological product.
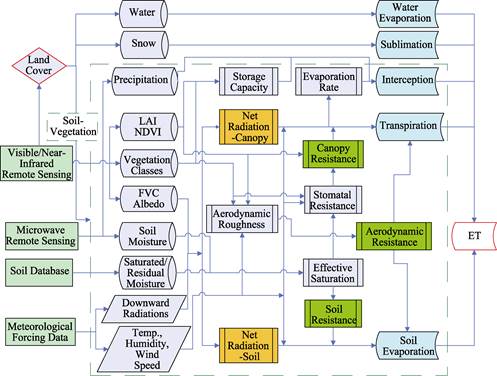
Figure 1 Flowchart of the ETMonitor model combining different ET parameterizations
4 Results and Validation
4.1 Data Products
The daily China-ASEAN ET product was produced at 1 km spatial resolution in the Sinusoidal tile grid[14], and distributed in 40 adjacent non-overlapping tiles that are approximately 10°×10° (at the equator). Each tile is about 1 GB for 2013 (365 files). The data type is 16-bit signed integer, spatial resolution is 1km, and temporal frequency is daily. The annual ET over China-ASEAN shows consistent patterns with the landscapes and the climate conditions (Figure 2). The Malay Archipelago is obviously being featured by the tropical rainforest climate (or equatorial climate) and typically hot and wet throughout the year, resulting that the annual ET (-1,000 mm) is higher than that in the Indochina Peninsula (-800 mm) characterized with tropical monsoon climate and tropical savannah climate (or tropical wet and dry climate). The annual ET of China (-400 mm) is the lowest across different countries of China-ASEAN due to the arid and semi-arid climate with less precipitation and low-to-moderate temperatures in northwest China.
The spatial distribution of ET is extremely uneven in China, because of the landscapes varied from North China (subarctic), central China, the South China (subtropical), the Loess Plateau and the Tibetan Plateau. The annual ET exhibited a distinguishable southeast to northwest decreasing gradient, corresponding to the climate conditions (e.g., precipitation, air temperature, and growing season length) and land cover/land use types. For the oases in the arid northwest China (e.g., Tarim River basin, Heihe River basin), especially for the agriculturally dominated regions whose natural climate (precipitation) alone cannot sustain the current level of agriculture, ET is much higher due to importing water by rivers and reservoirs through irrigation canals, or by pumping groundwater.
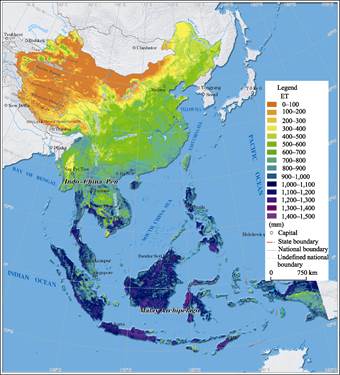
Figure 2 Spatial patterns of the annual ET in 2013 over China-ASEAN
4.2 Validation
Ground-based validation is crucial for evaluating the performance of the remotely sensed China-ASEAN ET product estimated by ETMonitor, which was evaluated using the ground measurements across different ecosystems at 1 weighing lysimeter site, i.e., Huailai (cropland)[15], and 4 eddy covariance flux sites, i.e., A’rou (alpine meadow)[16,17], Maqu (alpine meadow)[18], Linzhi (alpine meadow)[19], and Huazhaizi (desert)[16,17]. The MODIS evapotranspiration product MOD16[20], which is the first published global 1 km ET data set, was also evaluated using the ground measurements for the comparison with the China-ASEAN ET estimated by ETMonitor.
The single 1 km pixel of the remotely sensed ET where the in-situ site located was taken as the validation pixel due to the much small spatially representative area (source area) of ground measurements[21], and the pixel ET estimates can be different from ground measurements for the obvious spatial scale effects, especially over a heterogeneous landscape. The coefficient of determination (R2, the square of the correlation coefficient between remotely sensed ET estimates and ground measurements), and the root mean square error (RMSE), were computed for each site (Table 2). The R2/RMSE provides a measure of the consistency/difference between remotely sensed ET estimates and ground measurements, respectively. In general, fairly good results were obtained from this validation, showing that the ETMonitor estimated ET is closer to the ground measurements than MOD16 ET with better correlation, smaller RMSE between ETMonitor and ground measurements for these 5 in-situ sites.
Table2 The coefficient of determination R2 and root mean square error RMSE of the remotely sensed ET estimates vs. ground measurements in 2013 at 5 in-situ sites
|
Site (biome type)
|
R2
|
RMSE (mm d−1)
|
|
ETMonitor
|
MOD16
|
ETMonitor
|
MOD16
|
|
Huailai (cropland)
|
0.84
|
0.79
|
0.72
|
1.31
|
|
A’rou (alpine meadow)
|
0.92
|
0.70
|
0.89
|
1.09
|
|
Maqu (alpine meadow)
|
0.94
|
0.74
|
0.34
|
0.56
|
|
Linzhi (alpine meadow)
|
0.89
|
0.79
|
0.47
|
0.57
|
|
Huazhaizi (desert)
|
0.74
|
0.10
|
0.64
|
1.12
|
5 Discussion and Conclusion
The daily China-ASEAN ET product was produced based on the ETMonitor model, which was forced by the near-surface meteorological forcing data. The meteorological data used in this work was derived from the ERA-Interim global reanalysis meteorological product due to the lack of spatially and temporally complete in-situ observations. The typically used reanalysis products include NCEP-NCAR reanalysis and Climate Forecast System Reanalysis (CFSR) from the National Centers for Environmental Prediction (NCEP); Modern-Era Retrospective Analysis for Research and Applications (MERRA) and Global Land Data Assimilation System (GLDAS) from the Goddard Space Flight Center (GSFC); and ECMWF Interim Re-Analysis (ERA-Interim). Decker, et al. evaluated these reanalysis products using in-situ observations, and the results demonstrate that the ERA-Interim dataset is better than all of the rest[22]. The global reanalysis products have a coarser spatial resolution than the biophysical variables derived from optical remote sensing observations. The region of China-ASEAN has a steep topography, and the topographic influences (elevation, aspect and slope) are important considerations to downscale the meteorological data in areas with high localized relative relief using dynamic downscaling[23] or statistical downscaling approaches.
Soil moisture is another important forcing data for the development of the China-ASEAN ET product. The soil moisture data derived from microwave sensors, such as the Advanced Microwave Scanning Radiometer-Earth Observing System (AMSR-E), AMSR2, Advanced Scatterometer (ASCAT), Soil Moisture and Ocean Salinity (SMOS), Soil Moisture Active and Passive (SMAP) Mission, and Fengyun-3 (FY-3) MicroWave Radiation Imager (MWRI) have a coarse spatial resolution (25–50 km) which is not sufficient for regional scale studies. The accuracy and spatial resolution will improve with the development of retrieval and downscaling algorithms[24], which will be used to significantly improve the ET products and enhance the consistency between the remotely sensed precipitation, soil moisture and ET. These remotely sensed hydrologic products can be combined for the integrated study of water cycle and water resource management.
Author Contributions
Jia, L. and Liu, Q. H. designed the study. Zhou, J. and Li, Z. S. contributed to the forcing data processing. Jia, L. designed the algorithms of dataset. Hu, G. C. implemented the algorithms. Zheng, C. L. and Wang, K. contributed to the data validation. Jia, L. and Hu, G. C. wrote the data paper.
Acknowledgements
We gratefully acknowledge the efforts of researchers at the in-situ measurement sites. We also thank the reviewers and editors for their constructive comments that greatly helped improve this data paper.
References
[1] Jia, L., Hu, G. C., Zheng, C. L., et al. 1 km/daily evapotranspiration product over China and the Association of Southeast Asian Nations for 2013 [DB/OL]. Global Change Research Data Publishing & Repository, 2015. DOI: 10.3974/geodb.2015.01.11.V1.
[2] GCdataPR Editorial Office. GCdataPR Data Sharing Policy [OL]. DOI: 10.3974/dp.policy.2014.05 (updated 2017).
[3] Kalma, J. D., McVicar, T. R., McCabe, M. F. Estimating land surface evaporation: A review of methods using remotely sensed surface temperature data [J]. Surveys in Geophysics, 2008, 29(4/5): 421-469.
[4] Li, Z. L., Tang, R. L., Wan, Z., et al. A review of current methodologies for regional evapotranspiration estimation from remotely sensed data [J]. Sensors, 2009, 9(5): 3801-3853.
[5] Hu, G. C., Jia, L. Monitoring of evapotranspiration in a semi-arid inland river basin by combining microwave and optical remote sensing observations [J]. Remote Sensing, 2015, 7(3): 3056-3087.
[6] Shuttlewotth, W. J., Wallace, J. S. Evaporation from sparse crops—an energy combination theory [J]. Quarterly Journal of the Royal Meteorological Society, 1985, 111(469): 839-855.
[7] Bastiaanssen, W. G. M., Cheema, M. J. M., Immerzeel, W. W., et al. Surface energy balance and actual evapotranspiration of the transboundary Indus Basin estimated from satellite measurements and the ETLook model [J]. Water Resources Research, 2012, 48: W11512.
[8] Jarvis, P. G. The interpretation of the variations in leaf water potential and stomatal conductance found in canopies in the field [J]. Philosophical Transactions of the Royal Society B–Biological Sciences, 1976, 273(927): 593-610.
[9] Stewart, J. B. Modelling surface conductance of pine forest [J]. Agricultural and Forest Meteorology, 1988, 43(1): 19-35.
[10] Cui, Y. K., Jia, L. A modified Gash model for estimating rainfall interception loss of forest using remote sensing observations at regional scale [J]. Water, 2014, 6(4): 993-1012.
[11] Cui, Y. K., Jia, L., Hu, G. C., et al. Mapping of interception loss of vegetation in the Heihe River basin of China using remote sensing observations [J]. IEEE Geoscience and Remote Sensing Letters, 2015, 12(1): 23-27.
[12] Gash, J. H. C., Lloyd, C. R., Lachaud, G. Estimating sparse forest rainfall interception with an analytical model [J]. Journal of Hydrology, 1995, 170(1/4): 79-86.
[13] Li, J., Zeng, Y.L., Liu, Q. H., et al. 2015. 1 km/5-day NDVI product over China and the Association of Southeast Asian Nations for 2013 [DB/OL]. Global Change Research Data Publishing & Repository, 2015. DOI:10.3974/geodb.2015.01.16.V1.
[14] MODIS Grids. Sinusoidal Tile Grid. http://modis-land.gsfc.nasa.gov/MODLAND_grid.html.
[15] Liu, S. M., Xu, Z. W., Zhu, Z. L., et al. Measurements of evapotranspiration from eddy-covariance systems and large aperture scintillometers in the Hai River Basin, China [J]. Journal of Hydrology, 2013, 487(9): 24-38.
[16] Liu, S. M., Xu, Z. W., Wang, W. Z., et al. A comparison of eddy-covariance and large aperture scintillometer measurements with respect to the energy balance closure problem [J]. Hydrology and Earth System Sciences, 2011, 15(4): 1291-1306.
[17] Li, X., Cheng, G. D., Liu, S. M., et al. Heihe Watershed Allied Telemetry Experimental Research (HiWATER): Scientific objectives and experimental design [J]. Bulletin of the American Meteorological Society, 2013, 94(8): 1145-1160.
[18] Wang, S. Y., Zhang, Y., Lv, S. H., et al. Estimation of turbulent fluxes using the flux-variance method over an alpine meadow surface in the eastern Tibetan Plateau [J]. Advances in Atmospheric Sciences, 2013, 30(2): 411-424.
[19] Ma, Y. M., Kang, S. C., Zhu, L. P., et al. Tibetan Observation and Research Platform: Atmosphere–land interaction over a heterogeneous landscape [J]. Bulletin of the American Meteorological Society, 2008, 89(10): 1487-1492.
[20] Mu, Q. Z., Zhao, M. S., Running, S.W. Improvements to a MODIS global terrestrial evapotranspiration algorithm [J]. Remote Sensing of Environment, 2011, 115(8): 1781-1800.
[21] Jia, Z. Z., Liu, S. M., Xu, Z. W., et al. Validation of remotely sensed evapotranspiration over the Hai River Basin, China [J]. Journal of Geophysical Research, 2012, 117: D13113.
[22] Decker, M., Brunke, M. A., Wang, Z., et al. Evaluation of the reanalysis products from GSFC, NCEP, and ECMWF using flux tower observations [J]. Journal of Climate, 2012, 25(6): 1916-1944.
[23] Pan, X. D., Li, X., Shi, X. K., et al. Dynamic downscaling of near-surface air temperature at the basin scale using WRF—a case study in the Heihe River Basin, China [J]. Frontiers of Earth Science, 2012, 6(3): 314-323.
[24] Shi, J. C., Du, Y., Du, J. Y., et al. Progresses on microwave remote sensing of land surface parameters [J]. Science China Earth Sciences, 2012, 55(7): 1052-1078.