Spatial Pattern Dataset and
Analysis of Land Use and Ecosystem Services in Yarkant River Basin (1978‒2018)
Wang, J. P.1 Mamat, A.1* Ma, Y. X.2
1. Kashgar Satellite Data Receiving Station,
Aerospace Information Research Institute, Chinese Academy of Sciences, Kashgar
844000, China;
2. Key Laboratories of Digital Earth Sciences,
Aerospace Information Research Institute, Chinese Academy of Sciences, Beijing
100094, China
Abstract: Using Landsat images acquired in 1978,
1988, 1998, 2008, and 2018, we analyzed the land use and ecosystem services in
the Yarkant River basin from 1978 to 2018. The results showed that: (1) Over
the period 1978–2018, land use changed significantly. The area of cultivated
land, forest land, and wetland increased by 338.9??103 hm2,
8.23??103 hm2, and 42.69??103 hm2,
respectively, while the area of grassland, water body, and unused land
decreased by 59.2??103 hm2, 103.21??103 hm2, and 227.43??103
hm2, respectively. (2) From 1978 to 2018, the value of ecosystem
services in the Yarkant River basin exhibited a decreasing-increasing-decreasing
trend, with an overall decrease. The total value of ecosystem services
decreased from 425.86??108
Yuan in 1978 to 424.43??108
Yuan in 1988, then increased to 440.67??108
Yuan in 1998, before decreasing again to 417.00??108
Yuan in 2018. (3) The value of
ecosystem services shows that the reduction in the value of regulatory
functions outweighs the changes in the value of other functions, and the change
in the value of regulatory services is synchronous and identical to the change
in total ecosystem services. The ecosystem service function of the Yarkant
River basin is essentially dominated by regulatory functions. (4) From 1978 to 2018, the sensitivity
index of the ecosystem service value of each land type in the Yarkant River
basin was less than 1, indicating that the value of ecosystem services in this
region lacks elasticity. In conclusion, the land use changes in the Yarkant
River basin coincide with socioeconomic construction activities in this region,
providing some scientific basis and practical references for land use planning,
ecological construction, and regional sustainable development.
Keywords: Yarkant River basin; land use/cover change
(LUCC); ecosystem service value
(ESV); sensitivity coefficient
(CS)
1 Introduction
Land use/cover change (LUCC) is a hot
topic in the field of global environmental changes and has a significant impact on the atmosphere, water, soil,
biodiversity, and human activities[1]. The study of LUCC enables the
impact of land use changes on regional environmental variations to be assessed,
and therefore provides scientific guidance for regional ecological construction
and sustainable development[2]. LUCC influences the regional
ecological process and causes changes in the soil, water, and atmosphere of the
surrounding area[3]. Thus, LUCC studies not only identify the transformation
of land use structures induced by human activities but also reflect the
spatiotemporal dynamics of the regional landscape that result in structural and
functional changes to ecosystems. Hence, studying the changes in regional
ecosystem service value under the influences of LUCC is an important topic[4].
At present, the
energy evaluation method, benefit conversion method, and valuation method are the main approaches for estimating the value
of regional ecosystem services[5]. Of these, the valuation method
is widely applied in calculating ecosystem service value, and the results
are always converted into a monetary value. The valuation method is best suited to comparisons of different ecosystem service
functions within a certain ecosystem but is also useful for comparing specific
ecosystem service functions among diverse ecosystems[6]. The Tarim
River is the longest inland river in China, and its upper reaches are made up
of three headwaters: Aksu River, Hotan River, and Yarkant River[7]. Since 2001, the coordinated
ecological protection and economic development of the Tarim River basin have
seen the government invest significant funds (107´108 Yuan) in implementing
an integrated management project for the Tarim River basin. Under this project,
the ecological environment of the lower reaches of Tarim River has been
improved to some extent, restoring the ecological corridor of this stretch of
the river[8]. The Yarkant River is an important headwater of the Tarim River and is one of the main rivers in the Tarim Basin. In
this study, based on remote sensing data collected in 1978, 1988, 1998, 2008,
and 2018 from the Yarkant River basin, the influence of LUCC on the ecosystem
service value is analyzed over the 41-year study period.
2 Metadata of the
Dataset
|
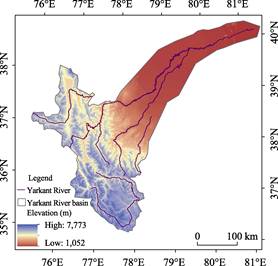
Figure 1 Topographic map of Yarkant River basin
|
This study examines the variations in the
spatial structure of ecological land use and ecosystem service values in the
Yarkant River basin from 1978 to 2018. The main metadata elements analyzed in
this study[9] are presented in Table 1.
3 Research
Area
The Yarkant River basin (35??50'N–40??31'N, 74??28'E–80??54'E) is located in the southwest of Xinjiang Uygur autonomous
region (Figure 1)[11], at the western margin of the Tarim River
basin. The Yarkant River basin
enjoys rich light and heat resources. Because of the blocking effect of the
Pamir Mountains, Karakoram Mountains, and southern Tianshan Mountains, the warm
and moist air of the Atlantic and Indian oceans cannot reach the Yarkant River
basin, resulting in perennial drought and dry conditions, with an
average annual rainfall of only 30–60 mm and a typical continental climate[5].
The Yarkant River basin sees only a small annual temperature change but does
have abundant solar-thermal resources. The average temperature range is
11.4–12.3 ??C and the long frost-free period provides climatic conditions that
are very helpful for regional agricultural production. The middle area of the
Yarkant River basin is highly suited to the cultivation of long-staple cotton
and melons as well as other fruits. Thus, this region is famous for cotton, dry
fruits, and fruit production (walnuts, almonds, red jujube, and pomegranate)[12].
In the Yarkant
Table 1 Metadata summary of ??Variation dataset of
land use and its ecosystem service value in Yarkant River basin (1978–2018)??
|
Items
|
Description
|
|
Dataset full name
|
Variation dataset of land use and its ecosystem
service value in Yarkant River basin (1978–2018)
|
|
Dataset short name
|
LU_EcoSerValue_Yarkant
|
|
Authors
|
Wang, J. P., Kashgar Satellite Data Receiving
Station of Aerospace Information Research Institute, Chinese Academy of
Sciences, wangjp@radi.ac.cn
Mamat, A., Kashgar Satellite Data Receiving Station
of Aerospace Information Research Institute, Chinese Academy of Science, ayinuer@radi.ac.cn
Ma, Y. X., Key Laboratories of Digital Earth
Sciences, Institute of Aerospace Information Research Institute, Chinese
Academy of Sciences, mayx@radi.ac.cn
|
|
Geographical region
|
35??50'E–40??31'N,
74??28'E–80??54'E
|
|
Year
|
1978, 1988, 1998, 2008, 2018 Spatial
resolution
30 m??30 m
|
|
Data format
|
.shp, Grid, .xlsx
Data size 4.04
MB (after compression)
|
|
Data files
|
Dataset consists of two folders and one Excel file,
mainly including the following:
Folder 1 contains three sub-folders: (i) Research
area .shp data, (ii) Yarkant River .shp data, (iii) Terrain data of the study
area
Folder 2 contains five remote sensing
classified images showing the results for 1978 (MSS), 1988 (TM), 1998 (TM),
2008 (ETM+), and 2018 (OLI). These images were prepossessed using ENVI.5 and
ArcGIS10.0 software and the land use types of the Yarkant River basin were divided
into six land use types: cultivated land, forest land, grassland, water area,
construction land, and unused land
The Excel file contained five tables (Tables 3–7):
Table 3 contains the ecosystem service equivalent values per unit area in the
Yarkant River basin; Table 4 contains the values of ecosystem services per
unit area in the Yarkant River basin; Table 5 contains the area ratios and
change rates of different land use types in the Yarkant River basin,
1978–2018; Table 6 contains the ecosystem service values and their changes in
the Yarkant River basin; Table 7 contains sensitivity coefficient changes of
ESV for different land use types for 1978, 1988, 1998, 2008, and 2018 in the
Yarkant River basin
|
|
Foundation
|
|
|
Data computing
environment
|
ENVI 5.0 and ArcGIS10.0
|
|
Data publisher
|
Global Change Research Data Publishing &
Repository, http://www.geodoi.ac.cn
|
|
Address
|
No. 11A, Datun Road, Chaoyang District, Beijing
100101, China
|
|
Data sharing policy
|
Data from
the Global Change Research Data Publishing & Repository includes
metadata, datasets (data products), and publications (in this case, in the Journal of Global Change Data & Discovery). Data sharing policy include: (1) Data
are openly available and can be freely downloaded via the Internet; (2) End
users are encouraged to use Data subject to citation; (3)
Users, who are by definition also value-added service providers, are welcome
to redistribute Data subject to written permission from the GCdataPR
Editorial Office and the issuance of a Data redistribution license; and (4) If Data
are used to compile new datasets, the 'ten percent principal' should be
followed such that Data records utilized should not
surpass 10% of the new dataset contents, while sources should be noted in
suitable places in the new dataset[10]
|
|
Communication and
searchable system
|
DOI, DCI, CSCD, WDS/ISC, GEOSS, China GEOSS,
Crossref
|
River basin, the pressures of economic
development and ecological protection coexist. In the past few decades, with
rapid regional changes in land use, the regional eco-environmental structure
has changed dramatically. Therefore, the rational exploitation of natural
resources and sustainable development of the eco-environment is essential in
achieving societal goals. Understanding the current ecological and
environmental changes has great significance in terms of coordinating the
economic development, ecological protection, and sustainable development of
this arid region.
4 Methods
4.1
Data Collection and Pre-possessing
The data used in
this study include remote sensing data, topographic data (digital elevation
model, DEM), and socioeconomic data. The remote sensing data were largely
Landsat remote sensing data, such as the 1978 (MSS), 1988(TM), 1998 (TM), 2008
(ETM+), and 2018 (OLI) data obtained from the geospatial data cloud and data
sharing website of the Institute of Aerospace Information Research Institute,
Chinese Academy of Sciences. The remote sensing data analyzed in this study
were collected from June to August because there are abundant water resources
during this period and the natural vegetation cover flourishes in the Yarkant
River basin. The DEM data are taken from the environmental data-sharing network
of the Chinese Academy of Sciences. The socioeconomic data were mainly obtained
from the ??Xinjiang statistical yearbook?? and ??Kashgar statistical yearbook."
In the process of image interpretation, this study adopts three-band
combinations, 2, 3, and 4, and the geometric correction, registration, visual
interpretation, and digital processing of remote sensing images for each period
were carried out using ENVI.5 and ArcGIS10.0. According to China??s current land
use classification system, the Yarkant River basin land use types can be
divided into six categories, namely cultivated land, forest land, grassland,
waterbody, wetland, and unused land (Figure 2). An accuracy test indicated that
the final classification was more than 80% correct, which satisfies the
research requirements.
4.2
Analysis Method of Land Use/Cover Change
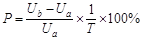
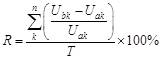
The land uses
dynamic attitude (P) and land use total dynamic attitude (R) are
key indicators in describing the rate of change of regional land use/cover. The
land use dynamic attitude quantitatively reflects the spatial and temporal
differences of land use changes[13], and is calculated as:
 (1)
(1)
 (2)
(2)
where P refers
to the dynamic attitude of a certain land use type during the research period
and R refers to the total dynamic attitude of regional land use change
during the research period. k denotes the land use type, and Ua,
Ub are the areas of a particular land use type during periods
a and b. T is the study period.

Figure 2 LUCC in
the Yarkant River basin (1978–2018)
4.3
Evaluation of Ecosystem Service Value
4.3.1 Selection and Correction of Value Coefficient
The ??World
ecosystem service equivalent value??[14] and the ??Chinese terrestrial
ecosystem service equivalent value per unit area??[6, 15] are widely
used to assess the ecosystem service value. The ecosystem equivalent value is
calculated as follows[3] (Tables 2 and 3):
 (3)
(3)
where Eij
refers to the equivalent factor value of land use type i and ecological
service function type j; eij refers to the
correction coefficient of ecological service function type j for
land use type i, and Ea refers to the ecosystem
service equivalent value per unit area in China.
Table 2 Correction coefficients
of different ecosystems in arid regions
|
Ecological system
|
Cultivated land
|
Forest land
|
Grassland
|
Water body
|
Wetland
|
Unused Land
|
|
Correction coefficient
|
0.37
|
0.422,2
|
0.333,4
|
0.61
|
0.69
|
0
|
Table 3 Ecosystem service
equivalent value per unit area in Yarkant River basin
|
Service function
|
Cultivated land
|
Forest land
|
Grassland
|
Water body
|
Wetland
|
Unused land
|
|
Regulation
Services
|
Gas regulation
|
0.19
|
1.48
|
0.27
|
0.00
|
1.24
|
0.00
|
|
Climatic regulation
|
0.33
|
1.14
|
0.30
|
0.30
|
11.80
|
0.00
|
|
Water regulation
|
0.22
|
1.35
|
0.27
|
13.54
|
10.70
|
0.03
|
|
Waste treatment
|
0.61
|
1.64
|
0.44
|
11.82
|
12.54
|
0.01
|
|
Supporting
Services
|
Soil formation
|
0.54
|
0.56
|
0.65
|
0.01
|
1.18
|
0.02
|
|
Biodiversity protection
|
0.26
|
1.38
|
0.36
|
1.62
|
1.73
|
0.34
|
|
Production
Services
|
Food production
|
0.37
|
0.05
|
0.10
|
0.06
|
0.21
|
0.01
|
|
Raw material
|
0.04
|
1.10
|
0.02
|
0.01
|
0.05
|
0.00
|
|
Cultural
Services
|
Recreation and culture
|
0.00
|
0.54
|
0.01
|
2.82
|
3.83
|
0.01
|
|
Total
|
2.56
|
9.24
|
2.42
|
30.17
|
43.27
|
0.42
|
4.3.2 Ecosystem Service Value Calculation
The total value of ecological services can be estimated using the
valuation method and the ecosystem service equivalent value (Table 3). The
ecosystem service value (ESV) is calculated as:
 (4)
(4)
where ESV
refers to the total value of ecosystem services in the study area, Si
refers to the total area of land use type i, and VCkf refers
to the value coefficient of land use type k for ecological function f.
VCkf can be calculated as:
 (5)
(5)
where Eij
refers to the ecological service function equivalent value of revised land use j
concerning original land use i, and V refers to the economic
value of the food production service function per unit of the agri-ecosystem. V
can be calculated according to:
 (6)
(6)
where n is the crop type. The Yarkant River basin includes
Yarkant County, Poskam County, Kargilik County, Makit County, and Maralbexi
County. The main crops in these areas are wheat, rice, corn, padanmu, red
dates, walnuts, and beans. Pi refers to the current price of
grain crops (Yuan·t-1), q refers
to the per unit area yield of grain type i (t·hm-2), and m
refers to the area of grain crop i (hm2). M denotes
the total area of food crops (hm2). According to the statistical yearbook,
the average economic value of V in the study area for 1978, 1988, 1998,
2008, and 2018 is 1575.5 (Yuan·hm-2·a-1). Finally, using
Equation (4), the ESV coefficients of the six land types in the Yarkant River
basin can be calculated. The results are presented in Table 4.
Table 4 Value of ecosystem services per unit
area in Yarkant River basin
|
Service function
|
Cultivated land
|
Forest land
|
Grassland
|
Water body
|
Wetland
|
Unused land
|
|
Regulation Services
|
Gas regulation
|
291.5
|
2,331.4
|
425.4
|
0.0
|
1,956.8
|
0.0
|
|
Climatic regulation
|
518.8
|
1,798.9
|
472.7
|
468.5
|
18,589.3
|
0.0
|
|
Water regulation
|
349.8
|
2,129.9
|
425.4
|
21,331.3
|
16,850.0
|
47.3
|
|
Waste treatment
|
851.1
|
877.9
|
1,024.1
|
10.9
|
1,858.9
|
31.5
|
|
Supporting Services
|
Soil formation
|
956.0
|
2,590.5
|
693.2
|
18,618.6
|
19,763.4
|
15.8
|
|
Biodiversity protection
|
413.9
|
2,173.1
|
567.2
|
2,549.3
|
2,717.7
|
535.7
|
|
Production Services
|
Food production
|
582.9
|
72.0
|
157.6
|
98.0
|
326.1
|
15.8
|
|
Raw material
|
58.3
|
1,727.0
|
31.5
|
10.9
|
76.1
|
0.0
|
|
Cultural
Services
|
Recreation and culture
|
5.8
|
849.1
|
15.8
|
4,444.9
|
6,033.4
|
15.8
|
|
Total
|
2.56
|
4,028.1
|
14,549.8
|
3,812.7
|
47,532.3
|
68,171.7
|
4.3.3 Sensitivity Analysis
The coefficient of sensitivity (CS) indicates the degree to which ESV
depends on the value coefficient (VC) over time[16]. When CS<1,
ESV is considered inelastic concerning the ecosystem VC. The greater the value
of CS, the more critical the accuracy of the ecological VC when evaluating ESV.
In this study, based on the ecological service value coefficients (Table 3), we
calculated CS by Equation (7) by adjusting the ESV coefficients for each land
use type by 50% and then calculating the corresponding change in ESV.
 (7)
(7)
where CS
refers to the sensitivity coefficient, ESV is the total ecological
service value, VCik and VCjk are the
initial and adjusted value coefficients, respectively, and k is the land
use type.
5 Data Results and Analysis
5.1
Dataset Composition
The
dataset consists of two folders and one Excel file, as shown in Table 1. Folder
1 contains three sub-folders to describe the study area. Folder 2 contains five
remote sensing classified images showing the results for 1978 (MSS), 1988 (TM),
1998 (TM), 2008 (ETM+), and 2018 (OLI). The Excel file contained five tables (Tables
3–7).
5.2 Results
5.2.1 Land Use/Cover Change
Changes in land
use and land cover mainly occur in the oasis and desert ecotone areas of arid
and semiarid regions. From the LUCC results for the Yarkant River basin, it is
clear that very significant changes occurred during the study period (Table 5,
Figure 2).
The Yarkant River basin
has a total area of 7.46??106 hm2, of which the largest
proportion is unused land (44.71% in 1978, 45.05% in 1988, 44.47% in 1998,
44.45% in 2008, and 41.66% in 2018). The proportion of cultivated land has
steadily increased (1.98% in 1978, 14.05% in 1988, 15.24% in 1998, 21.98% in
2008, and 63.51% in 2018). From 1978 to 2018, the total dynamic attitude of
LUCC is 7.26%; from 1978 to 1988 it was 0.415%, from 1988 to 1998 it was
13.25%, from 1998 to 2008 it was 1.25%, and from 2008 to 2018 it was 10.82%.
Table 5 indicates that
significant LUCC occurred in the study area over the 41 years considered here,
especially after 2008, and the rate of change became significantly faster. From
1978 to 2018, the rate of increase in land use was most pronounced for wetland
(249.13%), followed by cultivated land (63.51%), water body (20.35%), forest
land (7.02%), unused land (6.82%), and grassland (2.01%). The proportion of cultivated
land increased very obviously in this period, with an average annual increase
of 8.5??103 hm2. The other notable change in land use type
concerns unused land, which decreased by 227.43??103 hm2
during the 41 years. Moreover, the areas of a water body and grassland
decreased by 103.2??103 hm2 and 59.2??103 hm2,
respectively, while wetlands and woodland increased by 42.7??103 hm2
and 8.2??103 hm2, respectively.
Table 5 Area ratios and change rates of different
land use types in Yarkant River basin (1978–2018) (%)
|
Land Use Type
|
1978
|
1988
|
1998
|
2008
|
2018
|
1988-
1978
|
1998-
1988
|
2008-
1998
|
2018-
2008
|
2018-
1978
|
|
Cultivated land
|
7.15
|
7.30
|
8.32
|
9.59
|
11.70
|
0.20
|
1.41
|
1.52
|
2.20
|
1.59
|
|
Forest land
|
1.57
|
1.54
|
1.67
|
1.56
|
1.68
|
-0.23
|
0.89
|
-0.69
|
0.81
|
0.18
|
|
Grassland
|
39.53
|
39.11
|
38.22
|
37.49
|
38.74
|
-0.11
|
-0.23
|
-0.19
|
0.33
|
-0.05
|
|
Water body
|
6.80
|
6.80
|
6.85
|
6.51
|
5.42
|
0.00
|
0.08
|
-0.50
|
-1.68
|
-0.51
|
|
Wetland
|
0.23
|
0.22
|
0.47
|
0.41
|
0.80
|
-0.35
|
11.24
|
-1.40
|
9.79
|
6.23
|
|
Unused land
|
44.71
|
45.04
|
44.47
|
44.45
|
41.66
|
0.07
|
-0.13
|
0.00
|
-0.63
|
-0.17
|
5.2.2 Response of Ecological Service Value to Land Use Change
To estimate the ecological service value, the revised coefficients were
applied to the corresponding formula and the ecosystem service value of the
Yarkant River basin was calculated. The results are
presented in Table 6. It can be seen that the total ecosystem services value of
the Yarkant River basin has gradually decreased, although the whole process is
not monotonic. From 1978 to 1988, the ecological service value decreased by
1.43??108 Yuan, before increasing from 1988 to 1998 by 16.24??108
Yuan and then decreasing again from 1998 to 2018 by 23.68??108 Yuan.
Over the whole study period, there is a decreasing trend, resulting in a total
ecosystem value loss of 8.87??108 Yuan. In 1978, 1988, 1998, 2008,
and 2018, the production function of the study area was 41.55??108 Yuan,
41.12??108 Yuan, 45.39??108 Yuan, 44.19??108 Yuan,
and 52.39??108 Yuan, respectively, and the value of the regulatory
function was 346.47??108 Yuan, 345.57??108 Yuan, 355.54??108
Yuan, 342.99??108 Yuan, and 326.49?? 108 Yuan,
respectively. The value of supporting functions was 12.25??108 Yuan,
12.21??108 Yuan, 12.84??108 Yuan, 13.14??108 Yuan,
and 14.49??108 Yuan, respectively. The cultural functions had a value
of 12.25??108 Yuan, 12.21??108 Yuan, 12.84??108 Yuan,
13.14??108 Yuan, and 14.49??108 Yuan, respectively.
Table 6 Ecosystem service value and its changes
in Yarkant River basin
|
Service function
|
The total value of ecological
services (108 Yuan)
|
Value change (108Yuan)
|
|
1978
|
1988
|
1998
|
2008
|
2018
|
1978‒
|
1988‒
|
1998‒
|
2008‒
|
1978‒
|
|
1988
|
1998
|
2008
|
2018
|
2018
|
|
Regulation services
|
Gas regulation
|
17.17
|
16.99
|
17.53
|
17.28
|
18.93
|
-0.18
|
0.54
|
-0.25
|
1.65
|
1.76
|
|
Climatic regulation
|
24.38
|
24.13
|
27.86
|
26.91
|
33.46
|
-0.25
|
3.74
|
-0.95
|
6.54
|
9.08
|
|
Water regulation
|
129.58
|
129.33
|
133.5
|
127.12
|
115.8
|
-0.25
|
4.13
|
-6.33
|
-11.37
|
-13.82
|
|
Waste treatment
|
37.2
|
36.94
|
37.33
|
37.41
|
40.26
|
-0.26
|
0.39
|
0.08
|
2.85
|
3.06
|
|
Supporting services
|
Soil formation
|
126.94
|
126.63
|
131.6
|
126.15
|
119.2
|
-0.31
|
4.92
|
-5.4
|
-6.98
|
-7.77
|
|
Biodiversity protection
|
52.75
|
52.67
|
53.2
|
52.31
|
51.3
|
-0.08
|
0.54
|
-0.89
|
-1.01
|
-1.44
|
|
Production services
|
Food production
|
8.92
|
8.93
|
9.34
|
9.76
|
10.81
|
0.01
|
0.41
|
0.42
|
1.05
|
1.89
|
|
Raw material
|
3.33
|
3.28
|
3.5
|
3.38
|
3.68
|
-0.05
|
0.21
|
-0.12
|
0.3
|
0.34
|
|
Cultural services
|
Recreation and culture
|
25.6
|
25.54
|
26.9
|
25.4
|
23.63
|
-0.06
|
1.37
|
-1.5
|
-1.77
|
-1.97
|
|
Total
|
425.86
|
424.43
|
440.7
|
425.72
|
417
|
-1.43
|
16.24
|
-14.95
|
-8.73
|
-8.87
|
5.2.3 Ecosystem Services Sensitivity Analysis
According to the
sensitivity coefficients formula, the ecological value coefficients of various
land use types were adjusted up or down by 50% and the sensitivity indexes were
calculated for 1978, 1988, 1998, 2008, and 2018. The results are presented in
Table 7.
Table 7 Sensitivity
coefficient change of ESV for
different land use types in 1978, 1988, 1998, 2008, and 2018 in Yarkant River
basin
|
Value coefficient (VC??50%)
|
1978(%)
|
CS
|
1988(%)
|
CS
|
1998(%)
|
CS
|
2008(%)
|
CS
|
2018(%)
|
CS
|
|
Cultivated land
|
2.524
|
0.05
|
2.582
|
0.052
|
2.837
|
0.057
|
3.384
|
0.068
|
4.214
|
0.084
|
|
Forest land
|
2.003
|
0.04
|
1.963
|
0.039
|
2.059
|
0.041
|
1.984
|
0.04
|
2.189
|
0.044
|
|
Grassland
|
13.201
|
0.264
|
13.105
|
0.262
|
12.333
|
0.247
|
12.524
|
0.25
|
13.211
|
0.264
|
|
Water body
|
28.309
|
0.566
|
28.402
|
0.568
|
27.562
|
0.551
|
27.11
|
0.542
|
23.029
|
0.461
|
|
Wetland
|
1.372
|
0.027
|
1.329
|
0.027
|
2.718
|
0.054
|
2.420
|
0.048
|
4.891
|
0.098
|
|
Unused land
|
2.591
|
0.052
|
2.619
|
0.052
|
2.491
|
0.050
|
2.577
|
0.052
|
2.466
|
0.049
|
The sensitivity coefficients of
the six land use types in 1978, 1988, 1998, 2008, and 2018 varied from 0.027 to
–0.568. These values are less than 1, indicating that ESV in the study area is
inelastic for VCik, and the results are credible. Because
water bodies and grassland have larger ecosystem service value coefficients,
the sensitivity coefficients for these land use types are larger. Water bodies
have the largest sensitivity coefficients (above 0.46 in all five periods),
followed by grassland (above 0.247 in all five
periods). Farmland, woodland, wetland, and unused land have similar
sensitivity coefficients, all of which are below 0.01.
6 Discussion and Conclusion
In this study, based on the remote sensing image data from 1978, 1988,
1998, 2008, and 2018, the land use changes in the Yarkant River basin have been
analyzed. The land use changes objectively reflect the relationship between
human activities and the ecological environment.
In recent decades,
the exploitation and utilization of water and soil resources in oasis areas
have been rapidly increasing. Therefore, the fragile ecological environment has
been placed under unprecedented pressure from human disturbances.
In terms of the
interaction between land use changes and ecological services, the Yarkant River
basin has experienced a large-scale expansion in cultivated land and a
large-scale reduction in grassland and water bodies. At the same time, the
structure of natural ecosystems has shifted from non-agricultural land to
agricultural land, which is a significant characteristic of reduced ecosystem
function. This situation indicates that there is a simultaneous development of
oasis areas and enhanced desertification[17]. The ecological
service's value of cultivated land gradually increased during these 41 years,
but it failed to prevent the trend of the total ecosystem services value of the
Yarkant River basin from decreasing. Cultivated land is converted from
grassland, and the expansion of cultivated land does not contribute
significantly to the ecosystem services value of Yarkant River Basin, which
caused the value of natural capital in the area to continue decreasing[18].
The main findings
of this study can be summarized as follows:
(1)
From 1978 to 2018, the overall rate of LUCC in the Yarkant River basin was
7.26%. The change in land use over the 41-year period can be ordered as
follows: wetland (249.13%) > cultivated land
(63.51%) > water body (20.35%) > forest land (7.02%) > unused land
(6.82%) > grassland (2.01%). Over the whole study period, the area of
cultivated land increased rapidly, whereas water bodies, grassland, and unused
land exhibited a continued decrease in area. This indicates ecological problems
such as vegetation degradation and water area reduction in the Yarkant River
basin.
(2) The estimated
ecological service value of the Yarkant River basin in 1978, 1988, 1998, 2008,
and 2018 was 425.86??108, 424.43??108, 440.67??108,
425.72??108, and 417.00??108 Yuan, respectively. From the
relationship between changes in land use structure and ecological service
value, the decreases in water bodies and grassland are the main reason for the
decrease in ecological service value in the study area.
(3) The structure
of ecosystem function services shows that the reduction in regulation services
outweighs the changes in the value of other functions, and the change in
regulation services is synchronized with the change in total ecological
services. This shows that the ecosystem service function of the Yarkant River
basin is dominated by the regulatory functions.
(4) A sensitivity
analysis showed that the sensitivity coefficients for all land use types were
less than 1 and often close to 0, indicating that the estimated ESV of the
study area is considerably inelastic concerning the value coefficients. This
result is helpful in quantitatively analyzing the ecological effects of land
use structure changes in the Yarkant River basin.
References
[1] Wei, G. H. Analysis on land
use and cover change based on remote sensing in Kai-Kong River basin [J]. University of Water Research & Electric Power, 2016, 28(4): 48–58.
[2]
Chen, L. D., Zhang, S. R., Fu, B. J. Correlation analysis on spatial
pattern of land use and soil at catchment scale [J]. Acta Ecologica Sinica, 2003, 23(12): 2497–2508.
[3]
Yai, Y., Xu, H. L., Ling, H. B., et al. Analysis on land use changes and ecosystem services value in
the area along the Tarim River [J]. Journal
of Desert Research, 2013, 33(6): 1912–1921.
[4]
Liu, G. L., Ghang, L. C., Ghang, Q. Spatial and temporal dynamics
of land use and its influence on Sinica [J]. Acta Ecologica Sinica, 2014, 34(12): 3311–3319.
[5]
Zhang, G. P., Xu, H. L., Du, Q. Response of ecosystem service value
basin to land use/cover change in the Yarkant River in recent 20 years [J]. Arid Zone Research, 2016, 33(6):
1303–1310.
[6]
Xie, G. D., Lu, C. X., Leng, Y. F. Ecological assets valuation of
the Tibetan Plateau [J]. Journal of Natural
Resources,
2003,
18(2): 189–197.
[7]
Hamid, Y., Mamattursun, E., Zhan, G. F. Study on the characteristics
of landscape pattern changes in middle stream of Tarim river [J]. Journal of Xinjiang University (Natural Science Edition), 2007, 24(2):
127–134.
[8]
Chen, Z. S., Chen, Y. N., Li, W. H. Changes of runoff consumption
and its human influence intensity in the mainstream of Tarim River [J]. Acta Geographica Sinica, 2011, 66(1):
89–98.
[11]
Li, H. L., Bai, L. Y., Feng, J. Z. Analysis of spatio-temporal characteristics
of Populus euphratica forests in the
Yarkant River basin, Xinjiang [J]. Acta
Ecologica Sinica, 2019, 39(14): 5080–5094.
[12]
He, B., Gao, F., Yan, Z. L. Evolution and variation of runoff in
Yarkant River [J]. Journal of Water Resources
& Water Engineering, 2018, 29(1):
38–45.
[13]
Li, Z., An, F. Z., Zhang, Y. F. Prediction of ecosystem services value
and its response to land use change in Kashi city [J]. Bulletin of Soil and Water Conservation, 2015, 35(5): 274–279.
[14]
Costanza, R., D??Arge, R., Groot, R. D., et al. The value of the world??s ecosystem services and natural capital
[J]. Nature, 1997, 387(1): 253–260.
[15]
Zhao, J., Wei, L., Chen, S. Dynamics of ecosystem service values
along the upper reaches of Shiyanghe River basin [J]. Journal of Arid Land Resource and Environment, 2010, 24(1): 36–40.
[16]
Cheng, L., Li, F., Deng, H. F. Dynamics of land use and its ecosystem
services in China??s megacities [J]. Acta
Ecologica Sinica, 2010, 24(1): 36–40.
[17]
Hao, X. M., Li, W. H., Chen, Y. N. Analysis of socio-economic driving
forces on land use and land cover change in Tarim River basin [J]. Journal of Desert Research, 2007, 27(3):
405–412.
[18]
Huang, X., Chen, Y. N., Ma, J. X. Analysis of the ecosystem services
value of the typical river basin in desert areas of northwest China [J]. Journal of Natural Resources, 2011, 26(8): 1364–1376.