A Multi-scale Land Use Dataset of China in Provincial Level by Super-resolution Mapping Methodology
Ge, Y.1,2* Jia, Y. X.1,2 Chen, Y. H.3 Xu, X. L.1 Jiang, D.1 Zhang, D.1,2
1. State Key Laboratory of Resources and Environmental Information Systems, Institute of Geographic Sciences and Natural Resources Research, Chinese Academy of Sciences, Beijing 100101, China;
2. University of Chinese Academy of Sciences, Beijing 100049, China;
3. School of Earth Sciences and Engineering, Hohai University, Nanjing 210098, China
Abstract: Mixed pixels are generally observed in remote sensing imagery because of the natural constraints required by spatial, temporal and spectral resolutions. This deficiency results in poor performance for obtaining land use maps from remote sensing data. To identify a solution for this problem, super-resolution mapping (SRM) was proposed to be used. Based on the class fraction image and geospatial structure of the coarse image, SRM distributes the spatial location of different classes within mixed pixels, which can provide a finer resolution land use map. Multi-scale (spatial resolution) land use maps with resolutions of 500 m, 330 m, 250 m, 200 m, 167 m, 143 m, 125 m, 111 m, and 100 m were acquired separately by adopting fraction information (1000 m) from the 2005 land use map for China and using the vectorial boundary-based subpixel mapping (VBSPM) method. The best overall accuracy was obtained for Xijiang and Xizang provinces, at 90%. The poorest accuracies were obtained for Shanxi, Shaanxi, Chongqing, and Guizhou provinces/cities, at about 70%. In terms of class accuracies, the best performance was obtained for farmland, woodland, and grassland, while low accuracy was obtained for built-up land, and variable accuracies were obtained for water and unused-land between different provinces.
Keywords: multi-scale land use dataset; mainland of China; super-resolution mapping; provincial level; 2005
1 Introduction
Land cover/land use is one of the most direct mechanisms for describing the earth surface features. Rapid acquisition of land cover/land use maps is the basis for recognizing the regional and global scale earth surface changes. Remote sensing, as a means to instantaneously acquire a wide range of surface images and provide processing technology, is a perfect fit for the rapid acquisition of land cover/land use needs.
The conventional method for obtaining land cover/land use map is based on a “hard” classification rule, where each pixel in satellite image is assigned to only one class. However, due to sensor limitations and the complexity of surface, both pure pixels and mixed pixels inevitably occur in remote sensing image. Because mixed pixels contain more than one type of land cover, the traditional classification method can reduce the accuracy of land cover/land use. To address this problem, the spectral unmixing method (or soft classification method) was proposed to obtain the area ratio of each category in the mixed pixel. While this spectral unmixing method solves the limitation imposed by the uncertainty of class fractions in a mixed pixel, the location uncertainty for each subpixel remains. Therefore, the concept of super-resolution mapping (SRM) has been proposed, which uses categorical fraction data and spatial structure characteristics to determine subpixel locations in mixed pixels.
As a method for obtaining finer land cover/land use data, SRM applies the advantages of both soft and hard classification and is also an upscaling method, which can acquire land use products with higher spatial resolution than input remote sensing images. For areas where high-resolution images are missing, it can be used to obtain high spatial resolution land cover/land use data from coarse remote sensing images[1]. In this study, a multi-scale land use dataset was produced using the SRM method and coarser resolution land cover fractional data for the Chinese mainland, which can provide for relevant researchers with an alternative land use data product.
2 Metadata of Dataset
Metadata, including the dataset names, authors, geographic regions, year, spatial resolution, data format, dataset files, foundation(s), data publisher, and data sharing policies, for the super-resolution mapping dataset on investigating land use pixels into subpixel maps in provincial level of China (2005)[2], are shown in Table 1.
3 Method for Producing the Dataset
The 2005 China land use fractional data with spatial resolution of 1,000 m, generated by grid overlay and regional statistical acquisition from a 30 m land use map, were used as the input data. To verify the accuracy of this multi-scale land use dataset, 30 m land use data downscaled using the area-optimized method were used as a reference. The 30 m land use data were provided by the Resource and Environmental Science Data Center of the Chinese Academy of Sciences (http://www.resdc.cn).
The vectorial boundary-based super-resolution mapping method (VBSRM) was used in this study, which was proposed by Ge et al.[4]. In this method, the boundary of the inner category in a mixed pixel is first drawn using the categorical fraction information from the pixel and its neighboring pixels, and then the location of different classes of sub-pixels in
Table 1 Metadata summary of super-resolution mapping dataset on investigating land use pixels into subpixel maps in provincial level of China (2005)
|
Items
|
Description
|
|
Dataset full name
|
Super-resolution mapping dataset on investigating land use pixels into subpixel maps in provincial level of China (2005)
|
|
Dataset short name
|
MLUD_China_Prov(2005)
|
|
Authors
|
Ge, Y. L-4781-2016, State Key Laboratory of Resources and Environmental Information Systems, Institute of Geographic Sciences and Natural Resources Research, Chinese Academy of Sciences; College of Resources and Environment, University of Chinese Academy of Sciences, gey@lreis.ac.cn
Jia, Y. X. L-4527-2016, State Key Laboratory of Resources and Environmental Information Systems, Institute of Geographic Sciences and Natural Resources Research, Chinese Academy of Sciences; University of Chinese Academy of Sciences, jiayx@lreis.ac.cn
Chen, Y. H., School of Earth Sciences and Engineering, Hohai University, chenyh@lreis.ac.cn
Xu, X. L. L-5222-2016, State Key Laboratory of Resources and Environmental Information Systems, Institute of Geographic Sciences and Natural Resources Research, Chinese Academy of Sciences, xuxl@lreis.ac.cn
Jiang, D., State Key Laboratory of Resources and Environmental Information Systems, Institute of Geographic Sciences and Natural Resources Research, Chinese Academy of Sciences, jiangd@igsnrr.ac.cn
Zhang, D., State Key Laboratory of Resources and Environmental Information Systems, Institute of Geographic Sciences and Natural Resources Research, Chinese Academy of Sciences; University of Chinese Academy of Sciences, zhangd@lreis.ac.cn
|
|
Geographic region
|
31 provinces/cities of Mainland of China Year 2005
|
|
Spatial resolution
|
500 m, 333 m, 250 m, 200 m, 167 m, 143 m, 125 m, 111 m, 100 m
|
|
Data format
|
.tif, .xlsx Data size 335 MB
|
|
Data files
|
310 data files in 31 folders are contained in this dataset, and each folder has the naming rule, MLUD_China(2005)_ProvinceName. For example, “MLUD_China(2005)_Anhui,” which contains multi-resolution land use data for Anhui province. The land use data are provided with nine spatial resolutions for each province, which has naming rule, Province_Spatial Resolution_Year.tif; for example, “anhui_100m_2005.tif”. Volume of dataset is related to area of provinces. Volume of Shanghai is the smallest, which is 0.4 MB. Volume of Inner Mongolia autonomous region is the largest, which is 61.4 MB
The accuracy assessment results for this dataset are located in the “Accuracy Assessment” folder; there are 31 excel files (.xlsx) for each province and the overall and class-specific accuracies are indices in the accuracy assessment files
The first-level classification system proposed by China’s Land Resources Classification System[3] was adopted to set categories for this dataset, which includes farmland, woodland, grassland, water, built-up, and unused-land
|
|
Foundation(s)
|
National Natural Science Foundation of China (41471296); Ministry of Science and Technology of P. R. China (2012BAH33B01)
|
|
Data publisher
|
Global Change Research Data Publishing & Repository, http://www. geodoi.ac.cn
|
|
Address
|
No. 11A, Datun Road, Chaoyang District, Beijing 100101, China
|
|
Data sharing policy
|
Data from the Global Change Research Data Publishing & Repository includes metadata, datasets (data products), and publications (in this case, in the Journal of Global Change Data & Discovery). The Data sharing policy includes: (1) Data, which are openly available and can be free downloaded via the Internet; (2) end users are encouraged to use Data subject to citation; (3) users, who are by definition also value-added service providers, are welcome to redistribute Data subject to written permission from the GCdataPR Editorial Office and the issuance of a Data redistribution license, and; (4) if Data are used to compile new datasets, the ‘ten percent principal’ should be followed such that Data records utilized should not surpass 10% of the new dataset contents, while sources should be clearly noted in suitable places in the new dataset[4]
|
the pixel are determined. For the first step, according to Equation (1) and the categorical fraction data, the length and position of the vector boundary segmented line are determined. Then, the initial polygon is formed by connecting the segmented line and adjusted by checking the polygon topology. For the second step, according to scale factor, a ray method is used to determine the positional relationship between subpixels and the vector polygon, and the category attribute of each sub-pixel is obtained.
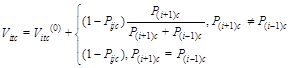 (1)
(1)
Where  and
and  are the starting and ending positions of the segmented line t (t=1, 2, …, 10) for class c in the neighbor pixel of i (i=1, 2, …, N´M).
  ,
, , and
, and  are the fraction information for pixel i and its right and left pixel. Nine downscaling factors, 2, 3, 4, …, 10, were adopted to generate the multi spatial resolution land use data for the Chinese mainland.
4 Results and Assessment
4.1 Dataset
The super-resolution mapping dataset on investigating land use pixels into subpixel maps in provincial level of China (2005) is composed of 31 parts, which are the 31 provincial administrative areas in the Chinese mainland. Nine spatial resolutions were obtained for each part, resulting in nine corresponding land use maps at spatial resolutions of 500 m, 333 m, 250 m, 200 m, 167 m, 143 m, 125 m, 111 m, and 100 m. Files were archived in .tif format, and pixel values were set based on land cover type: 1 for farmland, 2 for woodland, 3 for grassland, 4 for water, 5 for built-up, and 6 for unused-land. Due to the large number of documents in this dataset, only the 250 m results for each provincial administrative region are provided for illustration here (Figure 1, Figure 2).
4.2 Statistical Results
Using the nine spatial resolutions of land use data for each province/city, the average areas of each land use type in the 31 provinces were obtained (Table 2). Heilongjiang province had the largest farmland area, 167,402.2 km2, while farmland areas in Sichuan, Shandong, Henan, and Hebei provinces and the Inner Mongolia autonomous region exceeded 100,000 km2. The woodland areas of Yunnan and Heilongjiang provinces are 226,098 km2 and 200,211 km2, respectively, and had the largest areas of forest compared to other provinces. The grassland area of the Tibet autonomous region (Xizang) was 844,232 km2, ranking first of all provinces/cities; grasslands of the Xinjiang Uygur autonomous region (Xinjiang), Inner Mongolia autonomous region, and Qinghai province exceeded 350,000 km2. The Tibet autonomous region (Xizang) had the largest water area, 52,738 km2. The Xinjiang Uygur autonomous region (Xinjiang) had the largest unused-land area, 997,680 km2, although the unused-land areas of the Inner Mongolia autonomous region, Qinghai province, Tibet autonomous region (Xizang), and Gansu province also exceeded 170,000 km2. The built-up areas of Shandong, Jiangsu, Henan, and Hebei provinces exceeded 100,000 km2; proportionally, Shanghai, Tianjin, Beijing, Jiangsu, and Shandong provinces/cities had higher fractions of built-up areas.
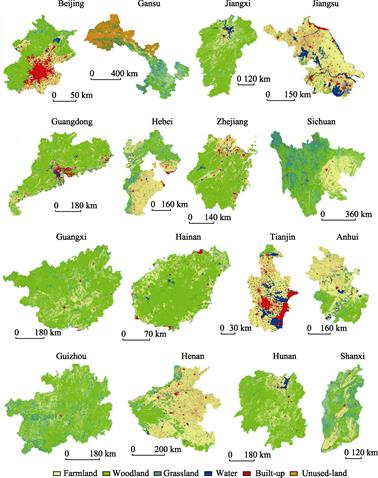
Figure 1 Land use map of provincial administrative areas in the Chinese mainland (A)
4.3 Accuracy Assessment
The average overall accuracy and class-specific accuracy, including producer and user, for each province were obtained by adopting 30-m national land use data for reference (Table 3). As shown in Table 3, the overall accuracies obtained for Xinjiang and Xizang provinces were significantly better than for other provinces, with the highest precision reaching 90%. The overall accuracies for Shanxi, Shaanxi, Chongqing, and Guizhou provinces/cities were poor, at approximately 70%. In terms of class-specific accuracy, farmland, woodland, and grassland were relative high, while accuracy for the built-up class was low. Accuracies for unused-land and water showed clear inter-provincial differences. The accuracies for Xizang and Xinjiang provinces were high because of the large number of homogeneous land types. In comparison, Shanxi, Shaanxi, Guizhou, Chongqing, and Fujian provinces/cities had a high degree of heterogeneity and fragile surface areas, which resulted in poorer overall accuracy. Farmland, woodland and grassland mostly appearing as large plaques and the surface types were relatively uniform; therefore, the class-specific accuracy was relatively high. Built-up areas, especially in rural regions, were mostly distributed as scattered points, and were mixed with other features; therefore, the surface heterogeneity was higher, which resulted in lower accuracy. Our results are in agreement with Ge et al.[6] and other studies, who have found that increasing surface heterogeneity and spatial resolution results in a decrease in the accuracy of land use products. There were significant variations in the distribution patterns of different types of water and unused-land across the provinces, therefore the accuracy between the two types in different provinces varied significantly. For example, because unused-land in Xinjiang province had low heterogeneity, the accuracy reached as high as 96%. In contrast, in Zhejiang province, the distribution of unused-land was linear or pointed and the degree of fragmentation was high, therefore, the classification accuracy was low, only about 20%.
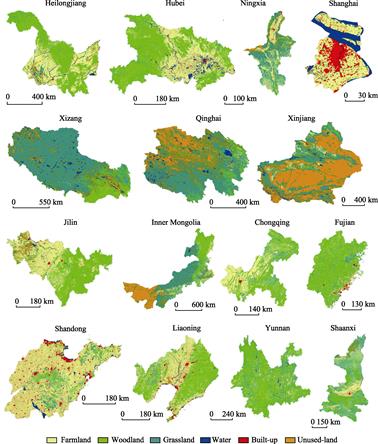
Figure 2 Land use map of provincial administrative areas in the Chinese mainland (B)
5 Discussion and Conclusion
This dataset used the super-resolution mapping method to downscale the national land use categorical fraction data with 1,000 m spatial resolution, and obtain multi-spatial resolution land use maps, at 500 m, 333 m, 250 m, 200 m, 167 m, 143 m, 125 m, 111 m, and 100 m resolutions. Based on the land use products with spatial resolution of 30 m, the accuracy of each sub-dataset was assessed for each provincial administrative area in the Chinese mainland. According to the accuracy assessment, the multi spatial resolution land use dataset achieved good consistency with the reference. This dataset contains the results of the accuracy evaluation, which is convenient for users to query by accuracy and region to meet their specific needs.
Table 2 Area of each land use type in 31 provincial administrative regions of Chinese mainland (km2)
|
Province
|
Farmland
|
Woodland
|
Grassland
|
Water
|
Built-up
|
Unused-land
|
|
Anhui
|
86,279.1
|
33,194.8
|
7,504.0
|
7,006.2
|
6,308.4
|
3.7
|
|
Beijing
|
4,502.2
|
7,651.8
|
1,114.9
|
390.5
|
2,741.3
|
0.3
|
|
Chongqing
|
39,111.8
|
33,165.7
|
8,770.3
|
808.3
|
573.8
|
8.1
|
|
Fujian
|
20,291.3
|
80,659.5
|
16,158.6
|
1,434.1
|
3,032.6
|
65.9
|
|
Gansu
|
68,978.5
|
37,995.8
|
141,165.0
|
3,172.2
|
2,156.7
|
172,371.8
|
|
Guangdong
|
40,795.4
|
115,026.5
|
3,538.2
|
7,307.1
|
9,328.8
|
84.5
|
|
Guangxi
|
52,858.8
|
161,677.3
|
15,802.8
|
3,013.3
|
3,060.1
|
18.3
|
|
Guizhou
|
47,320.9
|
98,171.7
|
29,664.4
|
340.3
|
479.9
|
24.8
|
|
Hainan
|
6,851.9
|
24,993.1
|
507.1
|
815.3
|
696.1
|
62.5
|
|
Hebei
|
102,157.4
|
40,630.1
|
28,768.2
|
3,371.6
|
11,296.5
|
1,400.5
|
|
Heilongjiang
|
167,402.2
|
200,211.0
|
33,258.5
|
11,471.6
|
6,538.2
|
34,083.6
|
|
Henan
|
113,384.0
|
29,424.2
|
7,905.4
|
3,446.8
|
11,446.6
|
12.6
|
|
Hubei
|
70,072.0
|
95,792.8
|
6,263.3
|
9,868.7
|
3,646.8
|
387.9
|
|
Hunan
|
59,652.2
|
136,964.1
|
6,322.5
|
6,283.1
|
2,131.7
|
663.0
|
|
Jiangsu
|
73,495.8
|
3,093.3
|
788.0
|
12,791.8
|
11,795.8
|
13.7
|
|
Jiangxi
|
44,832.6
|
107,508.1
|
6,063.5
|
6,298.6
|
1,791.9
|
595.1
|
|
Jilin
|
79,142.0
|
84,946.8
|
6,771.4
|
3,809.4
|
4,456.0
|
11,887.9
|
|
Liaoning
|
65,086.0
|
62,561.0
|
4,378.9
|
4,463.3
|
8,122.7
|
1,450.5
|
|
Inner Mongolia
|
118,514.0
|
182,216.0
|
475,450.1
|
12,613.5
|
8,981.2
|
348,019.8
|
|
Ningxia
|
18,432.0
|
2,561.0
|
24,081.1
|
789.9
|
793.5
|
5,111.7
|
|
Qinghai
|
8,651.0
|
27,520.3
|
379,391.6
|
26,897.3
|
915.1
|
253,515.8
|
|
Shandong
|
113,647.0
|
9,730.2
|
8,639.7
|
6,037.4
|
16,214.5
|
1,958.4
|
|
Shanghai
|
4,385.8
|
89.5
|
14.5
|
1,632.1
|
1,798.7
|
0.0
|
|
Shanxi
|
62,163.0
|
44,412.0
|
44,892.4
|
1,419.4
|
3,696.1
|
84.0
|
|
Shaanxi
|
73,578.2
|
47,711.4
|
76,190.1
|
1,557.9
|
2,153.0
|
4,695.4
|
|
Sichuan
|
123,857.1
|
169,004.6
|
170,945.7
|
3,212.5
|
2,550.3
|
16,446.8
|
|
Tianjin
|
7,108.9
|
378.5
|
98.1
|
1,712.0
|
2,277.4
|
36.0
|
|
Xinjiang
|
68,886.6
|
35,283.9
|
480,205.4
|
45,596.3
|
4,005.0
|
997,680.9
|
|
Xizang
|
5,464.6
|
125,230.1
|
844,232.1
|
52,738.9
|
153.8
|
174,684.3
|
|
Yunan
|
66,457.6
|
226,098.1
|
84,287.2
|
3,001.8
|
1,404.6
|
2,034.7
|
|
Zhejiang
|
27,198.6
|
67,073.9
|
1,560.3
|
2,811.3
|
4,815.7
|
47.4
|
Acknowledgements
The input and reference data were provided by the Resource and Environmental Science Data Center of the Chinese Academy of Sciences.
Table 3 Average land use accuracy for each province/city (%)
|
|
|
Xizang
|
Xinjiang
|
Inner Mongolia
|
Zhejiang
|
Jiangsu
|
Jilin
|
Sichuan
|
Qinghai
|
|
|
Overall accuracy
|
92.0
|
90.0
|
76.4
|
79.7
|
80.7
|
79.5
|
75.8
|
82.1
|
|
|
Farmland
|
47.0
|
81.2
|
64.8
|
68.3
|
87.6
|
80.7
|
79.4
|
67.1
|
|
|
Woodland
|
79.1
|
60.0
|
78.1
|
89.1
|
68.3
|
87.7
|
74.0
|
59.7
|
|
|
Grassland
|
95.2
|
88.1
|
78.6
|
38.0
|
58.8
|
42.3
|
77.3
|
84.8
|
|
|
Water
|
84.1
|
73.7
|
59.8
|
50.5
|
82.7
|
55.2
|
47.0
|
73.3
|
|
|
Built-up
|
46.1
|
52.1
|
33.0
|
50.9
|
48.6
|
33.0
|
49.2
|
56.1
|
|
|
Unused-land
|
80.2
|
94.9
|
71.9
|
22.4
|
29.3
|
67.9
|
61.5
|
82.3
|
|
|
|
Shanghai
|
Hubei
|
Guangxi
|
Guangdong
|
Gansu
|
Henan
|
Anhui
|
Jiangxi
|
|
|
Overall accuracy
|
83.6
|
78.3
|
77.8
|
76.2
|
77.8
|
79.6
|
79.3
|
77.1
|
|
|
Farmland
|
86.3
|
76.7
|
65.0
|
63.1
|
65.4
|
86.7
|
85.6
|
65.4
|
|
|
Woodland
|
49.9
|
85.1
|
86.8
|
86.5
|
68.9
|
84.6
|
82.0
|
85.6
|
|
|
Grassland
|
59.9
|
52.7
|
52.7
|
37.6
|
72.1
|
59.0
|
63.9
|
47.7
|
|
|
Water
|
90.8
|
65.0
|
40.5
|
56.5
|
46.5
|
52.8
|
73.9
|
67.9
|
|
|
Built-up
|
73.3
|
33.6
|
37.5
|
57.4
|
33.6
|
38.8
|
31.0
|
36.3
|
|
|
Unused-land
|
|
53.9
|
31.7
|
30.9
|
92.3
|
29.8
|
15.6
|
70.9
|
|
|
|
Tianjin
|
Heilongjiang
|
Hunan
|
Hebei
|
Yunnan
|
Shandong
|
Ningxia
|
Liaoning
|
|
|
Overall accuracy
|
75.7
|
76.5
|
75.1
|
74.1
|
74.8
|
72.9
|
73.0
|
71.1
|
|
|
Farmland
|
84.4
|
83.1
|
64.0
|
83.0
|
61.5
|
84.2
|
73.1
|
75.1
|
|
|
Woodland
|
73.7
|
86.4
|
83.2
|
76.4
|
83.5
|
59.5
|
57.0
|
78.1
|
|
|
Grassland
|
44.7
|
31.9
|
47.6
|
60.4
|
64.1
|
45.1
|
76.8
|
31.9
|
|
|
Water
|
66.2
|
54.0
|
60.5
|
44.3
|
58.1
|
52.5
|
49.4
|
48.1
|
|
|
Built-up
|
60.3
|
35.7
|
38.9
|
45.6
|
36.7
|
45.0
|
39.9
|
41.3
|
|
|
Unused-land
|
36.4
|
43.9
|
68.9
|
49.0
|
72.4
|
25.5
|
73.5
|
67.1
|
|
|
Hainan
|
Guizhou
|
Fujian
|
Chongqing
|
Beijing
|
Shanxi
|
Shaanxi
|
|
Overall accuracy
|
71.6
|
68.4
|
69.6
|
69.6
|
76.8
|
67.7
|
63.3
|
|
Farmland
|
52.9
|
54.5
|
53.1
|
74.1
|
71.5
|
70.3
|
63.8
|
|
Woodland
|
82.4
|
77.5
|
81.0
|
71.3
|
88.1
|
75.3
|
69.2
|
|
Grassland
|
33.1
|
63.5
|
44.5
|
50.5
|
53.7
|
60.0
|
60.2
|
|
Water
|
46.8
|
38.1
|
45.4
|
53.6
|
51.4
|
36.7
|
47.8
|
|
Built-up
|
46.6
|
47.2
|
49.7
|
54.6
|
68.8
|
43.8
|
36.8
|
|
Unused-land
|
33.9
|
41.3
|
33.5
|
24.1
|
3.2
|
33.3
|
67.0
|
References
[1] Jiang, Y., Ge, Y., Chen, Y. H., et al. Reliability analysis and assessment of sub-pixel mapping: a case study with Landsat-5 image and HJ-1A image based on VBSPM [J]. Journal of Geo-information Science, 2015, 10: 1215-1223.
[2] Ge, Y., Jia, Y. X., Chen, Y. H., et al. Super-resolution mapping dataset on investigating land use pixels into subpixel maps in provincial level of China (2005) [DB/OL]. Global Change Research Data Publishing & Repository, 2018. DOI: 10.3974/geodb.2018.05.17.V1.
[3] Jiang, Y. Adaptability analysis and assessment of zoom factor in sub-pixel mapping [D]. Beijing: University of Chinese Academy of Sciences, 2015.
[4] GCdataPR Editorial Office. GCdataPR data sharing policy [OL]. DOI: 10.3974/dp.policy.2014.05 (Updated 2017).
[5] Ge, Y., Chen, Y., Li, S., et al. Vectorial boundary-based sub-pixel mapping method for remote-sensing imagery [J]. International Journal of Remote Sensing, 2014, 35(5): 1756-1768.
[6] Ge, Y., Jiang, Y., Chen, Y. H., et al. Designing an experiment to investigate subpixel mapping as an alternative method to obtain land use/land cover maps [J]. Remote Sensing, 2016, 8: 360. DOI: 10.3390/rs8050360.