Spatial-Temporal
Population Dataset of Hainan Island (2013-2018)
Lai, X. L. Han, N. L.*
Huang, P. J.
Department
of Land Resources Management, School of Public Administration, Hainan
University, Haikou 570228, China
Abstract:
The spatial-temporal population dataset of Hainan Island (2013-2018)
is based on the 2013-2018
NPP/VIIRS night light data, and performs Image synthesis, unstable light
sources removal, and year-by-year corrections to eliminate the effects of
transient light sources and background noise. Based on the correlation analysis
between the processed night lighting data and population statistics data, a
regression model is established, and the population spatial modeling is carried
out according to the error classification, so as to eliminate the influence of
mountain topography, small population and other factors on the simulation
accuracy. Finally, the spatial distribution dataset of population in Hainan
Island is generated. The dataset is archived in .tif format with a spatial
resolution of 500 m and consists of 26 data files, 11.0 MB (compressed into one
file, 168 KB), reflecting the characteristics of temporal and spatial
distribution of population in Hainan Island from 2013 to 2018.
Keywords: Hainan Island; population; NPP/VIIRS night
light data; regression model; population spatialization
DOI: https://doi.org/10.3974/geodp.2022.01.08
CSTR: https://cstr.escience.org.cn/CSTR:20146.14.2022.01.08
Dataset Availability Statement:
The dataset
supporting this paper was published and is accessible through the Digital Journal of
Global Change Data Repository at: https://doi.org/10.3974/geodb.2021.08.02.V1 or
https://cstr.escience.org.cn/CSTR:20146.11.2021.08.02.V1.
1 Introduction
Nightlight
remote sensing images can provide important basis for the estimation of
socio-economic parameters such as GDP, population, electricity consumption,
greenhouse gas emissions, poverty index and Gini coefficient and so on[1].
At present, the commonly used night light data are DMSP/OLS night light data
and NPP/VIIRS night light data, both of which come from the National Oceanic
and Atmospheric Administration (NOAA). The difference between them is that the
time series of DMSP/OLS night light remote sensing image is from 1992 to 2013,
and the spatial resolution is 1 km, while the time series of NPP/VIIRS night
light remote sensing image is from 2012 to now, and the spatial resolution is
500 m. At the same time, NPP/VIIRS night light data were captured by Suomi-NPP
satellite using VIIRS, using polar orbit, and obtained by stitching together
multiple cloud-free images[2]. The NPP/VIIRS sensor has 22 bands,
with a wavelength range of 0.4-12??m,
covering the visible and infrared spectrum. Spectral resolution is 16 bit, and
radiation detector with wider band and on-orbit radiometric correction
technology effectively improve the quality of light image[3]. Thanks
to its stronger light capture sensitivity, higher spatial and temporal
resolution, NPP/VIIRS data is more suitable for small and medium-scale human
activities research[4], and the spatial distribution of population
information extracted from this can be intuitive reflects the characteristics
of the temporal and spatial evolution of the population. Therefore, this
dataset is processed based on NPP/VIIRS night lighting data, and the spatial
distribution information of population in Hainan Island is obtained by
correlation analysis and regression modeling with the demographic data of 18
cities and counties of Hainan Island, in order to provide data basis and
decision-making basis for Hainan??s territorial spatial planning or scientific
research.
2 Metadata of the Dataset
The
metadata of Night lights and statistical data fusion of Hainan Island
population 500-m grid dataset (2013-2018)[5]dataset
is showed in Table 1.
Table 1 Metadata summary of the Night lighting and census integrated 500 m
raster population dataset of Hainan Island (2013-2018)
|
Items
|
Description
|
|
Dataset full name
|
Night
lighting and census integrated 500 m raster population dataset of Hainan
Island (2013-2018)
|
|
Dataset short name
|
PopulationHaiNan_2013-2018
|
|
Authors
|
Lai, X. L.,
Hainan University, 1309842628@qq.com
Han, N.L.,
Hainan University, nlhan@hainu.edu.cn
Huang, P. J.,
Hainan University, 1538541468@qq.com
|
|
Geographical region
|
Hainan island Year 2013-2018
|
|
Temporal resolution
|
Year
Spatial resolution 500 m
|
|
Data format
|
.tif
|
|
|
|
Data size
|
168 KB (After
compression)
|
|
|
|
Data files
|
Regional stable
NPP/VIIRS nighttime light dataset of Hainan island, 2013-2018
Hainan island population spatial dataset based on NPP/VIIRS night light data
from 2013 to 2018
|
|
Foundations
|
Hainan Province
(HNSK(ZD)19-119); Natural Science Foundation of Hainan Province (2019RCO16); Hainan
University (kyqdsx1962)
|
|
Data
publisher
|
Global Change Research Data Publishing & Repository,
http://www.geodoi.ac.cn
|
|
Address
|
No. 11A, Datun
Road, Chaoyang District, Beijing 100101, China
|
|
Data sharing policy
|
Data from the Global
Change Research Data Publishing & Repository includes metadata, datasets (in the Digital Journal of Global Change Data Repository), and
publications (in the Journal of Global Change Data & Discovery). Data sharing policy includes: (1) Data
are openly available and can be free downloaded via the Internet; (2) End
users are encouraged to use Data subject to citation; (3)
Users, who are by definition also value-added service providers, are welcome
to redistribute Data subject to written permission from the GCdataPR
Editorial Office and the issuance of a Data redistribution license; and
(4) If Data are used to compile new datasets, the ??ten per cent
principal?? should be followed such that Data records utilized should not
surpass 10% of the new dataset contents, while sources should be clearly
noted in suitable places in the new dataset[6]
|
|
Communication and searchable system
|
DOI, CSTR, Crossref, DCI, CSCD,
CNKI, SciEngine, WDS/ISC, GEOSS
|
3 Methodology
3.1 Study Area and Data Sources
The
study area of this paper is the 18 cities and counties in the land area of
Hainan Island (excluding Sansha city), which are Haikou city, Sanya city and
Danzhou city, and 15 province-level counties. Hainan Island is located between
108??37¢E-111??03¢E and 18??10¢N-20??10¢N. The terrain of the whole island is low and flat all around, with
a high tower in the middle, presenting a dome-long mountain topography. The
original night light data of this dataset are mainly the NPP/VIIRS night light
remote sensing monthly composite mean image during 2013-2018, which comes from the NPP/VIIRS sensor dataset in the National
Oceanic and Atmospheric Administration (NOAA)[1],
with a resolution of 500 m. Hainan Island??s administrative division data comes
from the China Natural Resources Database[2];
Hainan Island??s demographic data comes from the Hainan Provincial Statistical
Yearbook[7].
3.2 Technical Route
The
technical route of this study includes three parts: NPP/VIIRS night light data
acquisition, data processing and population spatialization modeling (Figure 1).
Although the
monthly data of NPP/VIIRS night light data have eliminated the effects of
lightning, moonlight irradiation and cloud coverage, there are still transient
light sources such as aurora, fire, and ship lights and background noise.
Therefore, it is necessary to process the original data to obtain stable annual
average data. Therefore, NPP/VIIRS night light data processing includes the
process of annual mean image synthesis, elimination of negative and extremely
high values, removal of unstable light sources, and continuous correction[8,9].
Population spatialization modeling includes
correlation analysis, regression modeling and correction. We toke the city and
county to analyze the correlation between the night light brightness from 2013
to 2017 and the corresponding demographic data. The regression modeling analysis
of demographic data and night light brightness values shows that the R2 of the cubic linear
function model is the highest, so the population spatialization model uses a
cubic linear function. The 2018 demographic data was used to verify the 2018
population simulation results of the model. The results show that the average
error of the overall simulated population of Hainan Island is 36.55%, and the
error of individual cities and counties is much larger than the average error.
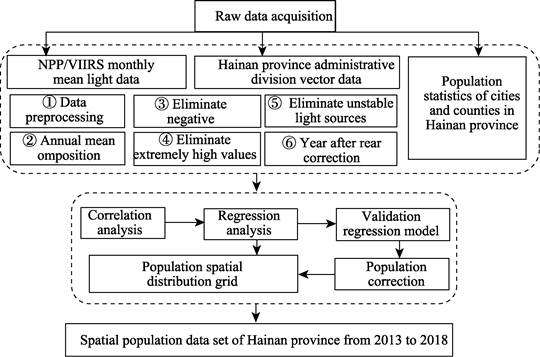
Figure
1 Data development
technology roadmap
4 Data Results and Validation
4.1 Data Composition
The population
spatial dataset of Hainan Island from 2013 to 2018 is composed of 26 data
files, and the data is named in the form of ??subject + time??.
4.2 Data Products
After processing
the original data through the above technical route, the Night lighting and
census integrated 500 m raster population dataset of Hainan Island (2013-2018) with a resolution of 500 m´500 m is obtained, in which the data unit is the total population on
the 500m grid. The characteristics of the spatial and temporal distribution of
Hainan Island??s population from 2013 to 2018 from the dataset show that the
population distribution of Hainan Island is scattered on the whole. The
population is mainly distributed in coastal cities and counties, and mainly
concentrated in the two cities of Haikou and Sanya. The population of central
cities and counties is relatively sparse, and formed the spatial polar
distribution pattern of north Haikou and south Sanya (Figure 2, 3). From 2013
to 2018, the population of Hainan Island has a relatively obvious growthtrend.
The population increment is mainly distributed in the suburbs of cities and
counties, and spreads from the urban center to the periphery, such as Haikou
and Sanya are particularly obvious. On the whole, the growth population is
mainly distributed in the urban areas of coastal cities and counties, the areas
along the high-speed railways and the high-speed roads around the island
(Figure 4).
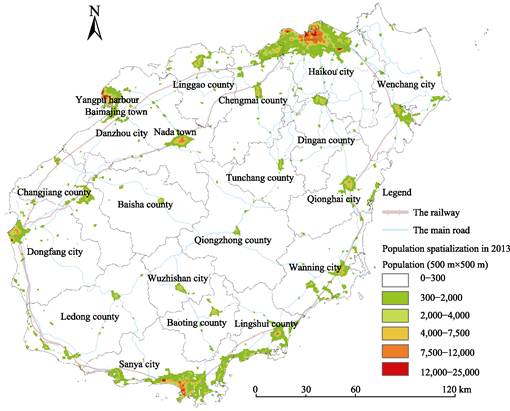
Figure
2 Population
spatialization of Hainan Island in 2013
4.3 Data Validation
The NPP/VIIRS night light data from 2013 to
2018 is used to retrieve the population of the past years through the model,
and the errors are verified according to the statistical data, and the large
errors are grouped and then modeled again. Based on the secondary modeling
after error grouping, the accuracy of population simulation is significantly
improved compared with the accuracy of the first simulation. The average
relative error of the model inversion
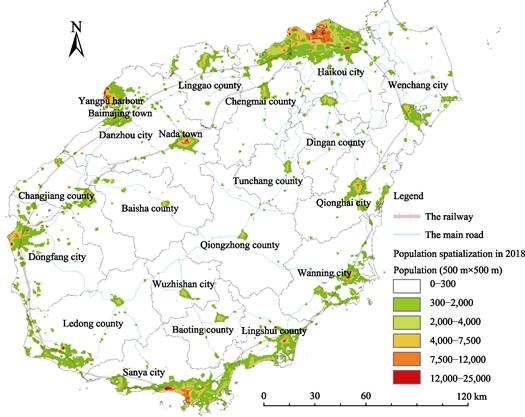
Figure
3 Population spatialization of Hainan Island in 2018
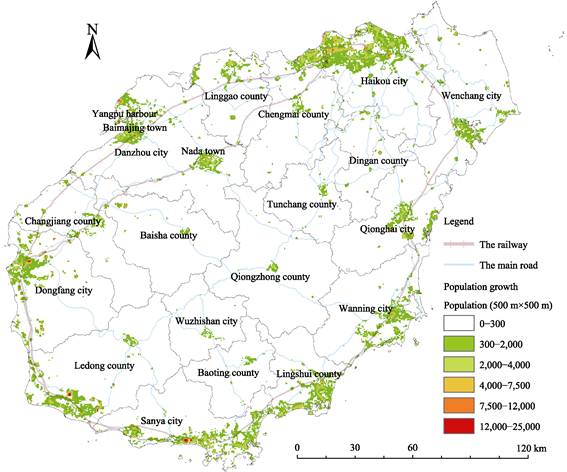
Figure
4 Population growth of Hainan Island from 2013‒2018
results is 18.19%,
and the regression coefficient R2
is above 0.9. The regression coefficient R2
results are close to the results of Li et
al.[10] and Cao et al.[11].
The model error is similar to that of Zhao et
al.[12], and higher than the average relative error of Wang et al.[13] and Chen et al.[14].
At the level of
cities and counties, Wuzhishan city has a large error in the retrieve results .
The reason is that Wuzhishan city is located in the hinterland of the central
mountainous area of Hainan Island, and its urban topography is undulating and
its population is sparse, so it is difficult to accurately retrieve its
population spatial distribution only by night light data. According to the
administrative divisions of Hainan province, the cities and counties are
divided into prefecture-level cities, county-level cities, ordinary counties
and ethnic minority autonomous counties. It can be found that the population
simulation error of prefecture-level cities is the smallest, followed by ethnic
minority autonomous counties. The error of county-level cities is slightly
higher than that of minority autonomous counties, and the error of ordinary
counties is the largest. There is no regular difference in population
simulation accuracy between cities and counties with different administrative
levels.
At the same
time, Fu et al. conducted population
regionalization based on the spatial distribution characteristics and regional
differences of the population in China, and screened out land use types with
strong correlation with population distribution as model parameters,
established a multiple regression model to achieve population spatialization,
and four factors of urban population density, traffic conditions, DEM and total
amount control are used to calibrate the model[15], and finally
obtained the national population distribution dataset. Among them, the average
relative error of the population spatialization data of Hainan Island in 2010
was only 0.92%[16]. Therefore, these methods can be referenced in
the future to combine night light data for population spatialization to improve
accuracy.
Table 2 Model
simulation results
|
Classification
|
Cities and counties
|
Statistical
population data
(ten thousand people)
|
First population simulation
(ten thousand people)
|
Error
|
Second population simulation
(ten thousand people)
|
Error
|
|
|
|
Prefecture
-level city
|
Haikou city
|
230.23
|
258.12
|
12.12%
|
194.61
|
15.47%
|
|
|
Sanya city
|
77.39
|
121.09
|
56.46%
|
74.51
|
3.72%
|
|
|
Danzhou city
|
99.84
|
90.34
|
9.52%
|
117.89
|
18.08%
|
|
|
Average error
|
26.03%
|
??
|
12.42%
|
|
|
County
-level city
|
Wenchang city
|
56.89
|
42.34
|
25.58%
|
51.57
|
9.35%
|
|
|
Qionghai city
|
51.57
|
43.34
|
15.97%
|
52.66
|
2.11%
|
|
|
Wanning city
|
57.86
|
47.28
|
18.28%
|
57.13
|
1.27%
|
|
|
Wuzhishan city
|
10.71
|
26.27
|
145.25%
|
16.36
|
52.77%
|
|
|
Dongfang city
|
42.97
|
62.63
|
45.74%
|
51.95
|
20.89%
|
|
|
Average error
|
50.16%
|
??
|
17.28%
|
|
|
Ordinary
county
|
Dingan county
|
29.76
|
30.05
|
0.99%
|
39.55
|
32.88%
|
|
|
Tunchang county
|
26.85
|
24.67
|
8.11%
|
35.09
|
30.68%
|
|
|
Chengmai county
|
49.44
|
57.02
|
15.33%
|
69.19
|
39.94%
|
|
|
Lingao county
|
45.1
|
35.25
|
21.84%
|
44.32
|
1.73%
|
|
|
Average error
|
11.57%
|
??
|
26.31%
|
|
|
Minority
Autonomous County
|
Ledong county
|
48.27
|
48.94
|
1.39%
|
59.08
|
22.39%
|
|
|
Qiongzhong county
|
18.02
|
24.86
|
37.95%
|
14.87
|
17.49%
|
|
|
Baoting county
|
15.28
|
26.68
|
74.59%
|
16.8
|
9.93%
|
|
|
Lingshui county
|
33.39
|
52.65
|
57.67%
|
43.06
|
28.95%
|
|
|
Baisha county
|
17.34
|
26.71
|
54.05%
|
16.83
|
2.91%
|
|
|
Changjiang county
|
23.35
|
36.68
|
57.07%
|
27.26
|
16.75%
|
|
|
Average error
|
47.12%
|
??
|
16.40%
|
|
|
Overall average error
|
36.55%
|
??
|
18.19%
|
|
5 Discussion and Conclusion
NPP/VIIRS
night lighting data population spatial modeling can basically reflect the
spatial distribution of population, but the simulation accuracy of Wuzhishan
city is poor. The reason may be due to the fact that Wuzhishan city is located
in the central mountainous area, with large terrain undulations, which greatly
affects the night light data, and the population of Wuzhishan city is small,
which is far from other cities and counties[14].
To solve this
problem, more detailed population zoning of the study area will be considered
in the future. At the same time, combined with land use data, POI and other
multi-source data[17], and multi geographical factor weighting
method, spatial weighted regression or neural network models will be adopted to
improve the inversion accuracy. This dataset is the 500-m resolution data of
Hainan Island??s population based on NPP/VIIRS night light data retrieve. This
dataset can reflect the spatial and temporal distribution of Hainan Island??s
population from 2013 to 2018, and can provide an auxiliary basis for the
current Hainan territorial spatial planning and related research.
Author Contributions
Han,
N. L. designed the algorithms of dataset. Lai, X. L. collected and processed
the night light data and designed the model. Huang,P. J. made data verification. Lai, X. L. wrote the data paper.
Conflicts of
Interest
The authors declare no conflicts of
interest.
References
[1]
Li, D. R., Li, X. On
noctilucent remote sensing data mining [J]. Journal
of Surveying and mapping, 2015, 44(6): 591?C601.
[2]
Li, F., Mi, X. N., Liu, J., et al. Spatialization of GDP in Beijing
based on NPP-VIIRS nighttime light data [J]. Remote sensing for land and resources, 2016, 28(3): 19?C24.
[3]
Li, F., Sun, G. T., Wang, Q. L.,
et al. Spatialization of power
consumption at county level based on NPP-VIIRS nighttime light data [J]. Geomatics & Spatial Information, 2018, 41(4): 8?C11, 15, 18.
[4]
Gao, Y., Wang, H., Wang, P. T.
Spatial analysis of coastal population based on population census and
multi-source nighttime light data [J]. Resources
science, 2013, 35(12): 2517?C2523.
[5]
Lai, X. L., Han, N. L., Huang,
P. J. Night lighting and census integrated 500 m raster population dataset of Hainan Island (2013-2018) [J]. Digital
Journal of Global Change Data Repository, 2021. https://doi.org/10.3974/geodb.2021.08.02.V1. https://cstr.escience.org.cn/CSTR:20146.11.2021.08.02.V1.
[6]
GCdataPR Editorial Office. GCdataPR data
sharing policy [OL]. https://doi.org/10.3974/dp.policy.2014.05 (Updated 2017).
[7]
Hainan Bureau of Statistics,
National Bureau of Statistics Hainan Survey Team. Hainan statistical yearbook
[OL]. 2014-2019.
http://www.hainan.gov.cn/hainan/tjnj/list3.shtml.
[8]
Hu, W. A., Liu, C. L., Zhan, Q.
W. Synthesis method and comparative verification of nPP-VIIRS annual night
light data in China [J/OL]. Journal of
Guilin University of Technology, 2020: 1?C10 [2020-12-23].
[9]
Zhou, Y., Chen, Y., Liu, Y., et al. Generation and verification of
NPP-VIIRS annual nighttime light data [J]. Remote
sensing information, 2019, 34(2): 62?C68.
[10]
Li, X., Chen, Z. J., Wu, J. X.,
et al. Research on grid method of
urban resident population based on night light data and spatial regression
model [J]. Journal of geo-information
science, 2017, 19(10): 1298?C1305.
[11]
Cao, L. Q., Li, P. X., Zhang,
L. P. Urban population estimation based on DMSP/OLS nighttime light data: a
case study of counties in Hubei province [J]. Remote Sensing Information, 2009(1): 83?C87.
[12]
Zhao, Y., Wang, L., Li, X. X., et al. Spatialization of population in
Dalian based on NPP/VI RS night light and land use [J]. Resources development and market, 2018, 34(10): 1372?C1376.
[13] Wang, X. X., Zhao, M. S, Xie, Y., et al. Spatialization of population data in Jiangsu province based
on NPP- VIIRS night light remote sensing [J]. Journal of heilongjiang institute of technology, 2020, 34(3): 31?C35.
[14]
Chen, Q., Hou, X. Y., Wu, L.
Comparative analysis of spatialization model of population based on land use
data and night light data: a case study of high efficiency ecological economic
zone in the Yellow River Delta [J]. Human
geography, 2014, 29(5): 94?C100.
[15]
Fu, J. Y., Jiang, D., Huang, Y.
H. Dataset of kilometer-grid population distribution in China [J]. Acta Geographica Sinica, 2014, 69(Sup.):
41?C44.
[16]
Fu, J. Y., Jiang, D., Huang, Y.
1 km grid population dataset of China [DB/OL]. Global Change Data Repository,
2014. https://doi.org/10.3974/geodb.2014.01.06.V1.
[17]
Zhao, X., Song, Y. Q., Liu, Y. L.,
et al. Spatialization of population
based on satellite remote sensing and POI data: a case study of Guangzhou [J]. Tropical geography, 2020, 40(1): 101?C109.