Anomaly and
Mutation Dataset of Shallow Soil Temperature in Xi??an Region (1961?C2017)
Liu, Y. G.* Su, Y.1 Fang, J. G.2
1. College of Geography and
Environment, Baoji University of Arts and Sciences, Baoji 721013, China;
2. Climate Center
of Shaanxi Province, Xi??an 710014, China
Abstract: In this study, based on existing
literature research and the monthly ground temperature observation data from
1961 to 2017 in Xi??an city, Hu county, Chang??an district, and Gaoling district,
the Anomaly and mutation dataset of soil shallow temperature
in Xi??an region (1961-2017) was developed
through processing methods such as climate diagnosis, unit conversion, error
correction, and distance equality data, and data analysis methods such as
wavelet analysis and Mann-Kendall non-parametric test. The dataset includes: (1) chronological
data, year-by-year flat data, average annual temperature distance data,
month-by-month flat data;(2)periodic, mutation, and outlier data. This dataset is archived
in .xlsx format and consists of 6 data files with a data size of 546 KB.
Keywords: Xi??an region; shallow soil temperature; anomaly index; variation characteristics
DOI: https://doi.org/10.3974/geodp.2022.04.02
CSTR: https://cstr.escience.org.cn/CSTR:20146.14.2022.04.02
Dataset Availability Statement:
The dataset
supporting this paper was published and is accessible through the Digital Journal of
Global Change Data Repository at: https://doi.org/10.3974/geodb.2022.04.06.V1 or https://cstr.escience.org.cn/CSTR:20146.11.
2022.04.06.V1.
1 Introduction
Shallow soil temperature (shallow
ground temperature) refers to the temperature of different soil depths between
5 cm and 20 cm from the ground surface[1], which is one of the important
indicators reflecting the physical properties of soil and has an important
impact on crop growth, urban construction, and geothermal resource development
and utilization. With the intensification of global warming and human
activities[2], the IPCC Fifth Assessment Report
(AR5) stated that the global average surface temperature increased by 0.85 ??C
between 1880 and 2012[3,4] and that the increase in global
surface temperatures will inevitably lead to changes in soil temperatures.
Therefore, many scholars have studied regional shallow ground temperature
variations and their effects from different perspectives, indicating that
shallow ground temperature variations in different regions have regional
differences and increasing trends[5?C11].
At present, there are
few systematic studies on the shallow soil temperature change in the Xi??anregion.
With the accelerated development and urbanization of the western region, the
land use mode of Xi??an region has changed, which had a great impact on the
coordinated development of agricultural production, urbanization, and ecological
environment. Therefore, it is of great significance to study the change law of
shallow ground temperature and its influencing factors in Xi??an region under
the background of climate warming for the assessment of the agricultural
development and climate change, the rational use of climate resources, and the
ecological civilization construction in Xi??an region.
Due to the short
detection time scale and few ground temperature measurement stations in the
past, the systematic analysis of ground temperature cannot be well performed[12]. Therefore, based on the monthly data of shallow ground
temperature in the Xi??an area, the shallow soil temperature distance flat and
abrupt datasets in this area were prepared and verified by Pearson correlation
analysis to further improve the accuracy of the dataset, which can provide data
support to study the spatial-temporal variation of shallow ground temperature
in Xi??an region and the analysis of the causes of changes.
2 Metadata of the Dataset
The
metadata summary of the Anomaly and mutation dataset of shallow soil
temperature in Xi??an region (1961-2017)[13] is summarized in Table 1. It includes the full
name of the dataset, short name of the dataset, authors, year of the dataset,
temporal resolution, spatial
Table 1 Metadata summary of
the Anomaly and mutation dataset of shallow soil temperature in Xi??an region
(1961-2017)
|
Items
|
Description
|
|
Dataset
full name
|
Anomaly and mutation dataset
of shallow soil temperature in Xi??an region (1961?C2017)
|
|
Dataset
short name
|
SoilTempAnomalyXiAn_1961-2017
|
|
Authors
|
Liu, Y. G., College of
Geography and Environment, Baoji University of Arts and Sciences/Shaanxi
Provincial Key Laboratory of Disaster Monitoring and Mechanism Simulation,
yingeliu@163.com
Su, Y., College of Geography
and Environment, Baoji University of Arts and Sciences/Shaanxi Provincial Key
Laboratory of Disaster Monitoring and Mechanism Simulation, 1963582780@qq.com
Fang, J. G., Climate Center of
Shaanxi Province
|
|
Geographical area
|
Xi??an area (Xi??an city, Hu
county, Chang??an district, Gaoling district)
|
|
Data format
|
.xlsx Year
1961?C2017
|
|
Data size
|
546 KB
|
|
Dataset files
|
(1) Chronological interval
data; (2) Year-on-year data; (3) Annual and seasonal average temperature
level data; (4) Month-by-month data; (5) Data on years of geothermal
anomalies; (6) data on abrupt changes in geothermal temperatures
|
|
Foundations
|
National Natural Science
Foundation of China project (41771048); Shaanxi Provincial Key R&D
Program Project (2022SF-364??
|
|
Data publisher
|
Global Change Research Data Publishing &
Repository, http://www.geodoi.ac.cn
|
|
Address
|
No. 11, Datun Road, Chaoyang
District, Beijing 100101, China
|
|
Data sharing policy
|
Data from
the Global Change Research Data Publishing & Repository includes metadata, datasets
(in the Digital Journal of Global Change Data Repository), and
publications (in the Journal of Global Change Data & Discovery). Data sharing policy
includes: (1) Data are openly available and can be free downloaded via the
Internet; (2) End users are encouraged to use Data subject to
citation; (3) Users, who are by definition also value-added service
providers, are welcome to redistribute Data subject to written permission
from the GCdataPR Editorial Office and the issuance of a Data redistribution
license; and (4) If Data are used to compile new
datasets, the ??ten per cent principal?? should be followed such that Data
records utilized should not surpass 10% of the new dataset contents, while
sources should be clearly noted in suitable places in the new datase[14]
|
|
Communication
and searchable system
|
DOI, CSTR, Crossref, DCI, CSCD, CNKI,
SciEngine, WDS/ISC, GEOSS
|
resolution, data format, data
size, data files, data publisher, and data sharing policy.
3 Data Processing
|
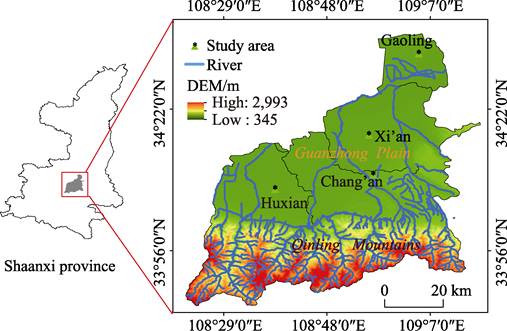
Figure 1 Study area and urban distribution map
|
3.1 Data Sources and
Pre-processing
The research
data in this paper were obtained from the mon- thly average temperature observation
data of the 5?C20 cm soil layer in Xi??an region Hu county, Chang??an district,
and Gaoling district from 1961 to 2017 (Gaoling Station provided data from
1970?C2017 due to the unavailability of geothermal data measurement), and the
distribution of the study area and city is shown in Figure 1.
Firstly, monthly
ground temperature data was converted by units and the outliers were corrected.
Secondly, the 30-year average ground temperature from 1961 to 1990 was used as
the standard to calculate the monthly,
quarterly, and annual ground temperature in different years. According to the
seasons in China, spring is March to May, summer is June to August, autumn is
September to November, and winter is December to February[15].
Seasonal ground temperature is the average of the corresponding month, and the
annual ground temperature is the average temperature from January to December.
|
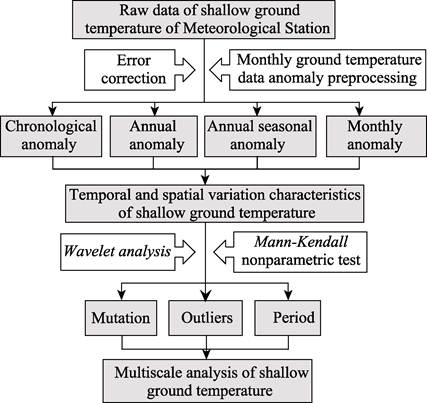
Figure 2 Technology route for
research and development of shallow soil temperature dataset in Xi??an region
|
3.2 Technical Route
The dataset was organized using the monthly observed shallow soil temperature
data from 1961 to 2017 in Xi??an region, and the technical route is shown in
Figure 2. The steps are as follows: (1) Data pre-processing and error
correction were carried out, the temperature spacing index of year, quarter,
and month was calculated, the datasets of the year, month, and season interval
datasets were established, and the spatio-temporal variation characteristics
of shallow ground temperature was analyzed. (2) The wavelet transform and Mann-
Kendall nonparametric test method were used to establish a mutation dataset,
and the geothermal index of four regions in Xi??an was analyzed by periodic and
mutation tests. According to the evaluation standard of the ??National Climate
Impact Assessment?? of the China Meteorological Administration, the ratio of the
ground temperature distance data to the standard deviation is used to determine
whether the ground temperature is abnormal. When the ratio is ?? ?C2, the ground
temperature is abnormally low, and when the ratio is ?? 2, the ground
temperature is abnormally high. Based on this, the abnormal dataset was
established. (3) The periodic characteristics, abnormal characteristics, and
mutation characteristics of ground temperature indices of different scales were
analyzed.
4 Data Results and Validation
4.1 Dataset Composition
The Dataset of shallow soil temperature
distance and abrupt changes in the Xi??an region (1961-2017)
consists of the following data.
(1)
Chronological data in Xi??an region: the annual and seasonal geothermal intervals are flat, and the regional geothermal
epochs are flat (Tab 1). (2) Yearly flat data in the Xi??an region: the annual
season and regional ground temperature are yearly flat and the ground
temperature of each layer and the whole shallow layer is yearly flat (Tab 2).
(3) Average annual temperature distance data in Xi??an (Tab 3). (4)
Month-by-month flat data in Xi??an: the monthly maximum temperature and lowest
temperature distance are flat, and the monthly average temperature distance
data is flat (Tab 4). (5) Data of abnormal years of
geothermal anomalies in Xi??an region (Tab 5). (6) Geothermal mutation data in
the Xi??an region: including mutation year and M-K test hyperbola (Tab 6). The
.xlsx file in the dataset includes 6 data tables with a data size of 546 KB.
4.2 Data Results
4.2.1 Characteristics of Average Geothermal Variation in Years and
Seasons
Both the annual average geothermal temperature and the
seasonal average geothermal temperature of 5?C20 cm in Xi??an showed a
fluctuating upward trend, and there was a sharp upward trend after the 1990s.
Among the layers, the maximum trend rate was 0.38?C0.46 ºC/10a in spring and the minimum trend rate was
0.07?C0.12 ºC/10a in summer. The
increase was 0.14?C0.19 ºC/10a in autumn,
and 0.12?C0.15 ºC/10a in winter. The
annual average geothermal trend rate increased by 0.18?C0.22 ºC/10a. The increase in geothermal growth since
the 1990s is related to the rapid development of urbanization and global
warming in Xi??an (Figure 3).
4.2.2 Chronological Variation of Geothermal
Temperatures in Various Regions
The geothermal intergenerational flatness change in various regions is
shown in Figure 4. It can be seen from the figure that the 5?C20 cm soil layer
in the Xi??an region shows a positive and negative flattening change, among
which the 1960s to the end of the 1970s and after 2010 is positive and flat,
and the soil temperature increases. From 1980 to 2010, the soil temperature
decreased, and only the 5 cm and 20 cm soil layers of Gaoling district
increased in the 1990s. Meanwhile, the highest value of the distance to the
flat also appeared in Gaoling district in the 1990s, and the lowest value
appeared in Chang??an district in the 1980s. In general, the interdecadal
changes of geothermal temperature in various regions showed the characteristics
of alternating high and low, among which the change in the distance from
Chang??an district to parity is the most obvious, showing a significant downward
trend, followed by Gaoling district, showing a clear upward trend. Hu county
showed a weak downward trend, and Xi??an region had the smallest change, showing
a weak upward trend.
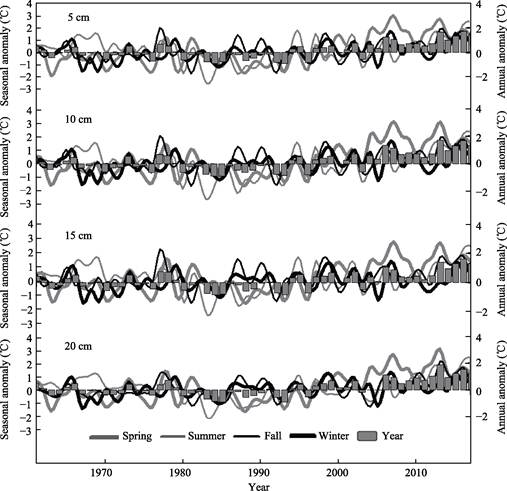
Figure
3 Yearly variation of shallow ground
temperature in Xi??an region
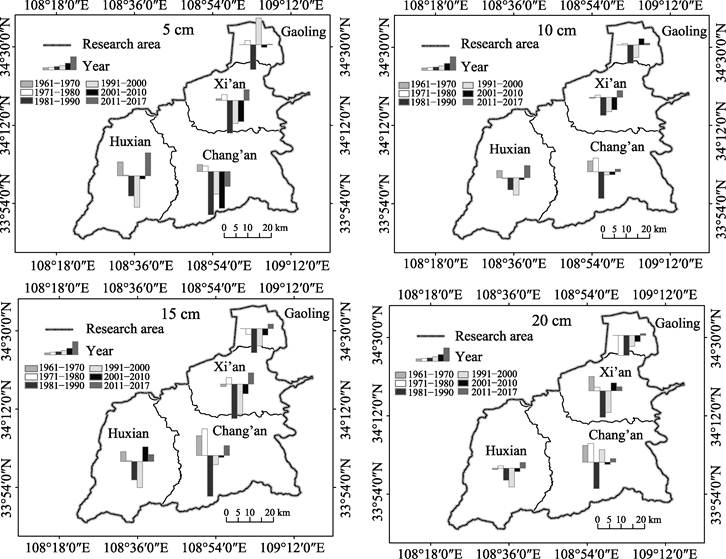
Figure
4 Geothermal chronology of different soil
layers in the Xi??an region
4.2.3 Multiscale Characteristics of Ground
Temperature
In this
dataset, the anomalous years are summarized by the anomalous characteristics of
strata in Various Strata in Xi??an region (Tab 5). From the table, the
abnormally low years mostly appear in 1960?C1970 and 1980?C1990, and the
abnormally high years appear in 1970?C1980, 1990?C2000, and after 2000. Overall,
there were fewer years with average annual temperature anomalies, occurring
only in 15 cm and 20 cm soil layers.
Then, the M-K
non-parameter test was performed on the flat data to obtain the mutation year
of shallow ground temperature in Xi??an (Tab 6). The mutation points of the four
soil layers occurred after the 21st century and there was no mutation in
summer.
The geothermal change
in Xi??an region also shows obvious periodic characteristics. Figure 5 shows the
cross wavelet transformation energy spectrum of the average ground temperature
of the 5-20 cm soil layer in Xi??an
region . In the figure, the more yellow the color, the greater the energy
spectral density. Figure 6 shows that
from 1975 to 2005, the average temperature of
the 5?C20 cm soil layer in Xi??an region has a significant short cycle of 2?C6 a
and a long cycle of 8?C20 a.
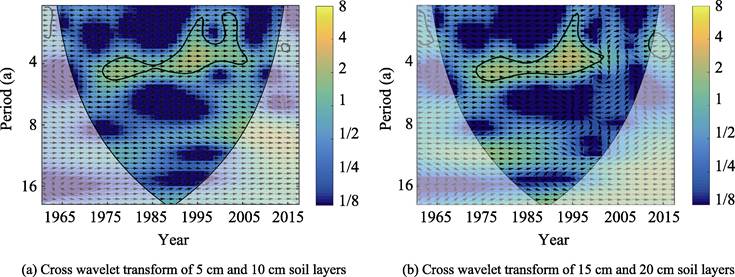
Figure 5 Cross wavelet transform map of average 5-20 cm ground temperature in the Xi??an region
4.3 Data Result and Verification
The data
error comes from the lack of measurement of the monthly ground temperature data
of the weather station, but the data quality has been tested in this dataset to
minimize the data error. Among them, the missing measurement data or extreme
outliers within 3 days are replaced by the average of the ground temperature of
the previous and subsequent 2 days, and the data years with more than one day
missing are not used. For example, the geothermal data of Xi??anregion, Chang??an
district, and Hu county from 1951 to 1960 and the geothermal data of Gaoling
district from 1951 to 1969 have missing measurements in a certain year.
The Pearson
correlation analysis was carried out using the seasonal distance and shallow
ground temperature in the study area and the average seasonal temperature of
the ground of Xi??an Meteorological Station every year to verify the reliability
of the data. As shown in Table 2, the correlation between ground temperature
and shallow ground temperature in the study area was high, both reaching about
0.8, passing the significance test of 0.01 level. At the same time, it can be
seen that the correlation between ground temperature and shallow ground
temperature in spring and summer decreases with the deepening of depth, indicating
that the ground temperature has a strong influence on the shallow soil
temperature with solar radiation as the heat source. The correlation between
ground temperature and shallow ground temperature in winter increases with the
deepening of the depth, indicating that the ground temperature with soil as the
heat source increases with the increase of soil depth. This is consistent with
previous conclusions about the characteristics of vertical variations in ground
temperature in the study area[16] and is sufficient to verify the
reliability of the distance-level data.
Table 2 Pearson correlation analysis
between temperature and
shallow ground temperature
in Xi??an region
|
Depth (cm)
|
Spring
|
Summer
|
Autumn
|
Winter
|
|
5
|
0.88
|
0.86
|
0.79
|
0.79
|
|
10
|
0.87
|
0.84
|
0.81
|
0.81
|
|
15
|
0.84
|
0.82
|
0.81
|
0.84
|
|
20
|
0.85
|
0.74
|
0.71
|
0.84
|
5 Discussion and Summary
The shallow
soil temperature pitch and abrupt change dataset in the Xi??an (1961?C2017) is
based on the shallow soil temperature data of four regions in Xi??an region from
1961 to 2017. The original data were analyzed by temporal variation
characteristics of ground temperature seasonally and chronologically in the
context of significant global climate warming, as well as the variation
characteristics of the ground temperature with the depth of the soil layer.
Then, wavelet analysis and Mann-Kendall nonparametric test were used to analyze
the month-by-month flat data by periodic and mutation tests, and the outliers
were sorted out.
The main
conclusions are as follows:
(1) The
shallow ground temperature changes in Xi??an region showed a fluctuating upward
trend, and it showed a sharp upward trend after the 1990s. Among the layers,
the trend rate is the largest in spring, the smallest in summer, and moderate
in autumn and winter. The annual average ground temperature trend rate
increased by 0.18?C0.22 ºC/10a.
(2) The
interdecadal changes of geothermal temperature in various regions in the soil
layer of 5?C20 cm generally showed the stage characteristics of alternating cold
and warm. The change of distance and flat value in Chang??an district was the
most obvious, showing a significant downward trend, followed by Gaoling
district, showing a clear upward trend. Hu county showed a weak downward trend,
and Xi??an city had the smallest change, showing a weak upward trend.
(3) The
multi-scale characteristics of the geothermal temperature in Xi??an are as
follows: the mutation points are all after the 21st century, and there is no
mutation in the summer; the geothermal variations also show abnormal features,
with fewer years of annual average geothermal anomalies occurring in soil
layers of 15 cm and 20 cm; there are significant 2?C6 a and 8?C20 a cycles in the
average temperature of the 5?C20 cm soil layer.
The
month-by-month ground temperature data of the four regions in Xi??an can only
reflect the temporal variation trend of soil shallow temperature in Xi??an and
the characteristics of the ground temperature variation with soil depth.
However, it is difficult for these data to reflect the factors affecting the
ground temperature change and its connection with these factors. Therefore, the dataset and the
influence mechanism of ground temperature change need to be further studied.
Author Contributions
Liu, Y. G. designed the algorithms of dataset. Su,
Y. and Fang, J. G. contributed
to the data processing and analysis. Su, Y. wrote the data paper.
Conflicts of Interest
The
authors declare no conflicts of interest.
References
[1] China Meteorological Administration. Specifications for Ground
Meteorological Observation [M]. Beijing: Meteorological Press, 2003: 85‒89.
[2] Liu, Y.
G., Yu, K. K., Zhao, Y. Q., et al.
Impacts of climatic variation and human activity on basin runoff in eastern
China [J]. Sustainability, 2022, 14: 1‒19.
[3] Tang, G. L., Ren, G. Y. A reanalysis of China??s surface temperature change
trend in the past hundred years [J]. Climatic and Environmental Research,
2005(4): 791‒798.
[4] IPCC. Special Report on Global Warming of 1.5 ºC [M]. UK: Cambridge University Press, 2018: 785.
[5] Pei, H. Q., Sun, C. W., Wu, L. Z. Variation characteristics of shallow
ground temperature in Linyi in the past 48 years [J]. Chinese
Agrometeorology, 2009, 30(Supp.1): 38‒41.
[6] Chen, Y., Pan, Q. X., Gu, X., et al. Characteristic analysis of
shallow ground temperature change in Qiannan from 1961 to 2018 [J]. Low and
Medium Latitude Mountain Meteorology, 2021, 45(4): 80‒84.
[7] Yang, P., Chen, S. H., Gu, X. Characteristics of temporal and spatial
variation of shallow ground temperature in southeast Qiandong in the past 50
years [J]. Journal of Southwest Normal University: Natural Science Edition, 2012, 37(11): 54‒58.
[8]
Zhou, S. Y.,
Lao, W., Su, Z., et al. Characteristics of shallow geothermal variation
in Guangxi from 1961 to 2010 [J]. Southwest China Journal of Agricultural Sciences, 2012,
25(4): 1372‒1375.
[9] Qiang, Y. Z., Pu, J. Y., Liu, Y., et
al. Characteristic analysis of shallow ground temperature change in
Tianshui city in the past 50 years [J]. Chinese Agricultural Science
Bulletin, 2013, 29(35): 317‒322.
[10] Liu, T., Gao, X. Q., Yang, L. W., et al. Multi-scale analysis of
shallow ground temperature changes in the Jianghuai region in the nearly 36 a [J].
Plateau Meteorology, 2020, 39(2): 357‒366.
[11] Zheng, Y., He, M. F., Zhou, H. J. Characteristics of geothermal variation
in Anqing City from 1961 to 2019 [J]. Modern Agricultural Science and Technology, 2020(15): 204‒205, 209.
[12] Lu, X., B., Xu, H., M., Sun, C., H., et al. Characteristics of ground temperature change in China in the past 50
years [J]. Journal of Nanjing
Institute of Meteorology, 2006(5): 706‒712.
[13] Liu, Y.
G., Su, Y., Fang, J. G. Anomaly and mutation dataset of soil shallow
temperature in Xi??an region (1961-2017) [J/DB/OL]. Digital
Journal of Global Change Data Repository, 2022. https://doi.org/10.3974/ eodb.2022.04.06.V1.
https://cstr.escience.org.cn/CSTR:20146.11.2022.04.06.V1.
[14] GCdataPR Editorial
Office. GCdataPR data sharing policy [OL]. https://doi.org/10.3974/dp.policy.2014.05
(Updated 2017).
[15] China Meteorological Administration. Ground meteorological observation
specification ground temperature (GB/T 35233?D2007) [S]. Beijing: China Standards Press, 2017.
[16] Liu, Y. G., Zhou, H. H., Hu, H. N., et al. Characteristics of shallow
soil temperature change in Xi??an
area [J]. Journal of Arid Land Resources and Environment, 2019, 33(8):
153‒159.