Net Primary Productivity
Dataset of Mangrove Ecosystem in Guixian Island, China (2018)
1. School of Resources and Environment, Beibu Gulf
University, Qinzhou 535011, China;
2. Guangxi Key Laboratory for Geospatial Informatics and
Geomatics Engineering, Guilin University of Technology,Guilin 541004, China
Abstract: Based
on the image data collected by drone seasonal aerial photography in 2018, as
well as precipitation, temperature and solar
radiation data from nearby weather stations, this research focusing on study
into the Guixian Island and its adjacent areas have obtained the NPP dataset of
mangrove ecosystem in Guixian Island of Beibu Gulf through introducing alternative
visible-band difference vegetation index (VDVI) and adopting Carnegie?CAmes?CStanford Approach (CASA)
model to estimate the net primary productivity of vegetation. The data analysis
results show that the spatial differences of vegetation NPP in different
seasons are obvious. The seasonal increase percentages of NPP in the three
stages of spring to summer, summer to autumn, and autumn to winter are 203.67%,
?C39.06% and ?C75.16%,
respectively. In the NPP changes of the Guixian Island mangrove ecosystem, temperature
has a stronger influence on NPP than precipitation. The dataset includes: (1) Landscape map of
mangrove ecosystem study area in Guixian Island, Beibu Gulf in 2018 (.jpg).
(2) Vegetation landscape types, VDVI vegetation index, seasonal scale and
annual vegetation net primary productivity point data of mangrove ecosystem
study area in Guixian Island, Beibu Gulf in 2018 (.shp). The dataset is archived
in .jpg and .shp format with a data size of 15.5 MB (compression to 1 file, 3.11
MB).
Keywords: drone;
mangrove ecosystem; NPP; vegetation
index; Beibu Gulf
Dataset Availability Statement:
The dataset supporting this paper was published and is accessible
through the Digital
Journal of Global Change Data Repository at:
https://doi.org/10.3974/geodb.2020.06.21.V1.
1 Introduction
Mangroves, which are one of the main types of ??blue
carbon?? in coastal wetlands, grow on the intertidal tidal flats in tropical and
subtropical regions. They have protection from wind and waves, promote siltation and build land, purify the environment,
provide transfer stations and food for migratory birds, and maintain ecological
functions (such as biodiversity)[1?C2]. Mangroves have very
high carbon storage per unit area and are one of the ecosystems with the
highest carbon content in tropical regions[2?C3]. Therefore, the
estimation of carbon storage in mangrove wetlands is important to assess the
role of mangrove ecosystems in the global carbon cycle[4?C6]. The
mangrove communities in the Beibu Gulf of Guangxi are an important part of the
mangrove wetland ecosystem in China. The mangroves of the Longmen Islands in
Qinzhou are one of the most densely grown areas of mangroves in Qinzhou.
Residential areas and many large-scale industrial areas surround it. The
islands have long-term human activities. Thus, the study of the carbon storage
and spatial distribution characteristics of the mangrove ecosystem of the
Longmen Islands group under the interference of global climate change and human
activities has important representativeness and typicality.
Net primary productivity (NPP) is the remaining part of the total organic
matter produced by photosynthesis of green plants per unit time and area after
deducting autotrophic respiration consumption[7]. Estimating changes
in carbon storage depends on reliable estimates of NPP[8]. The
models for estimating NPP mainly include statistical, parameter, and process
models[9]. The Carnegie?CAmes?CStanford approach (CASA) model of light
energy utilization is a process-based remote sensing model that is used to
estimate the NPP of ecosystems at global and regional scales. It is widely used
in NPP estimation at global/region scale[7,9?C15]. The present study
adopts the CASA model improved by Zhu[7] on the basis of the UAV aerial
image data in the four seasons of 2018 and the shared data of precipitation,
temperature, and solar radiation from meteorological stations near the study
area. The visible-band difference vegetation index (VDVI) is added to the
estimated model parameters to estimate the NPP and its spatial distribution of
vegetation in the mangrove ecosystem of Guixian Island in Beibu Gulf in
different seasons.
2 Metadata of the Dataset
The metadata of the dataset[16] is summarized
in Table 1. It
includes the dataset full name, short name, authors, year of the dataset,
temporal resolution, spatial resolution, data format, data size, data files,
data publisher, and data sharing policy, etc.
3 Methods
As mentioned
above, Zhu??s improved CASA model[7] is used in this study. The parameters
of the model are calculated on the basis of the RGB image data of the study
area collected by drone aerial photography in the four seasons of spring,
summer, autumn, and winter in 2018 and the shared meteorological data of
precipitation, temperature, and solar radiation from meteorological stations
near the study area provided by China Meteorological Sharing Service Network.
With the help of CASA model[18], the NPP of mangrove ecosystem in
Guixian Island is estimated, and the correlation analysis is conducted on the
seasonal and monthly scales.
Table 1
Metadata summary of the ??Seasonal
NPP dataset of the mangrove ecosystem in Guixian Island of China (2018)??
|
Items
|
Description
|
|
Data full name
|
Seasonal NPP Dataset of the Mangrove Ecosystem in Guixian Island
of China
|
|
Data short name
|
NPP_BeibuGulf Mangrove_2018
|
|
Authors
|
Tao, J. AAT-4683-2020, School of Resources and Environment, Beibu Gulf University,
taojin1216@yeah.net
Tian, Y. C., School of Resources and Environment, Beibu Gulf University, tianyichao1314@yeah.net
Zhang, Q. A-6449-2018, School of Resources and Environment, Beibu Gulf University, 676489898@qq.com
Zhou, G. Q., Guangxi Key Laboratory for Geospatial Informatics and Geomatics
Enginee-ring, Guilin University of Technology, gzhou@glut.edu.cn
Han, X., School of Resources and Environment, Beibu Gulf University, 2383272519@qq.com
Zhang, Y. L., School of Resources and Environment, Beibu Gulf University, 641577425@qq.com
|
|
Geographical region
|
Guixian Island in Beibu Gulf (21??44¢28²N-21??44¢58²N, 108??35¢24²E-108??35¢44²E)
|
|
Year
|
2018
|
|
Temporal resolution
|
1 season
|
|
Spatial resolution
|
0.5 m
|
|
Data format
|
.jpg, .shp
|
|
Data size
|
15.5 MB (Compressed to 3.11 MB)
|
|
Data files
|
(1) Landscape map of mangrove ecosystem study area in Guixian Island,
Beibu Gulf in 2018 (.jpg). (2) Vegetation landscape types, VDVI vegetation
index, seasonal scale and annual vegetation net primary productivity point
data of mangrove ecosystem study area in Guixian Island, Beibu Gulf in 2018
(.shp)
|
|
Foundation(s)
|
Guangxi Natural Science Foundation (2018JJA150135); Guangxi
Innovation-driven Development Special Project (AA18118038); Guangxi Base and
Talent Project (2019AC20088); Beibu Gulf University High-level Talent
Introduction Project (2019KYQD28)
|
|
Data computing
environment
|
ArcGIS10.2, ENVI5.3
|
|
Data publisher
|
Global Change Research Data Publishing & Repository, http://www.geodoi.ac.cn
|
|
Address
|
No. 11A, Datun Road, Chaoyang District, Beijing 100101, China
|
|
Data sharing policy
|
Data from the
Global Change Research Data Publishing &Repository includes metadata, datasets
(in the Digital Journal of Global Change Data Repository), and
publications (in the Journal of Global Change Data & Discovery). Data
sharing policy includes: (1) Data are openly available
and can be free downloaded via the Internet; (2) End users are encouraged to
use Data subject to citation; (3) Users, who are by definition
also value-added service providers, are welcome to redistribute Data subject
to written permission from the GCdataPR Editorial Office and the issuance of
a Data redistribution license; and (4) If Data are
used to compile new datasets, the ??ten per cent principal?? should be followed
such that Data records utilized should not surpass 10% of the
new dataset contents, while sources should be clearly noted in suitable
places in the new dataset[17]
|
|
Data and paper
retrieval system
|
DOI, DCI, CSCD, WDS/ISC, GEOSS, China GEOSS, Crossref
|
3.1 Study Area
The mangrove
wetland of the Longmen Islands in Qinzhou is one of the four major wetlands in
the Qinzhou Bay, and it is included in the list of important wetlands in China.
This study selects Guixian Island in the Longmen Islands and its adjacent
Beifengdun and the surrounding mangrove wetland community as the study area.
Tourist facilities, such as a roundabout road, amusement wharf, and wind wheel
platform, are available on the island with a total area of 27.08 km2;
they are accompanied by long-term human activities. The image map and DEM of
the study area are shown in Figure 1.

Figure 1 Image and DEM Map of Guixian
Island in Beibu Gulf
3.2 Algorithm Model
The CASA model is mainly determined by the two factors of
plant absorbed photosynthetic active radiation (APAR) and actual light energy
utilization (??), and its estimation formula[7] is given as follows:
 (1)
(1)
where is the NPP of the vegetation on the pixel x in month t
(t??hm?C2??a?C1);
is the NPP of the vegetation on the pixel x in month t
(t??hm?C2??a?C1);  is the photosynthetically active radiation absorbed by the
vegetation on the pixel x in month t (MJ??m?C2);
is the photosynthetically active radiation absorbed by the
vegetation on the pixel x in month t (MJ??m?C2); is the actual light energy utilization rate of the ground
vegetation on the pixel x in month t (gC??MJ?C1).
is the actual light energy utilization rate of the ground
vegetation on the pixel x in month t (gC??MJ?C1).
The
APAR of plants depends on the total solar radiation and the absorption ratio of
photosynthetically active radiation by vegetation; the absorption ratio of the
photosynthetically active radiation is highly correlated with the VDVI[18].
The actual light energy utilization rate represents the efficiency of
vegetation converting the absorbed photosynthetically active radiation into
organic carbon[9], which is mainly affected by the low- and
high-temperature stress coefficient, water stress coefficient, and maximum
light energy utilization rate.
3.3 Data Processing
The acquisition
and processing of relevant data in the study area and model parameter estimation
are the core parts in applying the CASA model to estimate vegetation NPP. The
data obtained in the early stage include (1) UAV images and control point data
in the study area; (2) DEM data in the study area; and (3) meteorological data,
such as precipitation, temperature, and solar radiation, in the study area.
Data processing mainly includes UAV image data processing, meteorological data
processing, and model parameter estimation.
3.3.1 UAV Remote Sensing Image Collection and Processing
This study uses
the regional scale to investigate the NPP of the Guixian Island mangrove
wetland. The estimation model based on remote sensing is currently the most
effective way to estimate the regional scale, but remote sensing data with
different spatial resolutions will exert spatial scale effects. According to
the relative altitude formula in the ??Low-Altitude Digital Aerial Photography
Specification??, H=f´GSD/a, where H is the relative altitude, f
is the focal length of the camera
lens, ground sample distance (GSD) is the ground sampling interval,
and a is the size of the pixel. Therefore, the same model of drone (DJI
Phantom 4Pro) and the same planned route are used to collect data in the case
of a fixed survey area. Thus, the collected data have nearly the same GSD to
effectively avoid the scale effect brought by the estimation of NPP based on
remote sensing technology estimation model.
(1) Route
planning and aerial photography data collection
|
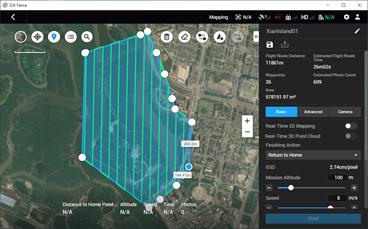
Figure
2 Map
of mangrove study area in Guixian Island
|
UAV visible light remote sensing data
collection usually selects a time zone around noon when the air visibility and
light conditions are good and no wind or breeze exists. Therefore, the route
should be planned in advance according to the location and terrain of the survey
area. As shown in Figure 2, an aerial survey area of 578,191.97 m2
is delineated using the DJI Terra ground station, the mission height is set to
100 m, the flying speed is 8 m??s?C1, the GSD is fixed at 2.74 cm per pixel,
the side overlap rate is 64%, the heading overlap rate is 80%, the main course
angle is 180??, and the camera selects farmland white balance and automatic
exposure mode. Every aerial photography mission throughout the year is conducted
using the current route with fixed parameters.
(2) Image
control point selection
Image control points are ground points
that can be clearly distinguished from the images and geo-coordinated then. The
DJI Phantom 4Pro used in this experiment does not have an RTK module. Thus,
image control points should be set up near the flight belt to ensure the
accuracy of its relative position. Guixian Island is a tourist attraction, and
the surrounding mangroves grow densely in the intertidal zone. Thus, the method
of selecting the post-image control point uses a fixed parking lot angle that
is close to a right-angle shape and a level that is close to a horizontal. The
obvious landmarks at the intersection of the fixed road are also used as the
image control point. The GeoMax Zenith15 Pro RTK is used to measure the precise
geographic coordinates of the selected image control points, as shown in Figure
3. Seven image control points are collected in this experiment.
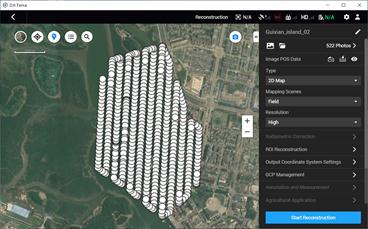
(3) Image
control point import and thorn point processing
|

Figure 3 Photo of in situ survey in Guixian Island
|
In
using Terra 2D reconstruction, photos are added to the project (Figure 4).
Then, image control points are imported, of which five are used as control
points and two are used as check points. After the import is completed, the
image control points will be displayed on the empty three views and in the
image control point list, as shown in Figure 5. Any image control point can be
selected, and an image that contains control point in the photo library can be
clicked. The thorn point view will appear in the left area of the empty three
views, and the blue crosshair indicates the predicted position of the selected
image control point. The mouse position of the yellow front sight can be moved,
and a puncture point can be created by clicking. The green front sight is the
manual marking position. In spike point file export, the export control point
button on the image control point view can be clicked to export the image
control point and splinter point as a json file for each voyage mission
containing the same splinter point image in the Guixian Island study area.
|
|

|
|
Figure 4
Aerial photo loading map of Guixian
Island mangrove research area
|
Figure 5 Image control point import and thorn
point processing view
|
(4) Analytical aerial
triangulation and optimization and 2D reconstruction
After the thorn points
of aerial triangulation are analyzed, the button can be clicked to perform
aerial triangulation optimization solution. After completion, any image control
point can be selected to view the re-projection error and 3D point error after
aerial triangulation optimization. If the 3D point error is large, then the
thorn point can be adjusted and the aerial triangulation optimization can be
performed again until the error result meets the demand. The seven control point re-projection errors and 3D point errors are
shown in the following table.
(5)
Orthophoto processing
The results of the visible orthophoto of the Guixian Island
study area are obtained for ROI cropping, and the vector boundary is saved for
each subsequent orthophoto cropping and DEM cropping of the study area. The
CART method in ENVI5.3 software is used to classify and interpret the cropped
data. The results of the landscape pattern map of the study area are obtained
by combining the unsupervised classification ISO data, VDVI index, texture features
of mangrove communities, and original orthophotos with band synthesis and layer
stacking.
3.3.2
Meteorological Data Processing
|
Table 2 Image control point re-projection
errors and 3D point errors
|
|
Image control point name
|
Re-projection error (px)
|
3D point error (m)
|
|
Control point1
|
0.156
|
0.003
|
|
Control point2
|
0.205
|
0.011
|
|
Control point3
|
0.421
|
0.016
|
|
Control point4
|
0.304
|
0.029
|
|
Control point5
|
0.412
|
0.009
|
|
Control point6
|
0.455
|
0.026
|
|
Control point7
|
0.297
|
0.022
|
Point data (such as precipitation, temperature, and solar
radiation) shared by meteorological sites are input into ArcGIS software.
Software interpolation tools are used to perform Kriging interpolation
processing to obtain the raster data of meteorological elements of monthly
precipitation, monthly temperature, and monthly solar radiation in the study
area with spatial resolution. The projection is consistent with the NPP data.
3.3.3 Model Parameter Estimation
The CASA model parameter estimation is mainly calculated by
inputting the pre-processed UAV image landscape classification data, VDVI vegetation
index raster data, and meteorological raster data (such as precipitation,
temperature, and solar radiation) and the study area DEM data into the model
formula. The technical route is shown in Figure 6.
|
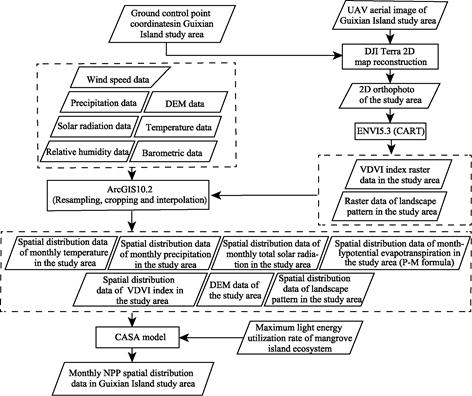
Figure 6 Flow chart of dataset development
|
4 Data Results
and Validation
4.1
Dataset Composition
The dataset include (1) the landscape
map of Guixian Island mangrove ecosystem study area in Beibu Gulf in 2018
(.jpg); and (2) the vegetation landscape type, VDVI vegetation index, seasonal
scale, and annual NPP data of vegetation in the Guixian Island mangrove ecosystem
study area in Beibu Gulf in 2018 (.shp). In the corresponding attribute table,
the field FID is an automatically generated field in generating the attribute
table to ensure the continuity of the element number. The field ??Shape??
indicates that the vector data type is point type ??Point??. The field VDVI indicates
the visible light waveband difference vegetation corresponding to the current
point Index VDVI value. The fields NPP_Spring, NPP_Summer, NPP_Autumn,
NPP_Winter, and NPP_Year represent the current point of spring, summer, autumn,
and winter season scale and annual vegetation NPP. The field Landscapes represents
the vegetation landscape type of the current point, and its value is an integer
in the range of [1,10], which correspond to Aegiceras
corniculatum, Avicennia marina, Kandelia obvolata, mudflat, water body,
construction land, road, grassland, shrub, and woodland in the vegetation
landscape types. The dataset consists of nine data files, which are placed in
the first level folder of NPP_BeibuGulfMangrove_2018 through two second-level
folders.
4.2
Data Results
With the increases in solar radiation, temperature, and
precipitation in the Beibu Gulf in summer, Table 3 shows that the total NPP
season in the Guixian Island study area reaches the highest value of 23,034,806.48
gC??m−2 in summer. This value is an increase of 203.67% compared with
the total NPP season in spring. With the weakening of solar radiation, temperature
reduction, and precipitation reduction from summer to autumn and from autumn to
winter, the total amount of the autumn NPP decreases by 39.06% and the winter
NPP decreases by 75.16% from the previous season. The total amount of NPP in
the winter reaches the lowest value of 3,487,854.52 gC??m−2.
Table 3 Statistics of NPP seasonal characteristic
values of mangrove ecosystem in Guixian Island in 2018
|
No.
|
Season
|
Seasonal minimum NPP (gC??m‒2??a‒1)
|
Seasonal maximum NPP (gC??m‒2??a‒1)
|
Seasonal average NPP (gC??m‒2??a‒1)
|
Seasonal total NPP (gC??m‒2??a‒1)
|
Percentage increase from last quarter (%)
|
|
1
|
spring
|
0
|
241.05
|
62.98
|
7,585,396.78
|
‒
|
|
2
|
summer
|
0
|
647.97
|
191.26
|
23,034,806.48
|
203.67
|
|
3
|
autumn
|
0
|
452.26
|
116.56
|
14,038,513.68
|
‒39.06
|
|
4
|
winter
|
0
|
110.68
|
28.96
|
3,487,854.52
|
‒75.16
|
The
seasonal increase of NPP in the three stages of spring?Csummer, summer?Cautumn, autumn?Cwinter
in 2018 is visualized to study the seasonal changes of NPP more intuitively.
As shown in Figure 7, the NPP increment in the study area from spring to summer
is positive, and the range is [0, 527.62]. From summer to autumn, the NPP increment
in the study area is negative, and the range is [−443.49, 0]. From autumn to
winter, the NPP increment in the study area is negative, and some vegetation
types are accompanied by weak positive growth (the mangrove community is
queried by the table), and the range is [−312.04, 19.18]. As shown in Figure 7,
the area with the most dramatic seasonal NPP changes is the mangrove community
between Guixian Island and Beifengdun relative to the vegetation community
above the island. This community is divided into three sub-communities by small
tidal trenches. On the whole, the NPP increments of the mangrove communities
between the island piers are stronger in the west and weaker in the east. Its
community habitat shows that there is a large tidal trench in the west side
near the sea, and there is a large tidal trench in the east side near the shore.
It is indicated that more suitable salinity conditions for mangrove growth is
in the west side.
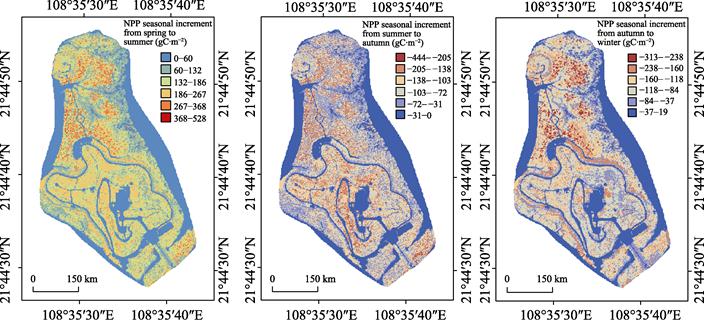
Figure 7 NPP seasonal increment map of mangrove
ecosystem in Guixian Island in the three stages of spring-summer, summer-autumn,
autumn-winter in 2018
The estimation of vegetation NPP is
affected by vegetation type, solar radiation, temperature, and precipitation.
To determine the correlation between NPP and temperature and precipitation in
the mangrove ecosystem of Guixian Island, the data of NPP, precipitation, and temperature in this area in December 2018 are
statistically analyzed. As shown in Table 4, January is an extremely cold month
and also the month with the lowest precipitation. It
|
Table
4 Monthly NPP, precipitation and
temperature data of Guixian Island
mangrove research area in 2018
|
|
Month
|
NPP (gC??m‒2)
|
Precipitation (mm)
|
Temperature (??C )
|
|
1
|
6.83
|
21.9
|
15.47
|
|
2
|
8.26
|
27.92
|
17.82
|
|
3
|
10.54
|
32.51
|
20.08
|
|
4
|
18.69
|
53.06
|
23.74
|
|
5
|
33.8
|
148.24
|
28.29
|
|
6
|
41.32
|
226.88
|
29.34
|
|
7
|
64.4
|
748.3
|
28.15
|
|
8
|
85.69
|
211.43
|
28.67
|
|
9
|
45.04
|
236.7
|
27.45
|
|
10
|
39.75
|
70.36
|
25.05
|
|
11
|
31.88
|
272.98
|
22.59
|
|
12
|
13.89
|
130.98
|
15.92
|
reaches the annual lowest temperature of 15.47 ??C and has the
lowest precipitation of 21.9 mm and the lowest NPP value of 6.83 gC??m−2. June is an extremely hot month and has an
annual maximum temperature of 29.34 ??C. July is the month with
the highest precipitation that reaches 748.3 mm.
Correlation and
regression analyses of the data in Table 4 indicate that the correlation coefficient
between NPP and temperature is 0.81, the correlation coefficient between NPP
and precipitation is 0.64, the P
value of NPP and temperature is 0.001,5, and the P value of NPP and precipitation is 0.026,5. As observed, NPP and
temperature have a very significant positive correlation. A generally significant
positive correlation exists between NPP and precipitation. Therefore, in the
NPP changes of the Guixian Island mangrove ecosystem, the influence of
temperature on NPP is stronger than that of precipitation.
From the regional scale of the mangrove island ecosystem in Qinzhou Bay, this
conclusion further verifies the research viewpoints in literature [19] and [20]
that temperature is the main controlling factor of vegetation NPP in the
coastal area of Beibu Gulf.
The
monthly NPP values in January (very cold month and month with the lowest precipitation),
June (extremely hot month), and July (the month with the highest precipitation)
are visualized into a map in Figure 8. The figure shows that the highest NPP
value of the entire Guixian Island mangrove ecosystem appears in the mangrove
area between the islands regardless of the month with the lowest or highest
temperature and the month with the lowest or precipitation.
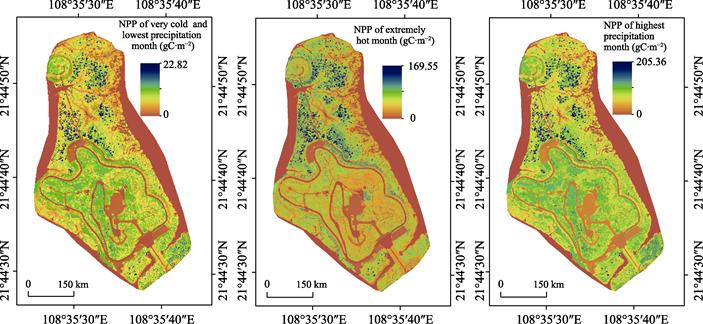
Figure 8 Comparison of NPP between extreme
temperature month and extreme precipitation month in Guixian Island in 2018
5 Discussion and Conclusion
This dataset is based on UAV remote sensing RGB data and related
meteorological data (such as solar radiation, temperature, and precipitation).
The NPP of mangrove communities and their spatial distribution are estimated by
introducing the substitution vegetation index VDVI parameter into the CASA
model formula. Obvious spatial differences in vegetation NPP are observed in
the study area during the four seasons. The seasonal increase percentages of
NPP in the three stages of spring to summer, summer to autumn, and autumn to
winter are 203.67%, −39.06%, and −75.16%, respectively. Statistics of the NPP,
precipitation, and temperature data of the study area in the 12 months of 2018
show that NPP has a very significant positive correlation with temperature and
has a generally significant positive correlation with precipitation. In
conclusion, in the NPP changes of Guixian Island mangrove ecosystem, the
influence of temperature on NPP is stronger than that of precipitation.
Subsequent research will consider the use of drones equipped with
multi-spectral cameras in the same area to obtain NDVI index information. The
accuracy of VDVI alternative parameters will also be evaluated through
comparative studies.
Author Contributions
Tao, J. and Tian, Y. C. designed the study.
Tao, J., Zhang, Q., and Zhang, Y. L. contributed to the data processing and
analysis. Tian, Y. C., and Zhou, G. Q. designed algorithm. Han, X. finished the
data validation. Tao, J. wrote the data paper.
References
[1] Jiang, L. Z., Yang, D. Y., Mei, L. Y., et al. Remote sensing estimation of carbon storage of mangrove communities
in Shenzhen city [J]. Wetland Science,
2015, 13(3): 338‒343.
[2] Peng, C. J., Qian, J. W., Guo, X. D., et al. Vegetation carbon stocks and net primary productivity of the
mangrove forests in Shenzhen, China [J]. Chinese
Journal of Applied Ecology, 2016, 27(7): 2059‒2065.
[3] Zhang, L., Guo, Z. H., Li, Z. Y. Carbon storage and carbon sink of
mangrove wetland: research progress [J]. Chinese
Journal of Applied Ecology, 2013, 24(4): 1153‒1159.
[4] Alongi, D. M. Carbon cycling and storage in mangrove forests [J]. Annual Review of Marine Science, 2014, 6(1):
195-219.
[5] Doughty, C. L., Langley, J. A., Walker, W. S., et al. Mangrove range expansion rapidly increases coastal wetland
carbon storage [J]. Estuaries and Coasts,
2016, 39(2): 385‒396.
[6] Hua, L., Li, W. Y., Xu, B. Monitoring mangrove forest change in
China from 1990 to 2015 using Landsat-derived spectral-temporal variability
metrics [J]. International Journal of
Applied Earth Observation and Geoinformation, 2018, 73(1): 88‒98.
[7] Zhu, W. Q., Pan, Y. Z., Zhang, J. S. Estimation of net primary
productivity of Chinese terrestrial vegetation based on remote sensing [J]. Chinese Journal of Plant Ecology, 2007,
31(3): 413‒424.
[8] Bolinder, M. A., Janzen, H. H., Gregorich, E. G., et al. An approach for estimating net
primary productivity and annual carbon inputs to soil for common agricultural
crops in Canada [J]. Agriculture,
Ecosystems and Environment, 2007, 118: 29?C42.
[9] Piao, S. L., Fang, J. Y., Guo, Q. H. Terrestrial net primary
production and iIts spatio-temporal patterns in China during 1982?C1999 [J]. Acta Scientiarum Naturalium Universitatis
Pekinensis, 2001(4): 563‒569.
[10] Piao, S. L., Fang, J. Y., Guo, Q. H. Application of CASA model to
the estimation of Chinese terrestrial net primary productivity [J]. Chinese Journal of Plant Ecology, 2001(5):
603‒608, 644.
[11]
Zhang,
F., Zhou, G. S., Wang, Y. H. Dynamics simulation of net primary productivity by
a satellite data driven CASA model in inner Mongolia typical steppe, China [J].
Chinese Journal of Plant Ecology, 2008(4):
786‒797.
[12] Tian, Y., C., Huang, Y. L., Zhang, Q., et al. Spatiotemporal distribution of net primary productivity and
its driving factors in the Nanliu River basin in the Beibu Gulf [J]. Acta Ecologica Sinica, 2019(21):
8156‒8171.
[13]
Schaefer, K., Collatz, G. J.,
Tans, P., et al. Combined simple Biosphere/Carnegie-Ames-Stanford approach
terrestrial carbon cycle model [J]. Journal
of Geophysical Research, 2008, 113: G03034.
[14]
Cao, S., Sanchez-Azofeifa, G. A.,
Duran, S. M., et al. Estimation of
aboveground net primary productivity in secondary tropical dry forests using
the Carnegie?CAmes?CStanford approach (CASA) model [J]. Environmental Research Letters, 2016, 11: 075004.
[15] Donmez, C., Berberoglu, S., Curran, P. J. Modelling the current and
future spatial distribution of NPP in a Mediterranean watershed [J]. International Journal of Applied Earth
Observation and Geoinformation, 2011,
13: 336?C345.
[16] Tao, J., Tian, Y. C., Zhang, Q., et
al. Net primary productivity dataset of mangrove ecosystem in Guixian
Island, Beibu Gulf (2018) [J/DB/OL]. Digital
Journal of Global Change Data Repository, 2020. https://doi.org/10.3974/geodb.2020.06.21.V1.
[17] GCdataPR Editorial Office. GCdataPR data sharing policy [OL].
https://doi.org/10.3974/dp.policy.2014.05 (Updated 2017).
[18]
Tian,
Y., C., Huang, Y. L., Tao, J., et al.
Estimation of net primary productivity of typical mangrove and archipelago ecosystems
in the Beibu Gulf based on unmanned aerial vehicle imagery [J]. Tropical Geography, 2019(4): 583‒596.
[19] Tian, Y., C., Liang, M. Z., The NDVI characteristics of vegetation
and its ten-day response to temperature and precipitation in Beibu Gulf coastal
region [J]. Journal of Natural Resources,
2016(3): 488‒502.
[20] Tian, Y., C., Huang, Y. L., Zhang, Q., et al. Spatiotemporal distribution of net primary productivity and
its driving factors in the Nanliu River basin in the Beibu Gulf [J]. Acta Ecologica Sinica, 2019, 21:
8156‒8171.