Housing Price Quarterly Change Dataset in Nanjing Townhouse (Apartment, Resident Community) Level (2009-2017)
Yin, S. G.1,2 Ma, Z. F.1,2 Song, W. X.3*
1. School of Geography Science, Nanjing Normal University, Nanjing 210023, China;
2. Jiangsu Center of Collaborative Innovation in Geographical Information Resource Development and Application, Nanjing 210023, China;
3. Key Laboratory of Watershed Geographic Sciences, Nanjing Institute of Geography and Limnology, Chinese Academy of Sciences, Nanjing 210008, China
Abstract: A spatial dataset for house price changes in Nanjing (2009-2017) was compiled based on the dataset for 4,560 residential areas in Nanjing from the 1st quarter of 2009 to the 1st quarter of 2017. This dataset includes: (1) Nanjing city boundary data; (2) House price data for each quarter during 2009-2017 for 4,560 residential areas of Nanjing (including basic information on residential area, average sale price per unit area and number of houses sold in each quarter, and average monthly rent per unit area in each quarter). The dataset indicated spatial pattern, as well as the house prices in Nanjing. This dataset was archived in .xls and .shp formats in 8 data files with the data size of 4.53 MB (1.37 MB after compression).
Keywords: residential area; house price; quarter; Nanjing city
1 Introduction
In the 1980s, China began to test a new housing policy and expanded house commercialization. Since the 21st century, the variation of many factors, such as liberal internationalism, financial capitalism, domestic market transition, uneven urbanization, high levels of lending, and over-relying of local economy on land financing, has been pushing house prices in large cities to an ever higher level. Meanwhile, in the process of urban renewal and expansion, inharmonious spatial restructuring and resource allocation have emerged, leading to more significant spatio-temporal heterogeneity of house prices. However, new factors such as school districts, subways, landscape, hospitals, and technology have created a complicated house price differentiation mechanism. In recent years, house price differences and the influencing factors in urban areas have received more attention in the field of urban geography globally[1–6]. From the perspective of urban social geography, the significance of the research on housing prices is more reflected by the dialectical relationship between housing prices and the reconstruction of urban social space. For instance, the type and grade of urban housing is closely related to the economic and social attributes of residential group[7–8], and the distribution of house prices represents the social space; the spatial variation of house prices is not only the structural representation and market reaction of variation in urban social space but also an important driving mechanism of social space re-differentiation; the factors and functional mechanisms influencing spatial differentiation of urban house prices can partially if not perfectly explain the process and results of urban residential space differentiations.
As an important central city in East China, Nanjing has developed its real estate market in recent years and its house prices have significantly increased. The average house price increased from 8,634 Yuan/m2 to 25,454 Yuan/m2 from 2009 to 2017, with an average annual growth percentage of 14.47%. It’s spatial and temporal heterogeneity of house prices is quite typical compared with other large cities in China. Thus, studying the spatial heterogeneity of house prices in large cities can provide effective data to support the research on residential differentiation in urban areas. Through analyzing the characteristics of house price evolution, our dataset is able to provide a new perspective for research on urban social space problems and provide a reference for regional house price control and decision-making of urban planning by governments.
2 Metadata of Dataset
Table 1 is the metadata for the housing price quarterly change dataset in Nanjing townhouse (apartment, resident community) level (2009-2017)[9].
3 Method
3.1 Data Source
House price, house rent, and the attribute data of residential area (including the year of build, greening rate, and plot ratio) were from the China House Price Market Platform (http://www.cityre.cn/). This’s an integrated service platform for nationwide real estate information in China and is organized by the China Real Estate Industry Association. Its data sources include client-provided information, system integration with housing agencies and sales offices, data released from 50 million users and collected from tens of thousands of real estate websites. We reorganized the data and removed duplicates and outliers, and then conducted a manual verification process to obtain comprehensive, updated, and objective real estate market supply data.
3.2 Data Processing
Since residential areas in Nanjing are mainly located according to a “one main city and three sub-cities” pattern (Nanjing Urban Master Plan (2011-2020)), we selected “one main city and three sub-cities” of Nanjing as the research area, which including the district of Xuanwu, Gulou, Qinhuai, Jianye, Yuhuatai, Jiangning, Qixia, Pukou, and Liuhe.
Table 1 Metedata summary of housing price quarterly change dataset in Nanjing townhouse (apartment, resident community) level (2009-2017)
|
Items
|
Description
|
|
Dataset full name
|
Housing price quarterly change dataset in Nanjing townhouse (apartment, resident community) level (2009-2017)
|
|
Dataset short name
|
HousePriceNanjing_2009-2017
|
|
Authors
|
Yin, S. G. N-1072-2018, School of Geography Science, Nanjing National University, yinshang gang@163.com
|
|
Ma, Z. F. N-1177-2018, School of Geography Science, Nanjing National University, ug_mazhi fei@163.com
|
|
Song, W. X. N-1173-2018, Nanjing Institute of Geography and Limnology, Chinese Academy of Sciences, wxsong@niglas.ac.cn
|
|
Geographic region
|
Nanjing city (31°13'54"N-32°36'59"N, 118°21'27"E-119°14'07"E)
|
|
Year
|
2009-2017
|
Temporal resolution
|
Quarterly
|
|
Spatial resolution
|
500 m
|
Data format
|
.shp and .xls
|
|
Data file number
|
8 (compressed to 1)
|
|
|
|
Data size
|
4.53 MB (1.37 MB after compression)
|
|
Dataset composition
|
1. Administrative boundaries of Nanjing city (.shp file)
2. House price dataset for Nanjing urban residential areas (.xls file)
|
|
Foundation items
|
National Natural Science Foundation of China (41671155, 41771184)
|
|
Publisher
|
Global Change Research Data Publishing & Repository, http://www.geodoi.ac.cn
|
|
Address
|
No. 11A, Datun Road, Chaoyang District, Beijing 100101, China
|
|
Data sharing policy
|
Data from the Global Change Research Data Publishing & Repository includes metadata, datasets (data products), and publications (in this case, in the Journal of Global Change Data & Discovery). Data sharing policy includes: (1) Data are openly available and can be free downloaded via the Internet; (2) End users are encouraged to use Data subject to citation; (3) Users, who are by definition also value-added service providers, are welcome to redistribute Data subject to written permission from the GCdataPR Editorial Office and the issuance of a Data redistribution license; and (4) If Data are used to compile new datasets, the ‘ten percent principal’ should be followed such that Data records utilized should not surpass 10% of the new dataset contents, while sources should be clearly noted in suitable places in the new dataset[10]
|
Owing to the compact distribution of the old residential areas and the luxury gated communities in the main city, and mixed distribution of urban villages, temporary dwellings, and newly constructed apartment communities on the outskirts of the city, suburban economic housing communities may be located close to the luxury villa district, which causes fragmentation and discontinuity of inner-urban house prices and is represented as “spatial heterogeneity”, which is more common in the western world[11–12]. Due to the significant spatial heterogeneity and discontinuity of house prices in Nanjing, we tried to show original house prices and avoid using spatial interpolation technology to estimate and possibly inflate prices; thus, we utilized Fishnet in ArcGIS to analyze the spatial patterns of commercial residential building prices in the main city of Nanjing. The steps were as follows: (1) Determining the evaluation unit. Based on inner-urban social space characteristics, previous research[13], and earlier test, we set the urban house price evaluation unit as 500 m×500 m, and divided Nanjing main city into such evaluation units using the Fishnet tool in ArcGIS10.2; (2) Spatial data processing for evaluation indicators. By utilizing the Spatial Join tool in ArcGIS10.2, we matched the mean house price value of residential areas in each grid to their corresponding grid attribute value.
4 Results
The spatial dataset of house price changes in Nanjing (2009-2017) including two parts: (1) Administrative boundaries of Nanjing (.shp file); (2) House price dataset of Nanjing urban residential areas (.xls file). Table 1 shows statistical information for house prices in Nanjing districts. In 2009, the inner city was the highest area and Jiangbei sub-city was the lowest area. The house prices in Hexi new city were higher than inner city and became the most expensive district in 2007. Only the house prices in inner city and Hexi new city were higher than the average house price across the whole city. House prices in outlying areas of the main city, Xianlin sub-city, and Dongshan sub-city were close to the average house price.
Table 2 Basic distribution characteristics of residential areas in Nanjing city
|
District
|
Sample size
|
Sample percentage (%)
|
Average house price (Yuan/m2)
|
|
2009
|
2017
|
2009
|
2017
|
2009
|
2017
|
|
Inner city
|
151
|
689
|
21.06
|
23.57
|
10,962
|
31,293
|
|
Hexi new city
|
184
|
492
|
25.66
|
16.83
|
10,384
|
36,012
|
|
Main city outlying areas
|
198
|
766
|
27.62
|
26.21
|
8,303
|
26,400
|
|
Jiangbei sub-city
|
64
|
463
|
8.93
|
15.84
|
4,301
|
16,592
|
|
Xianlin sub-city
|
24
|
167
|
3.35
|
5.71
|
7,124
|
25,227
|
|
Dongshan sub-city
|
96
|
346
|
13.39
|
11.84
|
6,203
|
24,651
|
|
Total
|
717
|
2,923
|
100
|
100
|
8,719
|
27,344
|
Figure 1 shows the trend of house price fluctuations for all regions of Nanjing during 2009-2017. House prices in each region showed an increasing trend, which can be separated into five phases: fast increase during the 1st quarter of 2009 to the 2nd quarter of 2011; relatively stable during the 2nd quarter of 2011 to the 4th quarter of 2012; fast increase during the 4th quarter of 2012 to the 2nd quarter of 2014; relatively stable during the 2nd quarter of 2014 to the 4th quarter of 2015; and a significant increase during the 4th quarter of 2015 to the 1st quarter of 2017. The data showed an alternating state of “rapid grows” and “relatively stable”. Figure 2 shows the 500 m×500 m grid chart for house prices in all districts of Nanjing. In 2009, house prices decreased from the inner city to Hexi new city, outlying areas of the main city, and the three sub-cities, with an average price of 10,000 Yuan/m2. Jiangbei sub-city had the lowest the average price, less than 5,000 Yuan/m2. By 2017, average house prices had increased to 27,344 Yuan/m2, with a greater difference between the highest and lowest prices. Hexi new city and the inner city school districts became the extremely high house prices area, which reached 50,000-60,000 Yuan/m2. However, houses with an average price lower than 20,000 Yuan/m2 were only found in remote areas such as Liuhe district of Jiangbei Sub-city.
5 Discussion and Conclusion
This dataset focused on the spatial heterogeneity and variation characteristics of house prices in a large city. Based on the effects of house prices on urban social spaces, future research should explore the spatial heterogeneity of living spaces in large cities by adding population spatial heterogeneity and further analyze urban social space structures, providing solutions for the problems such as shortage of housing, residential segregation, and housing within school districts, etc.
|
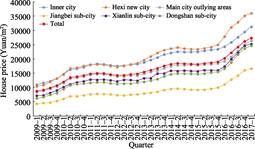
Figure 1 Trend of house price fluctuations for
all regions in Nanjing city in 2009-2017
|
|

Figure 2 Spatial distribution pattern of house prices in Nanjing city in 2009 (left) and 2017 (right)[14]
|
Author contributions
Song, W. X. conducted the general design for the development of dataset. Yin, S. G. and Ma, Z. F. designed the model and algorithm, collected and processed house price data, Yin, S. G. wrote the data paper.
References
[1] Tse, R. Y. C. Estimating neighborhood effects in house prices: towards a new hedonic model approach [J]. Urban Studies, 2002, 39(7): 1165-1180.
[2] Stevenson, S. New empirical evidence on heteroscedasticity in hedonic housing mode [J]. Journal of Housing Economics, 2004, 13(2): 136-153.
[3] Wen, H. Z., Li, X. N., Zhang, L. Impacts of the urban landscape on the housing price: a case study in Hangzhou [J]. Geographical Research, 2012, 31(10): 1806-1814.
[4] Mathur, S. Impact of urban growth boundary on housing and land prices: evidence from King county, Washington [J]. Housing Studies, 2014, 29(1): 128-148.
[5] Wang, S. J., Wang, Y., Lin, X. Q., et al. Spatial differentiation patterns and influencing mechanism of housing prices in China: based on data of 2872 counties [J]. Acta Geographica Sinica, 2016, 71(8): 1329-1342.
[6] Yin, S. G., Song, W. X., Ma, Z. F, et al. Spatial differentiation and influencing factors analysis of housing prices in Nanjing: based on geographically weighted regression model [J]. Human Geography, 2018, 33(3): 68-77.
[7] Wang, Y., Li, Q., Wang, S. J., et al. Determinants and dynamics of spatial differentiation of housing price in Yangzhou [J]. Progress in Geography, 2014, 33(3): 375-388.
[8] Wu, Q. Y. Study on the Residential Difference in Big Cities: Theory and Empirical Analysis (Second Edition) [M]. Beijing: Science Press, 2016.
[9] Song, W. X., Yin S. G. Housing price quarterly change dataset in Nanjing townhouse (apartment, resident community) level (2009-2017) [DB/OL]. Global Change Research Data Publishing & Repository, 2018. DOI: 10.3974/geodb.2018.04.08.V1.
[10] GCdataPR Editorial Office. GCdataPR data sharing policy [OL]. DOI: 10.3974/dp.policy.2014.05 (Updated 2017).
[11] Song, W. X., Wu, Q. Y. Gentrification and residential differentiation in Nanjing, China [J]. Chinese Geographical Science, 2010, 20(6): 568-576.
[12] Song, W. X., Mao, N., Chen, P. Y., et al. Coupling mechanism and spatial-temporal pattern of residential differentiation from the perspective of housing prices: a case study of Nanjing [J]. Acta Geographica Sinica, 2017, 72(4): 589-602.
[13] Dong, N., Yang, X. H., Cai, H. Y., et al. Suitability evaluation of gridded population distribution: a case study in rural area of Xuanzhou district, China [J]. Acta Geographica Sinica, 2017, 72(12): 2301-2324.
[14] Song, W. X., Chen, P. Y., Chen, H., et al. Spatial-temporal pattern and differentiation mechanism of price-to-rent ratio of Nanjing [J]. Scientia Geographica Sinica, 2018 (In Press).