10-Year NDVI Dataset Development in 361 Cities of China (250-m,
1990?C2020)
Liu, H. M.1 Zhou, T. Y.2* Gou, P.2
1.
Institute of Geographic Sciences and Natural Resources Research, Chinese
Academy of Sciences, Beijing 100101, China;
2. Research
Centra of Big Data Technology, Nanhu Laboratory, Jiaxing 314002, China
Abstract:
Vegetation cover is an important indicator used to
measure the quality of the ecological environment and human settlements.
However, there is still a lack of long-term NDVI datasets within urban areas.
Based on Terre-MODIS NDVI and GIMMS NDVI product data, we used deep learning
superresolution algorithms to produce 250-m resolution NDVI datasets for China
in 1990, 2000, 2010 and 2020. Then, by superimposing the administrative scope
and urban physical area in various periods, we extracted the average value of
NDVI in different urban boundaries and obtained a statistical dataset of the
average NDVI value of China??s ten years and 361 cities (250-m, 1990?C2020). This dataset indicates an initially decreasing and
subsequently increasing trend of NDVI for both all of China and the urban
physical areas from 1990 to 2020, yet the NDVI trend has significant spatial
heterogeneity. The dataset can support urban ecological and environmental
governance, urban green space planning and construction, ecological and
environmental policy formulation and government performance assessment, as well
as ecosystem evolution research driven by urbanization and climate change. The
dataset is archived in .tif and .xlsx formats with a spatial resolution of 250
m and consists of 5 files with data size of 6.51 GB (compressed into 5 files,
1.83 GB).
Keywords: vegetation cover; urbanization;
NDVI; urban physical area; deep learning, China
DOI: https://doi.org/10.3974/geodp.2023.01.09
CSTR: https://cstr.escience.org.cn/CSTR:20146.14.2023.01.09
Dataset Availability Statement:
The dataset
supporting this paper was published and is accessible through the Digital Journal of
Global Change Data Repository at: https://doi.org/10.3974/geodb.2023.04.06.V1 or
https://cstr.escience.org.cn/CSTR:20146.11.2023.04.06.V1.
1 Introduction
Vegetation represents an essential element of
ecosystems; accordingly, its coverage serves as a key indicator in the
examination of broad-scale environmental shifts, informing assessments
of both ecological conditions and habitation livability[1]. Rapid
urbanization in China has greatly affected vegetation cover[2],
which in turn acts on the urban environment[3], exacerbating the
urban heat island effect[4], adversely influencing air pollutant
dispersion[5], weakening regional carbon sink capacity[6],
and negatively affecting the health and well- being of urban residents[7].
Adequate and equal access to urban green space for all citizens is an important
component of the United Nations 2030 Sustainable Development Goal 11[8].
The normalized differential vegetation
index (NDVI) is one of the primary indicators reflecting changes in vegetation
coverage. GIMMS NDVI and MODIS NDVI product data are the most commonly used
NDVI datasets and have been widely applied at regional and global scales[9,
10]. MODIS data are regarded as a continuation of GIMMS data[11],
but there are large gaps in spatial resolution and different temporal coverage
between them, which limit our proper assessment and understanding of NDVI
changes throughout the urbanization process. The existing NDVI datasets are
mainly raster data or data within city administrative boundaries, with most
time series being after 2000[12, 13], and there is a lack of high-resolution
NDVI datasets with long time series inside of the urban physical area.
This paper
collects Terre-MODIS NDVI and GIMMS NDVI product data for multiple years, takes
the MODIS data with a spatial resolution of 250 m as the benchmark, uses the
deep learning superresolution algorithm to spatially downscale the GIMMS
dataset to extend the temporal coverage of NDVI under high resolution, and
obtains the 250-m resolution NDVI dataset in China for 1990, 2000, 2010 and
2020. Then, this paper examines the Global Urban Boundary (GUB) dataset to
determine the physical geographical space of cities in different periods,
extracts the NDVI values in the urban physical areas, and calculates the average NDVI values within both the administrative
and physical boundaries of 361 cities in China for 1990, 2000, 2010 and 2020.
The dataset can provide basic data support for urban ecological and
environmental governance, urban green space planning and construction,
ecological and environmental policy formulation and government performance
assessment, as well as for research in the field of urbanization and the
ecological environment.
2 Metadata of the Dataset
The metadata of the
NDVI dataset of China and average in 361 cities
(250-m, 1990?C2020) are summarized in Table 1[14].
The metadata include the dataset full name, short name, authors, year of the
dataset, temporal resolution, spatial resolution, data format, data size, data
files, data publisher, and data sharing policy.
3 Methods
3.1 Data Sources
The GIMMS NDVI dataset used in this study
comes from the third generation of NDVI product data provided by the National
Centers for Environmental Information, with a spatial resolution of 1/12 degree
(approximately 8-km) and covering the periods 1989?C1991 and 2000?C2013. The Terre-MODIS
NDVI product data come from the MODIS vegetation index product developed by the
NASA MODIS land science team according to the unified
Table
1 Metadata summary of the NDVI dataset of
China and average in 361 cities (250-m, 1990?C2020)
|
Items
|
Description
|
|
Dataset full name
|
NDVI dataset of
China and average in 361 cities (250-m, 1990?C2020)
|
|
Dataset short
name
|
ChinaCitiesNDVI_1990_2020
|
|
Authors
|
Liu, H. M. R-7364-2018, Institute of Geographic Sciences and
Natural Resources Research, Chinese Academy of Sciences, liuhm@igsnrr.ac.cn
Zhou, T. Y.,
Research Centra of Big Data Technology, Nanhu Laboratory,
zhoutianyu@nanhulab.ac.cn
Gou, P., Research
Centra of Big Data Technology, Nanhu Laboratory, goupeng@nanhulab.ac.cn
|
|
Geographical
region
|
China
|
|
Year
|
1990, 2000, 2010,
2020
|
|
Temporal
resolution
|
Year
|
|
Spatial
resolution
|
250 m
|
|
Data format
|
.tif, .xlsx
|
|
|
|
Data size
|
6.51 GB
|
|
|
|
Data files
|
1990, 2000, 2010,
2020 China 250-m NDVI annual mean value data
1990, 2000, 2010,
2020 annual mean value data of NDVI at the administrative and physical areas
of Chinese cities
|
|
Foundations
|
National Natural
Science Foundation of China (42171210); Ministry of Education of P. R. China
(22JJD790015)
|
|
Data publisher
|
Global Change Research Data Publishing & Repository,
http://www.geodoi.ac.cn
|
|
Address
|
No. 11A, Datun
Road, Chaoyang District, Beijing 100101, China
|
|
Data sharing
policy
|
Data from the Global
Change Research Data Publishing & Repository includes metadata, datasets (in the Digital Journal of Global Change Data Repository), and publications
(in the Journal of Global Change Data & Discovery). Data sharing policy includes: (1) Data are openly
available and can be free downloaded via the Internet; (2) End users are
encouraged to use Data subject to citation; (3) Users, who are by definition
also value-added service providers, are welcome to redistribute Data
subject to written permission from the GCdataPR Editorial Office and the
issuance of a Data redistribution license; and (4) If Data are used to
compile new datasets, the ??ten per cent principal?? should be followed such
that Data records utilized should not surpass 10% of the new
dataset contents, while sources should be clearly noted in suitable places in
the new dataset[15]
|
|
Communication and searchable system
|
DOI, CSTR, Crossref, DCI, CSCD, CNKI,
SciEngine, WDS/ISC, GEOSS
|
algorithm. This
study uses the MOD13Q1 dataset, which is synthesized over 16 days at 250- m
resolution, and the MOD13A2 dataset, which is synthesized over 16 days at 1-km
resolution, both spanning the period 2000?C2020. Furthermore, this paper also selects Landsat 5-year NDVI, Aqua
MODIS NDVI and NOAA CDR AVHRR NDVI datasets as cross-validation data. The urban
administrative division shapefile data in this study come from the National
Geomatics Center of China for 2019. They include all prefecture-level
administrative units in China, as well as counties directly under the central
government in some provinces. The urban physical areas for 1990?C2020 are
derived from the Global Urban Boundary (GUB) dataset[16]. The dataset
combines macroscale kernel density analysis and microscale neighbourhood
expansion algorithms for the morphological treatment of urban outer edge areas,
capturing the boundaries of all cities and neighbouring settlements with an
area of more than 1 km2 globally. The urban physical areas of this
dataset comprise not only impervious surfaces but also other related land
types, such as green areas and water bodies within the city. Figure 1 shows the
changes in the urban boundaries of Beijing in this dataset as an example.
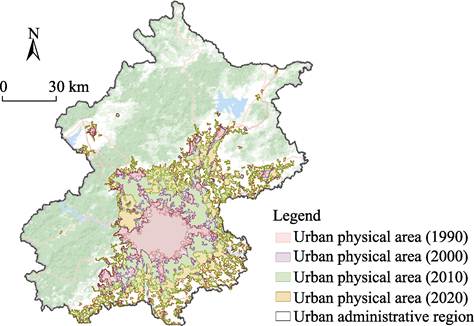
Figure
1 Map of Beijing??s
administrative area and urban physical areas
3.2 Data Preprocessing
The MODIS NDVI data
are regarded as a continuation of the GIMMS NDVI data, and a number of studies
have shown that the results of the two data have a strong consistency under
certain conversion relationships. This paper uses Fensholt??s conversion formula
(Equation 1)[11] to convert the GIMMS NDVI data value domain to be
consistent with the MODIS NDVI. The formula is based on the regression coefficients
derived from the linear regression trend analysis of monthly observations of
GIMMS NDVI and MODIS NDVI for the period 2000?C2010.
Model fitting with regional characteristics was carried out for China, Canada,
and Australia, and the results of its long time series have a certain regional
representativeness[11].
GIMMS
NDVI=1.39??MODIS NDVI?C0.09 (1)
To further verify the applicability of the
conversion formula across China, this paper selected five cities located in
different regions, Wuhan, Chengdu, Kunming, Hangzhou, and Shenyang, to
calculate the root mean square error (RMSE) of 2010 MODIS data after conversion
with GIMMS data to reflect the applicability of the formula in the central,
western, southern, eastern, and northeastern regions of China. The results are
shown in Table 2. The average RMSE between MODIS NDVI and GIMMS NDVI after the
conversion is 0.024, with Wuhan having the highest RMSE at 0.034. Therefore,
this paper concludes that the formula has good applicability within the Chinese
context.
Table
2 The root
mean square error (RMSE) between the converted MODIS NDVI and GIMMS NDVI in
five cities in China
|
City
|
Wuhan
|
Chengdu
|
Kunming
|
Hangzhou
|
Shenyang
|
Average
|
|
RMSE
|
0.034
|
0.019
|
0.033
|
0.029
|
0.006
|
0.024
|
To weaken the potential influence of the
vegetation indices in a single year that may be affected by factors such as
changes in meteorological conditions and extreme meteorological hazards,
although this dataset focuses on four time points (1990, 2000, 2010, 2020),
each time point actually fused 3 years of NDVI data (1989?C1991, 2000?C2002, 2009?C2011
and 2019?C2021) to reduce the influence of external
factors. To generate the Chinese GIMMS NDVI dataset (1990) and MODIS NDVI
dataset (2000, 2010, 2020), the GIMMS NDVI data and MODIS NDVI data (250-m)
were preprocessed through Google Earth Engine (GEE) with subset extraction,
image mosaic, data cropping, pixel fusion, projection conversion, and
calculating the average value of NDVI in each time period to represent the
average state of vegetation growth in the corresponding period. In addition, to
provide training samples for subsequent superresolution models, this study
adopts the same data preprocessing steps on the GEE platform to process the
interannual-scale NDVI data (2000?C2020) for GIMMS NDVI, MODIS NDVI (1-km) and
MODIS NDVI (250-m).
3.3 Image Superresolution Deep Learning Algorithm
This study is based on local-global combined networks (LGC-Net), an
image superresolution deep learning algorithm[17]
proposed by Lei, to perform second-order superresolution image reconstruction
on the GIMMS NDVI dataset using 1-km and 250-m MODSI NDVI datasets. This method
enables GIMMS NDVI to be resampled to a higher spatial resolution without
losing the original vegetation index features. In the first stage, we trained
GIMMS NDVI (2000?C2010) with 1-km MODIS NDVI data
(2000?C2010) to develop the 8-km to 1-km superresolution model training
procedure and then reconstructed GIMMS NDVI data at 1-km resolution. In the
second stage, the reconstructed 1-km GIMMS NDVI images are trained with 250-m
MODIS NDVI data to complete the 1-km to 250-m superresolution model training
procedure. Then, we compare the generated results with the original GIMMS NDVI
results for errors to further optimize the accuracy of the superresolution
model. Finally, the 1990 GIMMS NDVI data with completed data preprocessing were
input into this second-order superresolution model to reconstruct the 1990
GIMMS NDVI data at 250-m resolution. The algorithm principle of LGC-Net is
shown in Figure 2. (1) To obtain the representation of the main features of the
different layers using multilayer convolution. (2) In the local-global
information combination part, a multifork structure is realized by cascading
the results of different layers. (3) Finally, a higher resolution
reconstruction of the image is performed in the reconstruction section.
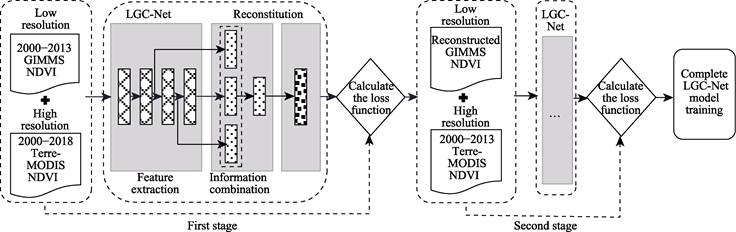
Figure
2 Flowchart of
LGC-Net image superresolution deep learning algorithm
3.4 Methods
The main
development process of this dataset is shown in Figure 3. First, following the
steps of data preprocessing in the previous section, we preprocessed the data
for the 2000?C2013 GIMMS NDVI dataset and the 2000?C2013
Terre-MODIS dataset (1-km and 250-m, respectively) and input these data as
training sets into the LGC-Net deep learning model for training to obtain the
image superresolution model. Then, we input the preprocessed low-resolution
1990 GIMMS NDVI dataset into the model and perform two-stage image
reconstruction to produce the reconstructed 250-m resolution GIMMS NDVI
dataset. We collated, aligned and unified coordinate projections of the
reconstructed GIMMS and MODIS NDVI datasets and performed data accuracy
validation to generate 250-m NDVI datasets for all of China in 1990, 2000,
2010, and 2020. Finally, we spatially overlaid the national prefecture-level
administrative region and the national GUB shapefile data with the NDVI dataset
to crop and extract all the pixel points within urban administrative and
physical areas and calculated their NDVI mean values to obtain the urban 250-m
resolution vegetation cover dataset in China (1990?C2020).
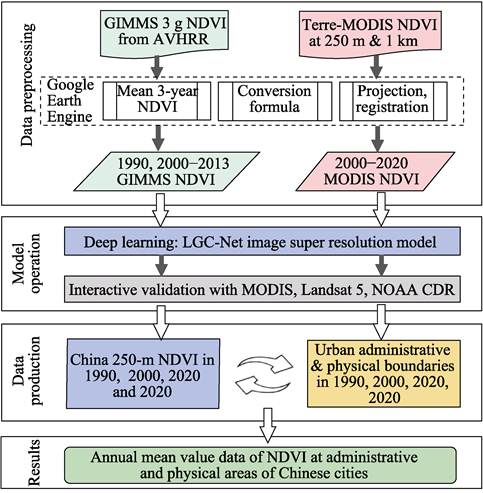
Figure
3 Methodology
flowchart of dataset develpoment
4 Data Results and Validation
4.1 Data Composition
The composition,
data size, data format and nomenclature of the NDVI dataset of China and the
average in 361 cities (250-m, 1990?C2020) are shown in Table 3,
which mainly includes 4 raster data and 2 statistical table data.
4.2 Data Results
4.2.1 Spatial and Temporal Variation in
NDVI in China from 1990 to 2020
Figure 4 shows the distribution of NDVI in
China at 250-m resolution from 1990 to 2020. Excluding the impact of water
bodies, the average values of the China-wide NDVI in 1990, 2000, 2010 and 2020
are 0.316, 0.299, 0.287 and 0.297, respectively, showing a trend of first
decreasing and then increasing. In other words, the overall national greenness
of China showed a falling tendency from 1990 to 2010, but it had improved
significantly in the last 10 years.
Table 3 Data list of the NDVI Dataset of China
and Average in 361 Cities (250-m, 1990?C2020)

Figure
4 Maps of Spatial
and temporal patterns of NDVI in China during 1990?C2020
From the
perspective of the spatial pattern, the spatial distribution pattern of the
vegetation index in China was relatively stable from 1990 to 2020. Due to
natural geographical conditions and climatic factors, the NDVI values generally
show a progressive decline from the southeast coast to the northwest inland
areas. High value areas (NDVI>0.6) are mainly distributed in the hilly and
coastal areas of southeastern China, as well as on the Yunnan-Guizhou Plateau
in the south. Median value areas (0.6>NDVI>0.3) are mainly found in the
North China Plain in eastern China, the Sichuan Basin in the west, and parts of
northeast China. Low value areas (NDVI<0.3) are mainly distributed in the
Qinghai-Tibet Plateau and Tarim Basin in the west and the Inner Mongolia
Plateau in the north. Comparing Figure 4a and Figure 4d, it can be found that
from 1990 to 2020, the vegetation greenness is generally enhanced in most of
the southern regions and the Loess Plateau area, while the vegetation greenness
decreases significantly in the densely populated urban areas, including the
Yangtze River Delta, Beijing-Tianjin-Hebei, Pearl River Delta, and Shandong
Peninsula urban agglomeration. Other areas with obvious reductions in
vegetation greenness are mainly distributed in the western regions.
4.2.2 Spatiotemporal Changes in NDVI within the Urban Administrative and
Physical Areas from 1990 to 2020
Figure 5
illustrates the spatial and temporal changes in NDVI within the urban
administrative and physical areas for 361 cities in China from 1990 to 2020.
The spatiotemporal distribution and trends of NDVI within the administrative areas
are generally consistent with the raster scale features discussed above,
although NDVI inside urban physical areas does not entirely match the raster
scale pattern. For example, in the Yangtze River Delta, the Pearl River Delta,
and several cities in the middle reaches of the Yangtze River urban
agglomeration, while the average NDVI value in the administrative area is
relatively high, the NDVI value in the urban physical area is comparatively
low; in Xinjiang, Hotan and Kunyu have relatively low NDVI values within the
administrative area, but the urban physical entity-wide NDVI values are fairly
high. With the exception of some oasis-type cities in the northwest, the NDVI
values of the urban administrative areas are higher than those of the urban
physical areas. The national urban physical wide NDVI average values in 1990,
2000, 2010 and 2020 are 0.321, 0.278, 0.264 and 0.290, respectively, indicating
a considerable rise in urban greenness across the country in the last decade.

Figure 5 Maps of Spatial and temporal changes in
NDVI in the urban administrative and physical areas during 1990?C2020
4.3 Data
Validation
Since NDVI values
lack direct evidence from ground station monitoring, we unified data from
various NDVI products into the same spatial resolution and projection
coordinate system. We then examined the correlation between this dataset and
other data products generated by deep learning models to verify the spatial and
temporal reliability of this dataset. In this paper, we take Beijing as the validation
area, with a size of approximately 16,392.99 km2, corresponding to
343,967 pixels at 250-m resolution. The 250-m NDVI dataset (2010) generated in
this study was pixel-by-pixel compared with three data products, Aqua-MODIS
NDVI, Landsat 5 NDVI, and NOAA NDVI, and the correlation coefficient, R2, and root mean square
error (RMSE) were calculated. From the results in Figure 6, the 250-m NDVI data
results have a strong correlation with other NDVI product data, and the
correlation coefficients are 0.991,4, 0.842,5, and 0.790,3, respectively.
Overall, the accuracy of the 250-m NDVI dataset produced in this paper is
positive, and the data results have an acceptable level of reliability.

Figure 6 Cross-validation results of model-fitted
NDVI with other NDVI product data: (a) Aqua-MODIS, (b) NDVI Landsat 5 NDVI, and
(c) NOAA NDVI
5 Discussion and Conclusion
In this research,
we produced a 250-m resolution NDVI dataset for Chinese cities from 1990 to
2020 based on long time series GIMMS NDVI data and medium-high spatial and
temporal resolution Terre/MODIS NDVI data, combined with the GUB urban boundary
dataset, used the Google Earth Engine platform and Python, and adopted an image
superresolution algorithm and cross-validation method. Compared with the existing
NDVI product data, this dataset extends the observation time of the original
medium- and high-resolution NDVI from 20 years to 30 years and calculates the
NDVI at the urban physical entity area by overlaying the urban entity boundary
data. The reason why we choose the annual mean value of NDVI rather than the
annual maximum value of NDVI is that the annual mean value can better reflect
the annual contribution of vegetation to human well-being and is more suitable
for applications in the direction of human-nature coupling studies, overall
evaluation of urban ecological environment, environmental effects of
urbanization, and urban ecological governance.
The results show that the NDVI has a
decreasing and subsequently increasing tendency from 1990 to 2020 for both all
of China and at the urban scale, but there is obvious heterogeneity between
regions. Although urbanization has transformed a large number of
vegetation-covered areas around cities into impervious surfaces, the NDVI
within urban physical areas has shown a significant increase in the last
decade. These results indicate that ecological improvement measures and
restoration projects such as urban green space construction, returning farmland
to forests, afforestation, and nature reserve construction have achieved
remarkable results, and urbanization is having more positive impacts on
vegetation. This dataset can offer fundamental information for further
revealing the mechanism by which vegetation cover in China responds to climate
change, human activity, and other drivers over a longer time period. It can
also offer data support to guide government departments in evaluating regional
ecological and environmental quality, formulating ecological protection
policies, and promoting regional sustainable development.
Author Contributions
Liu,
H. M. designed the overall dataset development, wrote the data paper and
performed data visualization; Zhou, T. Y. collected and processed the data,
designed the deep learning model and algorithm, and wrote the data paper; and
Gou, P. performed the data validation.
Conflicts
of Interest
The authors
declare no conflicts of interest.
References
[1]
Duveiller, G., Hooker, J.,
Cescatti, A. The mark of vegetation change on Earth??s surface energy balance
[J]. Nature Communications, 2018, 9(1): 679.
[2]
Zhang, L., Yang, L., Zohner, C.
M., et al. Direct and indirect
impacts of urbanization on vegetation growth across the world??s cities [J]. Science
Advances, 2022, 8(27): eabo0095.
[3]
Wang, J., Zhou, W. Q., Xu, K.
P., et al. Spatiotemporal
pattern of vegetation cover and its relationship with urbanization in
Beijing-Tianjin-Hebei megaregion from 2000 to 2010 [J]. Acta Ecologica
Sinica, 2017, 37(21): 7019?C7029.
[4]
Zhou, D. C., Zhao, S. Q.,
Zhang, L. X., et al. The footprint of
urban heat island effect in China [J]. Scientific Reports, 2015, 5(1):
11160.
[5]
Liu, H. M., Cui, W. J., Zhang,
M. Exploring the causal relationship between urbanization and air pollution:
evidence from China [J]. Sustainable Cities and Society, 2022, 80:
103783.
[6]
Liu, X. P., Wang, S. J., Wu, P.
J., et al. Impacts of urban expansion
on terrestrial carbon storage in China [J]. Environmental Science &
Technology, 2019, 53(12): 6834?C6844.
[7]
Cunsolo, W., A., Harper, S. L.,
Ford, J. D., et al. Climate change
and mental health: an exploratory case study from Rigolet, Nunatsiavut, Canada
[J]. Climatic Change, 2013, 121: 255?C270.
[8]
Cheng, Y., Liu, H. M., Wang, S.
B., et al. Global action on SDGs:
policy review and outlook in a post-pandemic era [J]. Sustainability,
2021, 13(11): 6461.
[9]
Zhou, D. C., Zhao, S. Q.,
Zhang, L. X., et al. Remotely sensed
assessment of urbanization effects on vegetation phenology in China??s 32 major
cities [J]. Remote Sensing of Environment, 2016, 176: 272?C281.
[10]
Zhou, T., Liu, H. M., Gou, P., et al. Conflict or Coordination?
Measuring the relationships between urbanization and vegetation cover in China
[J]. Ecological Indicators, 2023, 147: 109993.
[11]
Fensholt, R., Proud, S. R.
Evaluation of earth observation based global long term vegetation
trends??comparing GIMMS and MODIS global NDVI time series [J]. Remote sensing
of Environment, 2012, 119: 131?C147.
[12]
Xu, Y., Yang, Y. P. A 5 km
resolution dataset of monthly NDVI product of China (1982?C2020) [DS]. 2022.
DOI: 10.12041/geodata.239118756960240.ver1.db.
[13]
Dong, J. W., Zhou, Y., You, N.
S. Annual max-NDVI dataset at 30m resolution for China (2000?C2020) [DS]. 2021.
DOI: 10.12199/nesdc.ecodb.rs.2021.012.
[15]
GCdataPR Editorial Office.
GCdataPR data sharing policy [OL]. https://doi.org/10.3974/dp.policy.2014.05 (Updated
2017).
[16]
Li, X. C., Gong, P., Zhou, Y.
Y., et al. Mapping global urban
boundaries from the global artificial impervious area (GAIA) data [J]. Environmental Research Letters, 2020,
15(9): 094044.
[17]
Lei, S., Shi, Z. W., Zou, Z. X.
Super-Resolution for Remote Sensing Images via Local?CGlobal Combined Network
[J]. IEEE Geoscience and Remote Sensing Letters, 2017, 14(8): 1243?C1247.