Boundary Data for Asia Tropical Humid & Semi- humid Eco-region
Liu, C. Shi, R. X.*
Institute of Geographic Sciences and Natural Resources Research, Chinese Academy of Sciences, Beijing 100101, China
Abstract: The Asia tropical humid and semi-humid eco-region is located within the region of the tropical rain forest and Asia monsoon forest; it is the region with the most islands of the world. The total area of the region is 680.93×10⁴ km2. It has 9,600 islands with a total area of 177.94×10⁴ km2, which is 26.13% of the total area of this region. This study identifies the eco-regions by using ecosystem indicators. Based on data from NASA’s Earth Observation System and the eco-system regionalization model, we locate the boundaries of the eco-region. The indicators are as follows: (1) 16 °C is the average temperature of the coldest month for dividing tropical from sub-tropical regions; (2) 7° is the slope of the landform; and (3) 400 mm annual rainfall divides semi-humid from humid regions. The boundary of the Asia tropical humid and semi-humid eco-region extends from south Taiwan, south of the Leizhou Peninsula of Guangdong Province, to Guangxi and Yunnan Provinces to the west of China linking with the roof of the world eco-region, then to the west of India, Pakistan, then to the east of Karachi and to the nearby coastline. The Asia tropical humid and semi-humid eco-region includes a series of islands, including the Maldives islands, the British islands in the Indian Ocean, Sri Lanka and its surrounding islands, the Indonesia islands to Bali Island, Kalimantan Island, and the Philippines to Taiwan. The region covers countries including China, India, Pakistan, Sri Lanka, Myanmar, Laos, Vietnam, Malaysia, Singapore, Thailand, Cambodia, Brunei, the Philippines, Indonesia, etc. The data are archived in both .kmz and .shp formats with a compressed data size of 76.5 MB.
Keywords: Asia; tropic; humid; semi-humid; eco-region; regionalization
1 Introduction
The Asia tropical humid and semi-humid eco-region is located at the region of the tropical rain forest and Asia monsoon forest; it is the region of the world with the most islands. Fourteen countries partake in this region, including China, India, Pakistan, Sri Lanka, Myanmar, Laos, Vietnam, Malaysia, Singapore, Thailand, Cambodia, Brunei, the Philippines, and Indonesia. The total area of the region is 680.93×10⁴ km2. It contains 9,600 islands with a total area of 177.94×10⁴ km2, which is 26.13% of total area of this region. The biggest islands include Kalimantan Island with an area of 73.20×10⁴ km2 and Hainan Island with an area of 3.40×10⁴ km2. The total coastline measures 14.11×10⁴ km, which is 86.61% of the total outlines of the region. The Asia tropical humid and semi-humid eco-region is the only tropical forest region in Asia; it is the region with the most biodiversity in Asia. Based on the eco-regionalization method[1] and an analysis of remote-sensing data, we report herein the boundary data for this region.
2 Metadata of Dataset
The metadata summary for Boundary data of Asia tropical humid & semi-humid eco-region (ATHSBND)[2] are listed in Table 1.
Table 1 Summary of ATHSBND data
|
Item
|
Discription
|
|
Title of Dataset
|
Boundary data of Asia tropical humid & semi-humid eco-region
|
|
Short Name of Dataset
|
ATHSBND
|
|
Authors
|
Liu, C. L-3684-2016, Institute of Geographic Sciences and Natural Resources Research, Chinese Academy of Sciences, lchuang@igsnrr.ac.cn
Shi, R. X. L-4389-2016, Institute of Geographic Sciences and Natural Resources Research, Chinese Academy of Sciences, shirx@igsnrr.ac.cn
|
|
Region
|
Geolocation: 34º32′47.33″N-12º12′32.17″S, 68º23′48.07″E-126º36′19.05″E, including China, India, Pakistan, Sri Lanka, Myanmar, Laos, Vietnam, Malaysia, Singapore, Thailand, Cambodia, Brunei, Philippines and Indonesia
|
|
Year
|
2014
|
|
Spatial resolution
|
30 m
|
|
Data formats
|
.shp, .kmz, .rar
|
|
Data files
|
The dataset include two data files, one is in compressed .shp format (ATHSBND.rar, 57.2 MB)and other one is .kmz data format (ATHSBND.kmz, 19.3 MB)
|
|
Data size
|
76.5 MB(compressed)
|
|
Foundation
|
Chinese Academy of Sciences (INF0-115-C01-SDB3-02); Ministry of Science and Technology of P. R. China (2017YFA0604701)
|
|
Publisher
|
Global Change Research Data Publishing & Repository, http://www.geodoi.ac.cn
|
|
Address
|
No. 11A, Datun Road, Chaoyang District, Beijing 100101, China
|
|
Data sharing policy
|
Data from the Global Change Research Data Publishing & Repository includes metadata, datasets (data products), and publications (in this case, in the Journal of Global Change Data & Discovery). Data sharing policy includes: (1) Data are openly available and can be free down-loaded via the Internet; (2) End users are encouraged to use Data subject to citation; (3) Users, who are by definition also value-added service providers, are welcome to redistribute Data subject to written permission from the GCdataPR Editorial Office and the issuance of a Data redistribution license; and (4) If Data are used to compile new datasets, the ‘ten percent principal’ should be followed such that Data records utilized should not surpass 10% of the new dataset contents, while sources should be clearly noted in suitable places in the new dataset[3]
|
3 Methodology of Dataset Development
Based on the method for eco-regionalization, the ATHSBND are developed by using the following indicators: (1) 16 °C is the average temperature of the coldest month for dividing tropical from sub-tropical regions; (2) the slope of landform is 7°; and (3) 400 mm annual rainfall and vegetation divides the semi-humid from the humid regions. Figure 1 shows the procedure for developing the dataset.
The following data sources were used to develop the dataset: the
average temperature of the coldest month and the annual rainfall data are from WorldClim—Global Climate Data[4]; the Advanced Spaceborne Thermal Emission and Reflection Radiometer Global Digital Elevation Model comes from the Distributed Active Archive Center of the US Geological Survey[5], the MODIS Normalized Difference Vegetation Index (NDVI) comes from the University of Maryland, USA[6], the coastline data come from the US National Geophysical Data Center[7], and the global ecosystem regions data come from the Food and Agriculture Organization (FAO) of the United Nations[8].
|
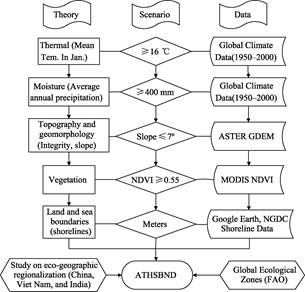
Figure 1 Flowchart for developing ATHSBND
|
3.1 Boundaries between Asia Tropical Humid & Semi-humid Region and East Asia Summer Monsoon Eco-region
The major difference between the Asia tropical humid and semi-humid eco-region and east Asia summer monsoon eco-region is the winter temperature. According to the Koppen Climate Classification[9], FAO[8] eco-regionalization, and scientists from China and Vietnam[10–25], the indicator dividing the Asia Sub-Tropic and Temperature Masson eco-region in terms of climate, ecosystems, agriculture, and vegetation is the average temperature in January, which is the coldest month. The only difference between the two regions is that the Koppen Climate Classification uses 18 °C as the indicator, whereas most Chinese researchers use 16 °C as the indicator[18–22]. Tang[10], Yu[16], and the team from the Agriculture Resources and Regions of China[24] use 15 °C as the indicator.
The present study uses an average temperature of 16 °C in January as one of the indicators. The remaining indicators are determined based on the land slope classification (land slope must be less than 7° in general), the China climate regionalization[18], the Vietnam Agricultural climate resources and regionalization[25], coastline data from the US National Geophysical Data Center,[7] and Google Earth images. The boundaries between the Asia sub-tropic and the east Asia summer monsoon eco-region include three major parts:
(1) Line dividing Yunnan, China from northern Vietnam. This boundary is 5,613.92 km long, with the northern most part at 24°15′27″ N, 101°27′47″ E. The mountains running from the northwest to southeast facilitate the passage of warm wet air to the northernmost regions (Figure 2).
|

Figure 2 Comparison of ATHSBND boundary in Yunan, China and northern Vietnam with the 16 °C
average-January-temperature line
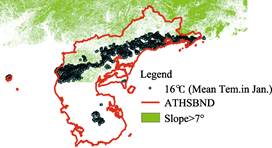
Figure 3 Comparison of ATHSBND boundary of
Leizhou Peninsula with 16 °C average-
January-temperature line
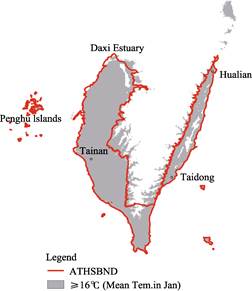
Figure 4 Comparison of ATHSBND boundary near Taiwan with 16 °C average-January-temperature line
|
(2) Boundary line south of Leizhou Peninsula. The boundary follows the foothills and plains from northern Maoming City and Huazhou City. This line is about 30 km north of the line for 16 °C average temperature in January. The northernmost place is Gaozhou City of Guangdong Province at 21°55′17″N (Figure 3).
(3) Boundary line south of Taiwan. This dividing line runs along the southern coastline of Taiwan at elevations less than 500 m above sea level. The most northern part is Banxia county of Hualian City at 24°10′51″N. On the western coastline, it reaches the Daxi river between Zhanghua City and Taizhong City at 24°11′51″N (Figure 4).
3.2 Boundary between Asia Tropical Humid & Semi-humid Region and Roof of the World Region
The boundary between the Asia tropic and the Roof of the World eco-regions was described by Liu[26,27]. The indicators include elevation (4,000 m), land slope (7°), and vertical mountain ecosystems. The boundary is 6,927.37 km long (Figure 5).
3.3 Boundary between Asia Tropical Humid & Semi-humid Eco-region and West Asia & North Africa Tropical and Sub-tropical Dry Land Eco-region
The indicators for dividing these eco- regions include annual rainfall and
vegetation[28–31].
The index of the annual rainfall is 400 mm and the NDVI is ≥0.55 (Figure 6). The boundary is 51,84.21 km long.
4 Data
Figure 7 shows the ATHSBND. The total area of the region, including con tinent and islands, is 680.93×10⁴ km2, of which 177.94×10⁴ km2 come from the 9,600 islands. Thus, the islands account for 26.13% of the total area of this region.
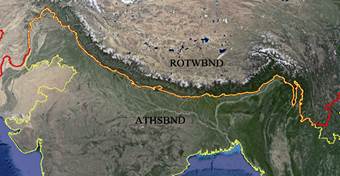
Figure 5 Boundary between Asia tropical humid and semi-humid region and Roof of the World region
|

Figure 6 Comparison of 400 mm annual rainfall with NDVI for dividing Asia tropical humid and semi-humid region from ATHSBND region
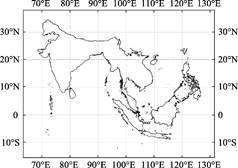
Figure 7 Map of Asia tropical humid and semi-humid eco-region
|
The ATHSBND dataset consists of two data files:
(1) The compressed boundary (line) and area (polygon) data in .shp format. The file name is ATHSBND.rar, and the data size is 57.2 MB.
(2) The ATHSBND dataset is the boundary (line) data in .kmz format. The file name is ATHSBND.kmz and the data size is 19.3 MB.
5 Discussion
The following issues are of interest for discussion:
(1) Where is the northernmost part of the ATHSBND region?
The ATHSBND indicate that the northernmost part of the ATHSBND region is close to the boundary between the tropical and sub-tropical zones, as indicated by Tang (1959, 1964)[10,13], Zeng (1966, 1980)[14,19], Yu (1981)[16], and Xu (1964, 1982)[21,22]. It means the boundary of the ATHSBND crossing China. If so, China consists of four eco-regions (the eastern monsoon eco-region, the northwestern dry land eco-region, the Tibetan eco-region, and the southern tropic islands eco-region)[32] instead of three eco-regions (eastern monsoon eco-region, northwestern dry land eco-region, and Tibetan eco-region).
(2) Coastline and outline of continents and islands
Normally, coastline is where land meets sea or ocean. However, the sea rises and falls because of tides, making it very hard to get coastline data for the entire region from remote-sensing images in a single acquisition. Thus, we use herein the outline of continents and islands based on Google Earth images (Figure 8). Another issue is the boundary between sea and rivers, especially in river deltas. The solution used herein is to determine the level reached by the sea based on the method of comprehensive consideration.
|
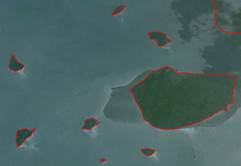
Figure 8 Map of coastline data matches with
Google Earth images
|
(3) Administration boundary and boundary of geo-ecosystem region
The Asia tropical humid and semi-
humid eco-region is part of the global ecosystem, so the aim of global regionalization is not only to identify differences between regions, but also to support global and regional governance of sustainable development. This goal requires the comprehensive consideration of both ecosystems and administrative boundaries. The International Centre for Integrated Mountain Development uses the administrative boundaries of the Hindu Kush Himalaya region.
References
[1] Liu, C. A new methodology for comprehensive physical regionalization of China supported by EOS in the moderate scale [J]. Progress in Geography, 2004, 23(6): 1-9.
[2] Liu, C., Shi, R. X. Boundary data of Asia tropical humid & semi-humid eco-region [DB/OL]. Global Change Research Data Publishing & Repository, 2014. DOI: 10.3974/geodb.2014.02.04.V1.
[3] GCdataPR Editorial Office. GCdataPR Data Sharing Policy [OL]. DOI: 10.3974/dp.policy.2014.05 (Updated 2017).
[4] WorldClim―Global Climate Data. http://www.worldclim.org/current.
[5] ASTER GDEM 2. Advanced Spaceborne Thermal Emission and Reflection Radiometer (ASTER), October 2011, Digital Elevation Database, Earth Remote Sensing Data Analysis Center, Japan, ASTER GDS User Service, http://www.gds.aster.ersdac.or.jp/gds_www2002/service_e/inq.c_e/set_inq.c_e.html, LP DAAC User Services, https://lpdaac.usgs.gov/customer_service.
[6] MODIS NDVI data. http://glcf.umd.edu/data/ndvi/.
[7] NGDC shoreline data. http://www.ngdc.noaa.gov/mgg/shorelines/data/gshhg/latest/.
[8] Forestry Department, Food and Agriculture Organization of the United Nations. Global ecological zoning for the global forest resources assessment 2000 (final report) [R]. Rome, 2001.
[9] Köppen climate classification. Wikipedia. http://zh.wikipedia.org/zh-cn/%E6%9F%AF%E6%9C% AC%E6%B0%94%E5%80%99%E5%88%86%E7%B1%BB%E6%B3%95.
[10] Tang, Y. L. Division of tropical boundaries in the southwest of Guangxi according to the division of tropical indicators in the Chinese comprehensive natural zoning [J]. Acta Geographica Sinica, 1959, 25(6): 460-462.
[11] Ren, M. E., Zeng, Z. X. The extent of tropical zone in China [J]. Scientia Geographica Sinica, 1991, 11(2): 101-108.
[12] Wu, S. H., Zheng, D. New recognition on boundary between tropical and subtropical zone in the middle section of eco-geographic system [J]. Acta Geographica Sinica, 2000, 55(6): 689-697.
[13] Tang, Y. L. Discussion on tropical boundary of China [J]. Acta Phytoecologica ET Geobotanica Sinica, 1964, 2(1): 135-137.
[14] Zeng, Z. X., Liu, N. W., Li, G. Z., et al. Discussion on the problem of tropical boundary in China [J]. Acta Geographica Sinica, 1980, 35(1): 87-92.
[15] Huang, B. W. Dr. Zhu Kezhen and scientific investigations of Hainan Island and tropical zone in China (1) [J]. Geographical Research, 1984, 3(1): 8-18.
[16] Yu, X. F. On the division of tropical boundary in China [J]. Tropical Geography, 1981, (4): 8-14.
[17] Fu, C. B., Zeng, Z. M. Monsoon region—the region with the largest change in global precipitation [J].
Chinese Science Bulletin, 1997, 42(21): 2306-2310.
[18] Central Meteorological Bureau. China Climate Zoning (1: 36000000) [M]. China’s Atlas of Physical Geography (Second Edition), Liu, M. G. (ed). Beijing: Sino Maps Press, 2000, 49.
[19] Zeng, Z. X. Discussion on the tropical boundary of China based on the distribution area of cultivated plants [J]. Acta Phytoecologica ET Geobotanica Sinica, 1966, 4(1): 151-154.
[20] Ma, Q. X., Wang, F. G., Chen, B. H., et al. The demarcation between tropics and subtropics in Guangdong judging from the distribution of Antiaris toxicaria [J]. Journal of Tropical and Subtropical Botany, 2004, 12(1): 7-12.
[21] Xu, X. H. On the demarcating line of tropical and subtropical zones in south China [J]. Acta Phytoecologica ET Geobotanica Sinica, 1982, 6(1): 74-77.
[22] Xu, X. H. The boundary between tropical and subtropical zones in south China based on geo botany [J]. Acta Phytoecologica ET Geobotanica Sinica, 1964, 2(1): 137-139.
[23] Zhao, S. Q. China Physical Geography—General Theory [M]. Beijing: Science Press, 1985.
[24] China Agricultural Resources Zoning Office, Institute of Agricultural Resources and Regional Planning, Chinese Academy of Agricultural Sciences. China Agricultural Resources and Planning [M]. Beijing: China Agricultural Science and Technology Press, 1997.
[25] Yang, W. K. Study on Viet Nam agricultural climate resources and planning based on GIS technology [D]. Nanjing: Nanjing Meteorological College, 2004.
[26] Liu, C., Shi, R. X., Chen, W. B. Eco-regional boundary data of the Roof of the World [J]. Acta Geographica Sinica, 2014, 69(Sup): 12-19,104-112.
[27] Liu, C., Shi, R. X., Chen, W. B. Eco-regional boundary data of the Roof of the World [DB/OL]. Global Change Research Data Publishing & Repository, 2014. DOI: 10.3974/geodb.2014.01.01.V1.
[28] Joshi, P. K. K., Roy, P. S., Singh, S., et al. Vegetation cover mapping in India using multi-temporal IRS Wide Field Sensor (WiFS) data [J]. Remote Sensing of Environment, 2006, 103 (2): 190-202.
[29] Prasad, A.K., Sarkar, S., Singh, R. P., et al. Inter-annual variability of vegetation cover and rainfall over india [J]. Advances in Space Research, 2007, 39: 79-87.
[30] Cai, X. L., Sharma, B. R. Integrating remote sensing, census and weather data for an assessment of rice yield, water consumption and water productivity in the Indo-Gangetic river basin [J]. Agricultural Water Management, 2010, 97: 309-316.
[31] Dhakar, R., Sehgal, V. K., Pradhan, S. Study on inter-seasonal and intra-seasonal relationships of meteorological and agricultural drought indices in the Rajasthan State of India [J]. Journal of Arid Environments, 2013, 97: 108-119.
[32] Liu, C., Shi, R. X. GIS Dataset of Boundaries among Four Geo-Eco Regions of China [DB/OL]. Global Change Research Data Publishing & Repository, 2016. DOI: 10.3974/geodb.2016.04.21.V1.