Dataset
Development of Butuo Lake Changes in Xizang Autonomous Region of China
(1988?C2024)
Yang, D.1 Baima, Y. Z.1* Zhang, W. H.1 Yu, X. T.2 Cili, Y. Z.2
1.
Climate Center of Xizang Autonomous Region, Lhasa 850000, China;
2.
Meteorological Station of the Xizang Autonomous Region, Lhasa 850000, China
Abstract: We preprocessed Landsat
series and GF1 remote sensing images from 1988 to 2024 through
orthorectification and image registration. Using manual visual interpretation,
we delineated the vector boundary of Butuo Lake and calculated the
corresponding area, thereby constructing a dataset of the lake changes in the
Xizang Autonomous Region of China (1988?C2024). The dataset includes vector
boundary and area data for 33 time periods. The results show that the area of
Butuo Lake has exhibited an overall expansion trend, with an average growth
rate of 0.20 km2/10a. The maximum recorded area occurred in 2019
(16.14 km2), while the minimum was observed in 1990 (15.16 km2).
This dataset provides insights into the temporal and spatial dynamics of Butuo
Lake and offers a solid data foundation for further research on climate change,
ecological environment, and water resource management in the region. The
dataset is archived in .shp format and consists of 231 files with a total size of 377 KB.
Keywords: Butuo Lake; area; remote sensing;
1988?C2024
DOI: https://doi.org/10.3974/geodp.2025.03.09
Dataset Availability Statement:
The
dataset supporting this paper was published and is accessible through the Digital
Journal of Global Change Data Repository at: https://doi.org/10.3974/geodb.2025.07.03.V1.
1 Introduction
The
Qinghai-Xizang Plateau, often referred to as the
??Third Pole of the Earth?? and the ??Water Tower of Asia??[1], is the
world??s highest-altitude region with the densest distribution of lakes. Its
total lake area accounts for more than 50% of the country??s total lake area,
making it one of the key lake regions in China[2]. Owing to its
remote geographical location and limited human disturbance, the dynamic changes
of these lakes serve as highly sensitive indicators of climate change[3].
Variations in lake area and water level[4] are closely linked to
factors such as precipitation, temperature[5], and glacial ablation[6].
In recent years,
the lakes on the Qinghai-Xizang Plateau have undergone significant
transformations. While most of the lakes are expanding[7,8], some
have shown a shrinking trend[9,10]. To achieve a precise
understanding of these dynamics, long-term, continuous, and high-quality lake monitoring data are essential. In this
context, the establishment of a dataset on water area changes in Butuo Lake
provides a valuable basis for advancing research on climate change, ecological
systems, and water resource management in the region.
Butuo Cuoqing
and Butuo Cuoqiong, collectively known as Butuo Lake, are located in Dingqing
County, Changdu City, within the Xizang Autonomous Region. These alpine lakes
lie in the Sequ River Basin, an important tributary of the Lancang River. Among
them, Butuo Cuoqing Lake extends in a north-south orientation, while Butuo
Cuoqiong is located to the east. Both lakes
are primarily fed by nearby glaciers, making them typical representatives of
alpine lake systems[11].
2 Metadata of the Dataset
The
metadata of the Dataset of Butuo Lake changes in Xizang Autonomous Region of
China (1988?C2024)[12] is summarized in Table 1. It includes
information such as the full dataset name, short name, authors, year of
release, temporal and spatial resolution, data format, data size, data files,
publisher, and data sharing policy.
Table 1 Metadata
summary of the Dataset of Butuo Lake changes in Xizang Autonomous Region of
China (1988?C2024)
|
Items
|
Description
|
|
Dataset full name
|
Dataset of Butuo
Lake changes in Xizang Autonomous Region of China (1988?C2024)
|
|
Dataset short
name
|
ButuoLake_1988-2024
|
|
Authors
|
Yang, D., Climate
Center of the Xizang Autonomous Region, 1136458728@qq.com
Baima, Y. Z.,
Climate Center of the Xizang Autonomous Region, 724509860@qq.com
Zhaxi, Y. Z.,
Climate Center of the Xizang Autonomous Region, zxyz65@163.com
Zhang, W. H.,
Climate Center of the Xizang Autonomous Region, 839070317@qq.com
Yu, X. T.,
Meteorological Station of the Xizang Autonomous Region, 1035762632@qq.com
Cili, Y. Z.,
Meteorological Station of the Xizang Autonomous Region, 2254803057@qq.com
|
|
Geographical
region
|
Dingqing County,
Changdu City, Xizang Autonomous Region
|
|
Year
|
1988?C2024
|
|
Temporal
resolution
|
Year
|
|
Spatial
resolution
|
16 m
|
|
Data format
|
.shp
|
|
|
|
Data size
|
377 KB
|
|
|
|
Data files
|
Vector boundary
data and area data of Butuo Lake for 33 periods, 1988?C1990, 1992, 1995?C2007,
2009?C2024
|
|
Foundations
|
Xizang Autonomous
Region (XZ202301ZY0054G, XZQH202410LM02Z)
|
|
Data computing environment
|
ENVI, ArcGIS
|
|
Data publisher
|
Global Change Research Data Publishing & Repository,
http://www.geodoi.ac.cn
|
|
Address
|
No. 11A, Datun
Road, Chaoyang District, Beijing 100101, China
|
|
Data sharing
policy
|
(1) Data are openly available and can be
free downloaded via the Internet; (2) End users are encouraged to use Data subject to citation; (3) Users,
who are by definition also value-added service providers, are welcome to
redistribute Data subject to
written permission from the GCdataPR Editorial Office and the issuance of a Data redistribution license; and (4)
If Data are used to compile new
datasets, the ??ten percent principal?? should be followed such that Data records utilized should not
surpass 10% of the new dataset contents, while sources should be clearly
noted in suitable places in the new dataset[13]
|
|
Communication and searchable system
|
DOI, CSTR,
Crossref, DCI, CSCD, CNKI, SciEngine, WDS, GEOSS, PubScholar, CKRSC
|
3 Methods
For
the data sources, Landsat images with a spatial resolution of 30 m were
obtained from the Geospatial Data Cloud[14], while GF1 remote
sensing images with a spatial resolution of 16 m were acquired from the China
Centre for Resources Satellite Data and Application website[15]. To
ensure data consistency, images captured during summer and autumn were
preferentially selected for the study period (Table 2).
Table 2 Remote sensing image data sources for the
study area
|
Sensor
|
Row/column number
or latitude/longitude
|
Images time
|
Spatial resolution (m)
|
|
Landsat5 (TM)
|
135/38
|
1988?C1990, 1992, 1995?C1998, 2000?C2002
|
30
|
|
Landsat7 (ETM+)
|
135/38
|
1999, 2003?C2007, 2009?C2012
|
30
|
|
GF1-WFV4
|
95.1??E/31.9??N
|
2013-10-13
|
16
|
|
GF1-WFV3
|
95.1??E/32.3??N
|
2014-10-03
|
16
|
|
GF1-WFV2
|
95.0??E/30.9??N
|
2015-11-25
|
16
|
|
GF1-WFV4
|
95.9??E/31.9??N
|
2016-11-12
|
16
|
|
GF1-WFV1
|
96.3??E/31.3??N
|
2017-07-15
|
16
|
|
GF1-WFV4
|
95.2??E/31.8??N
|
2018-10-31
|
16
|
|
GF1-WFV4
|
95.2??E/31.9??N
|
2019-08-26
|
16
|
|
GF1-WFV1
|
95.8??E/31.3??N
|
2020-09-01
|
16
|
|
GF1-WFV1
|
95.7??E/31.3??N
|
2021-10-16
|
16
|
|
GF1-WFV3
|
96.6??E/32.3??N
|
2022-08-16
|
16
|
|
GF1-WFV4
|
95.4??E/31.9??N
|
2023-09-14
|
16
|
|
GF1-WFV4
|
95.8??E/31.8??N
|
2024-07-01
|
16
|
All Landsat
series and GF1 remote sensing images from 1988 to 2024 were preprocessed using
ENVI software. The preprocessing operations included orthorectification, image
registration, and related procedures. To ensure data standardization and
interoperability, the coordinate system was uniformly defined as the China
National Geodetic Coordinate System (CGCS2000). Subsequently, the area of Butuo
Lake was extracted through visual interpretation in ArcGIS, followed by area
statistics and data verification[16], leading to the establishment
of a spatial database of lake areas.
4 Data Results
4.1 Dataset Composition
The
Dataset of Butuo Lake changes in Xizang Autonomous
Region of China (1988?C2024) includes a total of 33 time periods of vector
boundary data and area data (in .shp format), covering 1988?C1990, 1992,
1995?C2007, and 2009?C2024. The dataset consists of 2 polygon features, with an
attribute field representing the lake area (km2).
4.2 Data Results
The
area of Butuo Lake exhibited an overall fluctuating expansion trend (R2
= 0.594), with an average growth rate of 0.20 km2/10a. The
maximum lake area was recorded in 2019 (16.14 km2), while the
minimum occurred in 1990 (15.16 km2). Over the study period, the
water area increased from 15.17 km2
to 15.99 km2, representing a 5.41% growth. Compared with 1988, the
area in 2019 increased by 6.39% (Table 3).
The water areas
of Butuo Cuoqing and Butuo Cuoqiong showed an overall expansion trend. For
Butuo Cuoqing, the average growth rate was 0.13 km2/10a (R2 =
0.618,8), with a maximum area of 9.55 km2
recorded in 2021. During the study period, its water area increased from 8.81
km2 to 9.41 km2, representing a 6.81% expansion.
Compared with 1988, the area in 2021 increased by 8.40%. For Butuo Cuoqiong,
the average growth rate was 0.07 km2/10a (R2 = 0.368,3), with a maximum area of 6.78 km2 recorded in
2019. Over the study period, its water area expanded from 6.36 km2 to
6.59 km2, with an increase of 3.62%. Compared with 1988, the area in 2019
increased by 6.60%.
Table 3 Statistics table of Butuo Lake area (1988?C2024)
|
Year
|
Area??km2??
|
Year
|
Area??km2??
|
|
Butuo Cuoqing
|
Butuo Cuoqiong
|
Sum
|
Butuo Cuoqing
|
Butuo Cuoqiong
|
Sum
|
|
1988
|
8.81
|
6.36
|
15.17
|
2009
|
9.18
|
6.47
|
15.65
|
|
1989
|
8.92
|
6.32
|
15.24
|
2010
|
9.16
|
6.45
|
15.61
|
|
1990
|
8.88
|
6.27
|
15.16
|
2011
|
9.29
|
6.56
|
15.85
|
|
1992
|
9.08
|
6.34
|
15.42
|
2012
|
9.25
|
6.49
|
15.74
|
|
1995
|
9.06
|
6.34
|
15.40
|
2013
|
9.30
|
6.53
|
15.84
|
|
1996
|
9.02
|
6.25
|
15.27
|
2014
|
9.25
|
6.49
|
15.74
|
|
1997
|
9.04
|
6.40
|
15.43
|
2015
|
9.24
|
6.37
|
15.61
|
|
1998
|
9.06
|
6.28
|
15.34
|
2016
|
8.95
|
6.35
|
15.30
|
|
1999
|
9.11
|
6.41
|
15.52
|
2017
|
9.32
|
6.55
|
15.87
|
|
2000
|
9.04
|
6.35
|
15.40
|
2018
|
9.04
|
6.29
|
15.33
|
|
2001
|
9.02
|
6.39
|
15.41
|
2019
|
9.36
|
6.78
|
16.14
|
|
2002
|
9.12
|
6.43
|
15.56
|
2020
|
9.26
|
6.45
|
15.71
|
|
2003
|
9.10
|
6.39
|
15.49
|
2021
|
9.55
|
6.39
|
15.93
|
|
2004
|
9.09
|
6.39
|
15.48
|
2022
|
9.28
|
6.51
|
15.79
|
|
2005
|
9.16
|
6.44
|
15.59
|
2023
|
9.26
|
6.49
|
15.75
|
|
2006
|
9.19
|
6.45
|
15.64
|
2024
|
9.41
|
6.59
|
15.99
|
|
2007
|
9.23
|
6.52
|
15.75
|
|
|
|
|
|
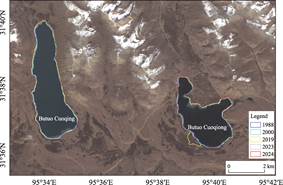
Figure 1 Spatial changes of Butuo Lake water
area (1988?C2024)
|
In terms of
spatial changes in the water area (Figure 1), the northwestern shoreline of
Butuo Cuoqing experienced noticeable expansion. For Butuo Cuoqiong, the most
significant changes occurred in the southwestern part, followed by the northern
shoreline, which also showed clear alterations. Compared with 1988, the
northwestern and southeastern shores of Butuo Cuoqing expanded outward in 2019,
and a pronounced expansion was observed in its southwestern part. By 2024,
Butuo Cuoqing showed even greater expansion in the northwest and southeast,
whereas Butuo Cuoqiong exhibited more evident growth along its northern
shoreline.
5 Discussion and Conclusion
In
this study, 33 periods of Landsat and GF1 images were preprocessed through
orthorectification and image registration, followed by the extraction of Butuo
Lake??s area. The results indicate that the lake exhibited an overall expansion
trend from 1988 to 2024, with an average growth rate of 0.20 km2/10a,
reaching a maximum of 16.14 km2 in 2019. Among the 2 sub-lakes,
Butuo Cuoqing expanded at an average rate of 0.13 km2/10a, while
Butuo Cuoqiong expanded at 0.07 km2/10a. Spatially, Butuo Cuoqing
showed notable expansion along its northwestern shoreline, whereas Butuo
Cuoqiong experienced significant changes in its southwestern and northern
parts. The dataset of Butuo Lake changes in the Xizang Autonomous Region
captures both area and spatial dynamics of the lake, providing essential
support for research on climate change responses in southeastern Xizang, as
well as important data for ecological security and sustainable development in
the region.
Author Contributions
Yang, D. designed the
algorithms of dataset. Baima, Zhang, W. H. acquired and processed remote
sensing image data. Baima, Y. Z. designed the model and algorithm. Yu, X. T.
and Cili, Y. Z. did the data validation. Yang, D. wrote the data paper.
Conflicts of
Interest
The
authors declare no conflicts of interest.
References
[1]
Zhu,
L. P., Ju, J. T., Qiao, B. J., et al. Recent
lake changes and climatic responses in the ??Asian Water Tower??: progress,
issues, and prospects [J]. Chinese Science Bulletin, 2019, 64(27):
2796?C2806.
[2]
Xu, F. L., Zhang, G. Q.
Sustained expansion of lakes on the Qinghai-Xizang Plateau and its potential
impacts [J]. Chinese Science Bulletin, 2024, 69(27): 3999?C4001.
[3]
Zhan, P. F., Song, C. Q., Wang, J.
D., et al. Multi-source altimetry remote sensing monitoring of anomalous
lake water level changes on the Qinghai-Xizang Plateau
in recent years and analysis of its causes [C]//Proceedings
of the 2022 China Earth Science Joint Academic Annual Meeting-Symposium 55:
Global Change Geodesy and Remote Sensing, Symposium 56: Seismotectonic Geodesy,
2022.
[4]
Deji,
Y. Z., Laba, Basang, W. D., et al. Characteristics
of lake changes in southwest Naqu, Xizang, over the past 50 years and their
response to climate change [J]. Progress in Climate Change Research,
2024, 20(5): 534?C543.
[5]
Deji,
Y. Z., Baima, R. Z., Baima, Y. Z., et al. Multi-source
satellite remote sensing monitoring of lake surface changes in Luma Jiangdong
Co, northwestern Xizang, in recent 40 years [J]. Plateau and Mountain
Meteorology Research, 2022, 42(1): 85?C89.
[6]
Baima, Y. Z., Lazhen, Zhaxi, Y.
Z. Responses of lakes in the Anglaco Basin and Eastern Glaciers to climate
change in Xizang from 1973 to 2020 [J]. Plateau and Mountain Meteorology
Research, 2021, 41(3): 88?C94.
[7]
Tai, X. N., Wang, N. L., Wu, Y.
W., et al. Characteristics of lake ice phenology changes in Siling Co
and its influencing factors in recent 20 years [J]. Journal of Lake Sciences,
2022, 34(1): 334?C348.
[8]
Hao,
J., Li, J. X., Lian, Z. X., et al. Analysis of
lake area change patterns and influencing factors on the Qinghai-Xizang Plateau
[J]. Journal of Hydrology, 2024, 44(1): 112?C118.
[9]
Lv, L. Study on the response
relationship between lake area changes and climatic elements on the
Qinghai-Xizang Plateau since 2000 [D]. Chengdu: Chengdu University of
Technology, 2019.
[10]
Zeng, L., Lazhen, Deji, Y. Z., et
al. Construction of half-century dataset of lake area changes in Mapam
Yumco and La??ang Co (1972?C2023) [J]. Journal of Global Change Data &
Discovery, 2023, 7(4): 369?C374. https://doi.org/10.3974/geodp.2023.04.04.
[11]
Zhang, Y., Kong, Z. C., Yang,
Z. J., et al. Vegetation evolution and climate change since the Holocene
in Butuo Lake, Changdu, Qinghai-Xizang Plateau [C]//Abstracts of the 9th First
Academic Annual Meeting of the Palynology Society of the Chinese
Paleontological Society. Palynology Society of the Chinese Paleontological
Society, 2013: 1.
[12]
Yang, D., Baima, Y. Z., Zhaxi,
Y. Z., et al. Dataset of Butuo Lake changes in Xizang Autonomous Region
of China (1988?C2024) [J/DB/OL]. Digital Journal of Global Change Data
Repository, 2025. https://doi.org/10.3974/geodb.2025.07.03.V1.
[13]
GCdataPR Editorial Office.
GCdataPR data sharing policy [OL]. https://doi.org/10.3974/dp.policy.2014.05
(Updated 2017).
[14]
Chinese Academy of Sciences
Computer Network Information Center. Geospatial data cloud [DB/OL].
[2025-01-21]. https://www.gscloud.cn/.
[15]
China National Space
Administration Earth Observation and Data Center. China Resources Satellite
Application Center [DB/OL]. [2025-01-21]. https://www.cpeos.org.cn/.
[16]
Yang, D., Zhang, W. H., Zhou,
K. S., et al. Characterization of changes in the area of Butuo Lake and
analysis of factors affecting it from 1988 to 2024 [J]. Tibet Science and
Technology, 2025, 47(3): 53?C58, 67.