Gridded GDP Dataset of Yunnan Border Area (1992?C2013)
Lu, X.1,2 Li, J.1*
Duan, P.1 Li, C.1 Cheng, F.1 Wang, J. L.1
1. College of Tourism and Geographical Sciences,
Yunnan Normal University, Kunming 650500, China;
2. Key Laboratory of Virtual Geographic
Environment and Ministry of Education, Nanjing Normal University, Nanjing
210023, China
Abstract: The Yunnan border area is located on the
southwestern border of Yunnan Province. It is located in the economic corridors
of Myanmar, India, China, and Bangladesh and has an important geographical
position. Therefore, it is critical to implement the spatial fitting of the
Gross Domestic Product (GDP) data in the Yunnan border area with high
precision. In
this study, the Yunnan border area was used as the research area, and DMSP/OLS
nighttime light data, land use data, and Yunnan provincial statistical data
were used as data sources to implement the spatial fitting of the GDP data for
the research area from 1992 to 2013. Saturation correction, mutual correction,
annual fusion, interannual correction, reprojection, resampling, and clipping
were performed on nighttime light data. Spatialization of the primary industry based
on land use data was implemented. Based on nighttime light data, a ??classification
regression?? method was used to implement the spatialization of the secondary
and tertiary industries to obtain the spatialization of the GDP and verify the
fitting results. The results show that the error of the primary industry fitting
value of all periods is 1.12% at the maximum, and the fitting error is small.
The relative error of the fitting of the secondary and tertiary industries
after classification regression is less than 6.40% in each period, and the
relative fitting error of the final GDP of each period is less than 4.24%, with
high accuracy. The dataset is stored in the .tif file format. The spatial
resolution of a single file is 1-km, and there were a total of 22 groups of
files; the amount of the data volume was 68.6 MB (when compressed to 1 file, it
was 3.43 MB).
Keywords: GDP spatialization; Yunnan border area; nighttime
light data; land use data
Dataset Available
Statement:
The dataset supporting this paper
was published at: Lu, X., Li, J., Duan P., et
al. 1-km grid GDP dataset in Yunnan surrounding area (1992?C2013) [J/DB/OL].
Digital Journal of Global
Change Data Repository, 2020. DOI: 10.3974/geodb.2020.03.11.V1.
1 Introduction
The border areas of Yunnan are located in the economic
corridors of China, India, Myanmar, and Bangladesh. They serve as a bridge and
link between China, South Asia and the South-east Asian countries for material,
cultural, economic and trade exchanges. Therefore, this geographical location
is very important for China??s development. The Gross Domestic Product (GDP) is
an evaluation indicator that measures a region??s economic development, gauges
urban development and reflects regional planning[1].
The traditional GDP statistical data is limited by separations in
administrative units, so it is difficult to obtain very precise economic data
that show the differences within the administrative units, and it is impossible
to conduct a comprehensive analysis in combination with raster data such as
ecological environment[2] data.
Through the spatial fitting of the GDP data, the above problems can be solved.
With the continuous progress and development of remote sensing technology,
remote sensing data such as nighttime light data and land use data are widely
used in the spatial fitting of GDP data. The DMSP/OLS nighttime light data acquired
by the US Defense Military Meteorological Satellite has been applied since the 1970s[3]. The data has strong photoelectric
amplification capabilities, can intuitively reflect human activities, and has
the advantages of extended time spans and wide spatial coverages. After
continuous improvement and updating, it has been applied to many aspects of
development planning such as urbanization monitoring, population analysis,
energy consumption and GDP estimation. Therefore, based on the DMSP/OLS
nighttime light data, combined with land use data and statistical data, this
study constructed a spatial dataset of the GDP in the Yunnan border area from
1992 to 2013. This dataset reflects the economic differences within the
administrative divisions of the Yunnan border area and can be comprehensively
analyzed with raster image data such as natural ecological environment data.
2 Metadata of
the Dataset
The metadata of the dataset[4]
is summarized in Table 1. It includes the dataset full name, short name,
authors, geographical region, years, temporal resolution, spatial resolution,
data format, data size, data files, data publisher, and data sharing policy,
etc.
Table 1 Metadata summary of the dataset
|
Items
|
Description
|
|
Dataset full name
|
1-km grid GDP dataset in Yunnan surrounding area (1992?C2013)
|
|
Dataset short name
|
YunnanBorderGDP1992-2013
|
|
Authors
|
Lu, X. AAS-6714-2020, College of Tourism and Geographical
Sciences, Yunnan Normal University, lx_rsgis@163.com
Li, J. AAS-6000-2020, College of Tourism and Geographical Sciences,
Yunnan Normal University, keguigiser@163.com
Duan, P. College of Tourism and Geographical Sciences, Yunnan
Normal University, duanpingshai@163.com
Li, C. College of Tourism and Geographical Sciences, Yunnan
Normal University, lichen924541412@163.com
Cheng, F. College of Tourism and Geographical Sciences,
Yunnan Normal University, chengfeng_rs@163.com
Wang, J. L. College of Tourism and Geographical Sciences,
Yunnan Normal University, jlwang@ynnu.edu.cn
|
|
Geographical region
|
Yunnan border area, including eight prefectures including
Baoshan city, Honghe Hanizuyizu autonomous prefecture, Lincang city, Dehong
Daizu-Jingpozu autonomous prefecture, Nujiang Lisuzu autonomous prefecture,
Xishuangbanna Daizu autonomous prefecture, Pu??er city and Wenshan city
|
|
Year
|
1992-2013
|
|
Temporal resolution
|
1 Year
|
|
Spatial resolution
|
1 km
|
|
Data format
|
.tif
|
(To be continued on the next page)
(Continued)
|
Items
|
Description
|
|
Data size
|
68.6 MB (before compression), 3.43 MB (after compression)
|
|
Data files
|
GDP spatialization product data
|
|
Foundation(s)
|
Ministry
of Science and Technology of P. R. China (SQ2018YFE011725); National Natural Science Foundation of China
(41561048)
|
|
Computing environment
|
ArcGIS
|
|
Data publisher
|
Global Change Research Data Publishing & Repository,
http://www.geodoi.ac.cn
|
|
Address
|
No. 11A, Datun Road, Chaoyang District, Beijing 100101, China
|
|
Data sharing policy
|
Data from
the Global Change Research Data Publishing & Repository includes metadata, datasets (in the Digital Journal of Global Change Data Repository), and publications
(in the Journal of Global Change Data & Discovery). Data sharing policy includes: (1) Data
are openly available and can be free downloaded via the Internet; (2) End
users are encouraged to use Data subject to citation; (3)
Users, who are by definition also value-added service providers, are welcome
to redistribute Data subject to written permission from the GCdataPR
Editorial Office and the issuance of a Data redistribution license; and (4)
If Data
are used to compile new datasets, the ??ten per cent principal?? should be
followed such that Data records utilized should not
surpass 10% of the new dataset contents, while sources should be clearly
noted in suitable places in the new dataset[5]
|
|
Communication and searchable system
|
DOI, DCI, CSCD, WDS/ISC, GEOSS, China GEOSS, Crossref
|
3 Methods
3.1 Introduction and Data Preprocessing
The
DMSP/OLS nighttime light data includes three kinds of image data products,
which are average visible, stable lights, & cloud free coverage data,
average lights X Pct data, and global radiance calibrated nighttime lights
data. Average visible, stable lights, & cloud free coverage data includes
three data types, namely, average visible light image, stable light image, and
cloud free coverages data. The data used in this study is the stable light
image. The phase is from 1992-2013, the DN value range is 0-63, and the pixel
size is 0.008,333??.
Because the sensor of
these data product has not been calibrated on the satellite, the different
light images obtained by each sensor lacks continuity and comparability, and a
saturation of the pixel DN value exists in the central area of the city[6-7]. Therefore, this study combines the methods of Elvidge,
Wu, Liu, etc.[8-10] to perform saturation correction, mutual correction,
annual fusion, interannual correction, reprojection for the Albers projection,
resampling for 1,000 m, and clipping of the nighttime light data. Calibration
steps: (1) Do a mutual calibration and saturation calibration. Perform mutual
correction and saturation correction on the image to be corrected, from 1992 to
2013, and the data of the 2006 F16 sensor in the data from the radiation
calibration product. The reference area is Jixi city, Heilongjiang province.
The calibration model is:
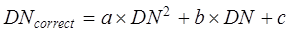 (1)
(1)
where DN is
the brightness value before the correction, a,
b, c are regression coefficients, and DNcorrect is the corrected DN value.
(2) Annual fusion. The data obtained by different sensors
in the same year is inconsistent, and some of the images corrected after step
(1) are fused within the year according to the following equation (2).
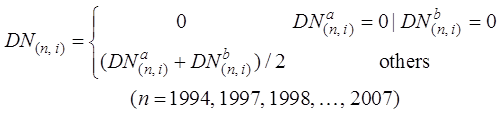 (2)
(2)
where  and
and  represent the DN
value of the i-pixel acquired by two
different sensors in the n year after
the mutual calibration and the saturation correction, respectively, and DN(n,i) represents the
DN of the i-pixel after the n-year fusion and correction of the image
within the year.
represent the DN
value of the i-pixel acquired by two
different sensors in the n year after
the mutual calibration and the saturation correction, respectively, and DN(n,i) represents the
DN of the i-pixel after the n-year fusion and correction of the image
within the year.
(3) Interannual correction. After the fusion within the
year, there is still the phenomenon of incomparable
images between different years. The correction equation is given in equation
(3).
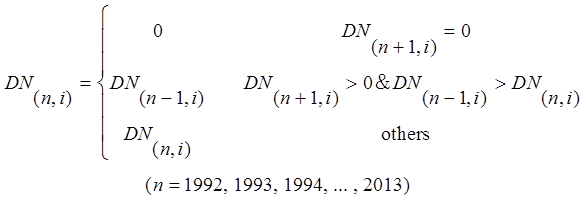 (3)
(3)
In the equation, DN(n-1,i),
DN(n,i), DN(n+1,i),
respectively represent the DN values of the image pixel i in n-1 year, n year, n+1 year.
3.2 Algorithm
The correlation between the primary industry and the land
use data for the fields of cultivated land, forest, grass and water is high[11]. Therefore, the agricultural,
forestry, animal husbandry, and fishery output value data in the primary industry
are modeled respectively with the corresponding land types in the land use
data. The modeling equation is as follows:
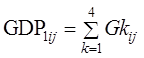 (4)
(4)
In equation (4), GDP1ij represents the output value of the first industry in the j grid of the i administrative region; Gkij
represents the four kinds of output values for k = 1-4, respectively corresponding to the serial numbers of
agricultural, forestry, animal husbandry and fishery output values in the
primary industry.
The brightness of the DMSP/OLS nighttime light data has a
certain correlation with the secondary and tertiary industries, and the
distribution of different light brightness values of night lights can be used
to fit the secondary and tertiary industries. The fitting model is as follows:
 (5)
(5)
GDP23 represents the fitting value of the secondary
and tertiary industries, and a is the fitting coefficient. Where SOL stands for:
 (6)
(6)
where Nm
represents the number of pixels whose brightness value is m, and Bm represents
the brightness value of the pixel itself.
Based
on the nighttime light index, the error between the fitting results of the
global modeling of the secondary and tertiary industries and the statistical
data is large. Therefore, in order to reduce the deficiency of the global
modeling the study uses the concept of ??classification regression??, that is,
adding the relative error to the fitting model for the global modeling; the equation
is as follows:
 (7)
(7)
GDPS
is the statistical value of the secondary and tertiary industries in the study
area. The specific process of ??classification regression?? modeling is:
(1)
According to the initial fitting equation, filter out the counties with
|??|<25% to form the first equation. These counties are fitted with the first
equation.
(2)
Divide the counties where |??|>25% into two parts, where ??>25%, rebuild
the fitting model??s overestimated section, and in counties where ??<-25% rebuild the
fitting model??s underestimated section;
(3)
After building the model through the above two steps, if there still exist
counties with |??|>25%, and if the number is greater than 10% of the total fitting
model number, then continue to partition the model until the fitting equation
is |??|<25% or the number of the remaining fitting model is less than 10%;
then the modeling is terminated.
The
primary industry model fitting results obtained above,
and the secondary and tertiary industries model fitting results are overlaid to
obtain the GDP fitting results. The obtained fitting results still will have
large fitting errors in some counties. Therefore, a linear correction within
the county area is performed on the obtained GDP fitting results. The correction
model is as follows:
 (8)
(8)
In the equation, GDPcorrect
represents the corrected GDP raster data, GDPestimated is the estimated GDP data of each grid, GDP*
represents the statistical GDP data of the county, and GDPall is the estimated GDP data of the corresponding
county.
4 Data Results and Validation
4.1 Data Products
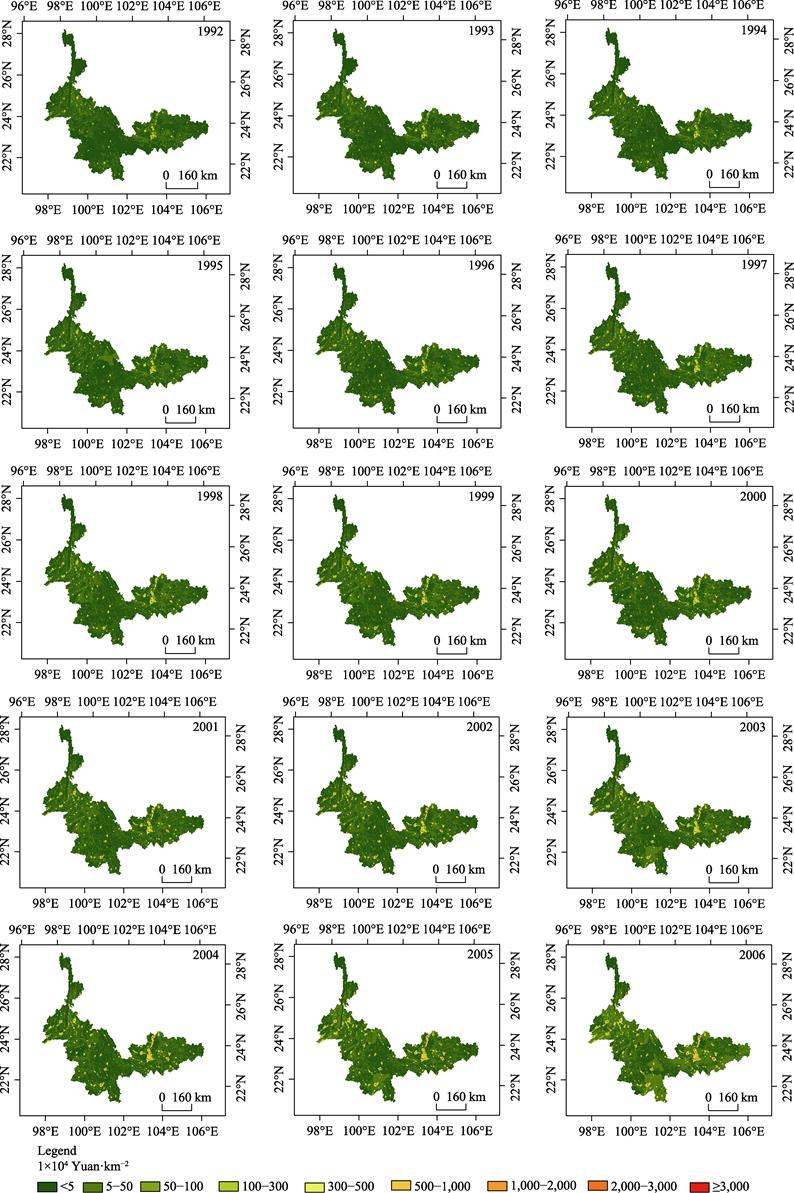
The Grided GDP dataset of Yunnan border area includes spatial
distribution of 8 prefectures from 1992 to 2013 and spatial distribution is
shown in Figure 1[12-13].
4.2 Data
Results
From 1992 to 2004, the regions with a
higher GDP and better economic development were mainly distributed in the
eastern region of the border area of the Yunnan-Honghe Hanizuyizu autonomous prefecture
with scattered distributions in the western part area. Since 2005, the economic
development of Baoshan city, Dehong Daizu-Jingpozu
autonomous prefecture and Xishuangbanna Daizu
autonomous prefecture has gradually improved, while the economic
development of Lincang city and Pu??er city in the central region has lagged
behind other regions. After 2010, the high-value pixel area of the GDP
gradually spread throughout the border areas, and the economic development
level of each prefecture gradually increased.
 (To be continued on the next page)
(Continued)
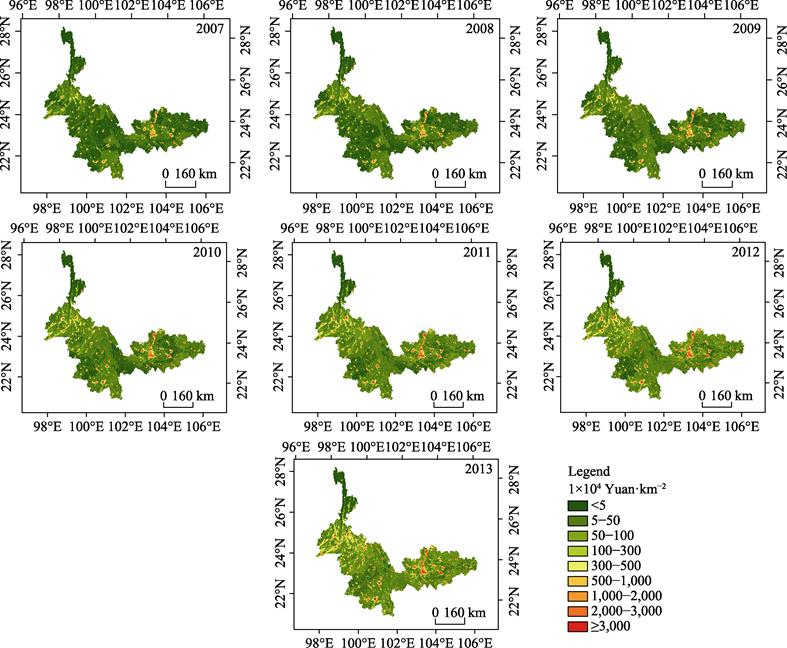
Figure
1 Spatial distribution of GDP in
Yunnan border area from 1992 to 2013
In terms of
counties, counties with high GDP values such as Gejiu city, Kaiyuan city, and
Mile county have always been at the forefront of
economic development in the border regions. In particular, Mile county has been ranked first in GDP in the border areas
since 2001. After 2001, Baoshan, Jinghong, Tengchong, Mengzi, and Jianshui developed
gradually. The GDP pixel value increased year by year, and the high-value pixel
area gradually spread out from the center of the city. The low value GDP
pixel areas are mainly concentrated in counties such as Gongshan, Fugong,
Ximeng and Lianghe, and the economic development is slow for these areas.
4.3 Data Validation
The error between
the fitting value of the primary industry, the fitting value of the secondary
and tertiary industries, the fitting value of the GDP and the corresponding GDP
statistics can be compared and analyzed. The error analysis results show that:
the relative error of the primary industry fitting value of the fitting data in
each period can reach 0.09%, at minimum, and the maximum does not exceed 1.12%.
The error is small and the fitting accuracy is high. It shows that the primary
industry is feasible according to the land use data and the precision is high.
The maximum error of the unclassified regression fitting of the secondary and
tertiary industries is -29.09%, and the relative error of the fitting
after classification regression is only -6.40%, and the
minimum can reach -0.40%. It shows that the classification regression
fitting method greatly improves the fitting accuracy of the secondary and
tertiary industries. The relative error of the final GDP fitting is only -4.24%
at the maximum, with a higher precision and better fitting accuracy. The
fitting results can be used for subsequent data calculations, analysis and
other applications.
5 Discussion
and Conclusion
This research is based on the use of
land use data to fit the GDP of the primary industry by using the DMSP/OLS
nighttime light data and a classification regression fitting method to fit the secondary
and tertiary industries. The fitting period is from 1992 to 2013. By verifying
the accuracy of the fitting results, the results show that the fitting accuracy
of each industry is high. The relative error of the fittings in the primary industry
is not higher than 1.12%, the relative error of the fittings in the secondary
and tertiary industries are not more than 6.40%, and the relative error of the
final GDP fitting is only -4.24%, and the fitting
effect is good. Additionally, the inversion accuracy is high. These data can be
further used for the analysis of economic differences within administrative
divisions and may be combined with other raster image data for spatial calculations
and analysis.
References
[1]
Wang, J. N., Lu, Y. T., Zhou, J. S., et al. Analysis of China
resource-environment Gini coefficient based on GDP [J]. China Environmental Science, 2006, 26(1): 111-115.
[2]
Han, X. D., Zhou, Y., Wang, S. X., et al. GDP spatialization in China based on nighttime imagery [J]. Journal of Geo-Information Science, 2012, 14(1): 128-136.
[3]
Croft, T.
A. Burning waste gas in oil fields [J]. Nature,
1973, 245(5425): 375-376.
[4]
Lu, X., Li,
J., Duan, P., et al. 1-km grid
GDP dataset in Yunnan surrounding area (1992?C2013) [J/DB/OL].
Digital Journal of Global Change Data Repository,
2020. DOI:
10.3974/geodb.2020.03.11.V1.
[5]
GCdataPR
Editorial Office. GCdataPR Data Sharing Policy [OL]. DOI:
10.3974/dp.policy.2014.05 (Updated 2017).
[6] Abrahams, A., Oram, C., Lozano-Gracia, N.
Deblurring DMSP nighttime lights: a new method using Gaussian filters and frequencies of illumination [J]. Remote Sensing of Environment, 2018,
210: 242-258.
[7]
Ni, Y., Zhou, X. C., Jiang,
W. A reducing saturation method for DMSP/OLS nighttime light image combining
Landsat Data [J]. Remote Sensing
Technology and Application, 2017, 32(4): 721-727.
[8]
Elvidge, C.
D., Ziskin, D., Baugh, K. E., et al.
A fifteen year record of global natural gas flaring derived from satellite data
[J]. Energies, 2009, 2(3): 595-622.
[9]
Wu, J. S.,
He, S. B., Peng, J., et al.
Intercalibration of DMSP-OLS night-time light data by the invariant region
method [J]. International Journal of
Remote Sensing, 2013, 34(20): 7356-7368.
[10] Liu, Z. F., He, C. Y., Zhang,
Q. F., et al. Extracting the dynamics
of urban expansion in China using DMSP- LS nighttime light data from 1992 to
2008 [J]. Landscape and Urban Planning,
2012, 106(1): 62-72.
[11]
Zhong, K. W.,
Li, J. L., Zhang, X. D. GDP spatialization in land sustainable use assessment [J].
Journal of Geomatics, 2007, 32(3): 10-12.
[12]
Lu, X., Li,
J., Duan, P., et al. Spatial
difference of GDP in Yunnan border area based on nighttime light and land use
data [J]. Journal of Geo-information
Science, 2019, 21(3): 455-466.
[13]
Lu, X., Li,
J., Duan, P., et al. Spatialization
and forecasting of GDP in Yunnan border area based on nighttime light and land use
Data [J]. Areal Research and Development,
2020, 39(2): 36-39, 81.