Dataset of Land Use and Proximity Variables in Panyu District, Guangzhou (1999, 2008)
Zhang, Y. H. Qiao, J. G.*
School of Geography and Tourism, Guangdong University of Finance and Economics, Guangzhou 510320, China
Abstract: Studies have shown that urban expansion is often related to a series of proximity variables. Therefore, ArcGIS software is used to obtain proximity variables, such as, distance from the district center, distance from the metro lines, distance from the metro stations, distance from the roads, and distance from town centers. These proximity variables can be used to build an urban expansion CA model. They also can be used to analysis parameter sensitivity of model. As the Geospatial Data Cloud (http://www.gscloud.cn/) provides free Landsat remote sensing data, this paper selects the data in 1999 and 2008. And then orthorectification, atmospheric correction and supervised classification are performed to obtain the classification results, which are used for start and verification images of the urban expansion CA model. By using the map service provided by the National Geographic Information Public Service Platform (http://www.tianditu.gov.cn/), the metro stations, metro lines and roads in the study area were digitized, and the district center and town center were obtained to form the vector dataset. These vector datasets were applied to Euclidean distance analysis to obtain the spatial variables of the study area. All the spatial variables were normalized to facilitate the comparative analysis. The dataset is archived in .txt, .img, .xml, and .rrd formats, which is mainly composed of 24 files, and the file size is 1.81 MB. The analysis results of dataset are published on the Journal of Remote Sensing in 2018 (No. 6, Vol. 22).
Keywords: urban expansion; cellular automata; parameter sensitivity; Journal of Remote Sensing
1 Introduction
Urban expansion is the most popular part of land use change and the hotspot of global change research[1‒2]. Some scholars pay attention to the spatial pattern of urban expansion, however some scholars pay attention to the process of urban expansion[3‒4]. The process of urban expansion often uses raster data (remote sensing image) as the data source. The structure characteristics of raster data and the Cellular Automaton (CA) models are consistent with each other. Therefore, many scholars use them to study the process of urban expansion[5‒7]. Some scholars have proposed a lot of new models. When the models are applied to the actual situation, sensitivity research is often needed, including transition rules, spatial scales and neighborhood space[8]. In the sensitivity studies of the CA model, the transition rules are the core part. The parameters of transition rules have an important influence on the results of the urban expansion simulation[9]. The spatial scale characteristics of the model can be reflected by the cell size (the spatial resolution of the raster data)[8]. The interaction of the neighborhood cells on the central cell can often be reflected by the size and shape of the neighborhood[10]. Therefore, this paper constructs a CA sensitivity analysis dataset for scholars by quantitatively acquiring samples, analyzing neighborhood structures and studying microscopic cell scales.
2 Metadata of Dataset
The metadata of “Land use and the spatial distances dataset of Panyu district, Guangzhou city of China (1999, 2008)”[11] is summarized in Table 1, including the dataset full name, short name, authors, year of the dataset, temporal resolution, spatial resolution, data format, data size, data files, data publisher, and data sharing policy, etc.
Table 1 Metadata summary of “Land use and the spatial distances dataset of Panyu district, Guangzhou city of China (1999, 2008)”
|
Items
|
Description
|
|
Dataset full name
|
Land use and the spatial distances dataset of Panyu district, Guangzhou city of China (1999, 2008)
|
|
Dataset short name
|
ParamSensUrbanCAmodel
|
|
Authors
|
Zhang, Y. H. F-6808-2019, School of Geography and Tourism, Guangdong University of Finance and Economics, zyh4184@163.com
|
|
|
Qiao, J. G. F-7553-2019, School of Geography and Tourism, Guangdong University of Finance and Economics, qjg821@263.com
|
|
Geographical region
|
Panyu district, Guangzhou province
|
|
Year
|
1999 and 2008
|
|
Temporal resolution
|
Year Spatial resolution 50 m
|
|
Data format
|
.txt, .img, .xml, .rrd Data size
|
1.81 MB (after compression)
|
|
Data files
|
The dataset consists of two kinds of remote sensing classification images and five proximity variables, which are as follows:
(1) Two classification images in 1999 and 2008. The original images were subjected to atmospheric correction, geometric correction, and geographic registration using ENVI software. Supervised classification method was used to divide the land use type into urban land, unutilized land, cultivated land, forest, pond, water, and garden
(2) Proximity variables. Euclidean distance method in ArcGIS was used to obtain proximity variables according to the vector data of the district center, metro lines, metro stations, roads and town centers. Five variables were created, including distance from the district center, distance from the metro lines, distance from the metro stations, distance from the roads, and distance from town centers
|
|
Foundations
|
Department of Education of Guangdong Province (2016KTSCX045); Natural Science Foundation of Guangdong Province (2014A030313605, 2016A030313806)
|
|
Data publisher
|
Global Change Research Data Publishing & Repository, http://www.geodoi.ac.cn
|
|
Address
|
No. 11A, Datun Road, Chaoyang District, Beijing, 100101, China
|
|
Data sharing policy
|
Data from the Global Change Research Data Publishing & Repository includes metadata, datasets (data products), and publications (in this case, in the Journal of Global Change Data & Discovery). Data sharing policy includes: (1) Data are openly available and can be free downloaded via the Internet; (2) End users are encouraged to use Data subject to citation; (3) Users, who are by definition also value-added service providers, are welcome to redistribute Data subject to written permission from the GCdataPR Editorial Office and the issuance of a Data redistribution license, and; (4) If Data are used to compile new datasets, the ‘ten percent principal’ should be followed such that Data records utilized should not surpass 10% of the new dataset contents, while sources should be clearly noted in suitable places in the new dataset[12]
|
|
Communication and searchable system
|
DOI, DCI, CSCD, WDS/ISC, GEOSS, China GEOSS
|
3 Methods
3.1 Study Area
This paper takes the Panyu district of Guangzhou city in the Pearl River Delta as the research area. This study area is located in the center of the Dawan district of Guangdong, Hong Kong and Macao, with a total area of 529.9 km2. Panyu district is in the south-central part of Guangzhou, adjacent to the Pearl River in the east, facing the city of Dongguan across the river. its south is Nansha district, adjacent to the Nansha Free Trade Zone, the west to Foshan city and Zhongshan city and north to the Haizhu district of the core city of Guangzhou. Panyu district governs 10 streets and 6 towns. According to the Guangzhou Statistical Yearbook, the permanent population of Panyu district reached 1,171,300 (2017). The urban land area of Panyu was 134.6 km2 in 1999 and it increased to 255.60 km2 in 2008. The annual growth rate of urban expansion is as high as 6.8%.
3.2 Technical Route

Figure 1 Technical route of the data development
The Geospatial Data Cloud (http://www.Gscloud.cn/) provides free Landsat remote sensing data. The data in 1999 and 2008 were selected, and the processes of orthorectification, atmospheric correction and supervised classification were carried out[13]. The classification results can be used to as start and terminated images in urban expansion CA model. The metro stations, metro lines, roads, district center and town based on the map service provided by the National Geographic Information Public Service Platform (http://www. Tianditu.gov.cn/) were digitized and then Euclidean distance was carried out to obtain proximity variables[3‒4]. In order to facilitate the comparative analysis, all the proximity variables were normalized and input into urban expansion CA model. The flowchart for generating the dataset is shown in Figure 1.
4 Results and Validation
4.1 Data Products
This dataset contains classifications images of 1999 and 2008 in Panyu district. The classifications images of 1999 were used as start image in the simulations of urban expansion CA model, while classifications image of 1999 was used as validation data for simulation results. The dataset also includes proximity variables, such as distance from the district center, distance from the metro lines, distance from the metro stations, distance from the roads, and distance from town centers (Figure 2).
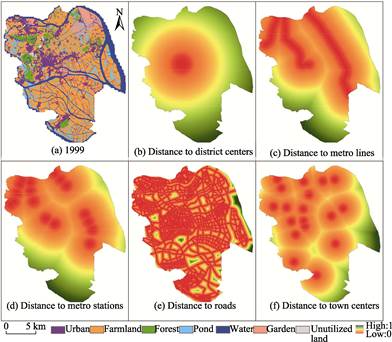
Figure 2 Basic data of urban expansion CA model[14]
4.2 Validation
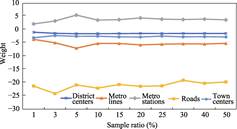
Figure 3 Relationship between sample ratio and parameters
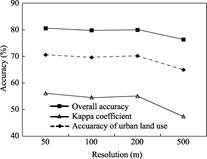
Figure 4 Simulation accuracy in different resolutions[14]
First, sampling ratio of the dataset on parameters was analyzed. Monte Carlo sampling method was used in this paper for convenience comparison (Table 2). Samples with different sampling ratios of 1%, 3%, 5%, 10%, 15%, 20%, 25%, 30%, 40% and 50%, were respectively obtained to obtain parameters. Results showed that the parameters became stable as the ratio increased (Figure 3). If higher ratio of sampling is used for training, the amount computation of training will be relatively large. If a smaller sample ratio is used to obtain the parameter, the parameter will have larger error. Secondly, the simulation results of different neighborhood sizes and neighborhood structures were analyzed (Table 3). It can be found that the accuracy of the simulation results could reach 80.57% by using 3×3 neighborhood. The accuracy would be lower and became 80.48% by using 5×5 extended neighborhood. However, the simulation accuracy will reach 80.51% and 80.52% when using 7×7 and 9×9 neighborhood. In general, the simulation accuracy that using the von Neumann neighborhood is slightly lower than that using Moore neighborhood. The accuracy was 80.43%, 80.47%, 80.50% ,and 80.51%, respectively, when using the extended von Neumann neighborhoods of 3×3, 5×5, 7×7, and 9×9. Thirdly, we analyze the spatial sensitivity of dataset by using overall accuracy, Kappa coefficient and accuracy of urban area (Figure 4). In general, the overall accuracy, Kappa and accuracy of urban area is reduced as the spatial scale increases. When the spatial scale is increased from 50 m to 200 m, the overall accuracy, Kappa and accuracy of urban area change little, from 80.57% to 79.98%, from 56.11% to 55.04%, and from 70.58% to 70.18%, respectively. However, when the scale is increased from 200 m to 500 m, the indicators decreased significantly, i.e., the overall accuracy decreased from 79.98% to 76.36%, the Kappa coefficient decreased from 55.04% to 47.45%, and the accuracy of urban area decreased from 70.18% to 64.94%. Finally, in order to understand the different spatial scales in micro-level, we count the ratio of urban cells in different resolution of 50 m×50 m, 100 m×100 m, 200 m×200 m and 500 m×500 m in 1999 and 2008.
Table 2 Sampling validation of the dataset[14]
|
Ratio (%)
|
District center
|
Subway lines
|
Subway stations
|
Roads
|
Town centers
|
Accuracy (%)
|
|
1
|
-0.90
|
-3.58
|
2.23
|
-21.19
|
-2.99
|
80.44
|
|
3
|
-1.31
|
-4.89
|
3.34
|
-24.07
|
-2.17
|
80.65
|
|
5
|
-1.45
|
-6.93
|
5.57
|
-20.78
|
-2.44
|
80.59
|
|
10
|
-1.42
|
-5.14
|
3.69
|
-21.99
|
-2.41
|
80.64
|
|
15
|
-1.40
|
-5.14
|
3.83
|
-20.63
|
-2.66
|
80.66
|
|
20
|
-1.35
|
-5.68
|
4.49
|
-21.32
|
-2.72
|
80.62
|
|
25
|
-1.38
|
-5.43
|
4.04
|
-21.14
|
-2.37
|
80.66
|
|
30
|
-1.34
|
-5.28
|
3.89
|
-19.05
|
-2.64
|
80.67
|
|
40
|
-1.37
|
-5.35
|
4.04
|
-20.18
|
-2.59
|
80.70
|
|
50
|
-1.36
|
-5.10
|
3.78
|
-19.64
|
-2.69
|
80.64
|
Table 3 Validation of neighborhood structure[14]
|
Neighborhood size
|
Accuracy (%)
|
|
Moore
|
von Neumann
|
|
3×3
|
80.57
|
80.43
|
|
5×5
|
80.48
|
80.47
|
|
7×7
|
80.51
|
80.50
|
|
9×9
|
80.52
|
80.51
|
Results showed that with the increase of spatial scale, the ratio of high urban cells (such as, count is 8 or 7) decreased in 1999 and 2008 (Table 4). This suggests that urban development density decreases from high to low by downscaling. It can also be seen from the table that urban cells of 1, 2, 3, and 4 were continuously increased by downscaling. However, the ratio of urban cells (count are 6, 7, and 8) in neighborhood had a tendency to be declined.
Table 4 Urban cell ratio of Moore neighborhood in different resolution[14]
|
No.
|
1999
|
2008
|
|
50 m
|
100 m
|
200 m
|
500 m
|
50 m
|
100 m
|
200 m
|
500 m
|
|
0
|
69.1
|
59.5
|
54.5
|
44.6
|
50.5
|
40.1
|
32.6
|
18.7
|
|
1
|
4.0
|
9.2
|
15.9
|
23.2
|
4.5
|
8.9
|
14.3
|
20.9
|
|
2
|
4.1
|
8.7
|
9.2
|
12.8
|
4.5
|
8.9
|
11.2
|
16.2
|
|
3
|
5.0
|
6.9
|
6.1
|
7.0
|
6.0
|
8.6
|
8.6
|
13.5
|
|
4
|
3.7
|
4.2
|
4.2
|
5.2
|
4.7
|
6.3
|
6.6
|
9.1
|
|
5
|
3.3
|
3.2
|
3.2
|
3.5
|
4.9
|
5.7
|
5.8
|
8.8
|
|
6
|
2.2
|
2.5
|
2.4
|
2.0
|
3.6
|
4.6
|
5.6
|
6.2
|
|
7
|
1.8
|
2.1
|
2.0
|
1.1
|
3.1
|
4.6
|
5.8
|
4.3
|
|
8
|
6.9
|
3.8
|
2.5
|
0.7
|
18.2
|
12.2
|
9.5
|
2.2
|
5 Discussion and Conclusion
In order to verify the sensitivity of the urban expansion CA model, we collected relevant data of a rapidly urbanized area, Panyu district in Guangzhou city, and a new dataset with the spatial resolution of 50 m was constructed. Using this dataset, it is easy to analyze the effect of sensitivity of sampling scale, neighborhood structure, and spatial resolution on urban expansion CA model. Results showed that the dataset had good stability for obtaining the weights (parameters) of the CA model. It was also effective for verifying the function of CA model in different neighborhood sizes and neighborhood structures. In terms of spatial scale sensitivity, the dataset can help to understand the simulation result in micro-levels and their relationship with simulation accuracy. In order to analyze the sensitivity and understand the CA model, this paper provided an operational and basic version of dataset for urban expansion CA models or land-use change CA models. Longer time series and more spatial resolution to study the predictive ability of the CA model will be carried out in the next step.
Author Contributions
Qiao, J. G. designed the algorithms of dataset; Zhang, Y. H. contributed to the data processing, data analysis, and paper writing.
References
[1] Liu, J. Y., Liu, M. L., Zhuang, D. F., et al. Analysis on the spatial pattern of land use change in China [J]. Science China Earth Sciences, 2002, 32(12): 1031–1040.
[2] Wang, L., Li, C. C., Ying, Q., et al. China’s urban expansion from 1990 to 2010 determined with satellite remote sensing [J]. Chinese Science Bulletin, 2012, 57(16): 1388–1399.
[3] Li, X., Yeh, A. G. O. Data mining of cellular automata’s transition rule [J]. International Journal of Geographical Information Science, 2004, 18(8): 723–744.
[4] Zhang, Y. H., Li, X., Liu, X. P., et al. The CA model based on data assimilation [J]. Journal of Remote Sensing, 2011, 15(3): 475–491.
[5] White, R., Engelen, G. Cellular automata and fractal urban form: a cellular modelling approach to the evolution of urban land-use patterns [J]. Environment and Planning A, 1993, 25(8): 1175–1199.
[6] Wu, F. Calibration of stochastic cellular automata: the application to rural-urban land conversions [J]. International Journal of Geographical Information Science, 2002, 16(8): 795–818.
[7] Li, X., Yeh, A. G. O. Neural-network-based cellular automata for simulating multiple land use changes using GIS [J]. International Journal of Geographical Information Science, 2002, 16(4): 323–343.
[8] Ke, X. L., Deng, X. Z., He, S. J. Scale sensitivity and its causality for geo-cellular automata modeling [J]. Geographical Research, 2010, 29(5): 863–872.
[9] Liu, X., Ma, L., Li, X., et al. Simulating urban growth by integrating landscape expansion index (LEI) and cellular automata [J]. International Journal of Geographical Information Science, 2014, 28(1): 148–163.
[10] Wu, H., Zhou, L., Shi, W. Z., et al. Scale sensitive of cellular automata model for the simulation of land use change based on orthogonal experiment [J]. Scientia Geographica Sinica, 2013, 33(10): 1252–1258.
[11] Zhang, Y. H., Qiao, J. G. Land use and the spatial distances dataset of Panyu district, Guangzhou city of China (1999, 2008) [DB/OL]. Global Change Research Data Publishing & Repository, 2018. DOI: 10.3974/geodb.2018.04.06.V1.
[12] GCdataPR Editorial Office. GCdataPR data sharing policy [OL]. DOI: 10.3974/dp.policy.2014.05 (Updated 2017).
[13] Zhao, Y. S. Principles and Methods of Remote Sensing Application and Analysis [M]. Beijing: Science Press, 2003: 166–208.
[14] Zhang, Y. H., Qiao, J. G., Liu, W. H., et al. Parameter sensitivity analysis of urban cellular automata model [J]. Journal of Remote Sensing, 2018, 22(6): 1051–1059. DOI: 10.11834/jrs.20187145.