Dataset of Geo-economic Relations between the United States
and Northeast Asian Nations Based on Flow Data (2000?C2016)
Ma, T.1, 2 Li, Y. J.1 Ge, Y. J.3, 4*
1. School of Economics and Management, Hangzhou
Normal University, Hangzhou 311121, China;
2. Institute for Global Innovation and
Development, East China Normal University, Shanghai 200062, China;
3. Faculty of Geographical Science, Beijing
Normal University, Beijing 100875, China;
4. Academy of Plateau Science
and Sustainability, Xining 810008, China
Abstract: Geo-economic research is of great significance for understanding
the geographical pattern of the United States and Northeast Asia. Adhering to
the spatial connection strength model and the static potential energy formula
from physics, this paper constructs a geo-economic relationship tightness model
and geo-economic streaming potential model. We calculate the geo-economic
relationship tightness among Northeast Asian nations and the geo-economic
streaming potential between the United States and the respective Northeast
Asian nations. The variables of interest include data on investment, trade, air
cargo capacity, liner transportation capacity, the number of days needed to
establish enterprises, and the turnover time of importers. This paper describes
the overall geo-economic development patterns and evolution from two datasets
focused on trade and investment. The results data and process data were
included in these datasets. The results dataset includes: (1) the trade
tightness between Northeast Asian nations (2000?C2016); (2) the
investment tightness between Northeast Asian nations (2004?C2016);
(3) the trade streaming potential between the United States and Northeast Asian
nations (2004?C2016); (4) the investment streaming potential between the United
States and Northeast Asian nations (2004?C2016); and (5) the
geo-economic streaming potential between the United States and Northeast Asian
nations (2004?C2016). The dataset was archived in .xlsx format, with a data size
of 44.5 KB.
Keywords: geo-relations; geo-economics; flow data;
Northeast Asia
DOI: https://doi.org/10.3974/geodp.2021.02.11
CSTR: https://cstr.escience.org.cn/CSTR:20146.14.2021.02.11
Dataset Availability Statement:
The
dataset supporting this paper was published and is accessible through the Digital Journal of Global Change Data
Repository at: https://doi.org/10.3974/geodb.2021.03.02.V1 or https://cstr.escience.org.cn/CSTR:20146.11.2021.03.02.V1.
1 Introduction
Geo-economics is a product of the logic of geo-political
conflict being replaced with the logic of geo-economic competition under globalization[1], and is a new theory
explaining international relations. Since the 1970s, global trade and capital
flows have accelerated, and economic factors and relations have become
increasingly dominant across international affairs. Globalization and regional
integration are driving this process, along with the imminent emergence of the
geo-economic era. In this era, economic factors represent not only
geo-strategic goals of nations around the world but also an important means for
nations to achieve their geo-political goals[2].
Since Luttwak first proposed the concept of geo- economics in 1990[3],
domestic and foreign scholars have explored many avenues including the origin,
development process, and theoretical application and extensions of geo- economics[4?C6]. The emergence of
geo-economics has also led scholars to redefine the core concept of ??power??
within geo-politics and international relations[7,8].
One important aspect of geo-economic research is to
describe the evolution of geo-economic relations between nations across time
and space. Flow data can not only reflect the scale of the geo-economic flow
between nations but also highlight the changes in flow direction. This dataset
mainly consists of data on trade and investment across Northeast Asian nations,
and describes the geo-economic relationship between them.
2 Metadata of the Dataset
The metadata of the Geo-economic
relation dataset between US and Northeast Asia nations (2000?C2016)[9] is summarized in Table 1.
It includes the dataset full name, short name, authors, year of the dataset,
data format, data size, data publisher, and data sharing policy, etc.
3 Method
3.1 Research Areas
Geo-security
relations across Northeast Asia face constant threats and challenges, while
geo-economic relations have steadily grown, and bilateral trade and investment
quotas have increased continuously. Even with a reduction in political
friction, economic and political development is not coordinated. It is also an
issue within Northeast Asia??s geo-economic relations, which makes Northeast
Asia a representative case for geo-economics. The dataset used in this study
includes the United States, Japan, South Korea, Mongolia, China, Russia and
North Korea.
3.2 Data Sources
The data
sources are as follows: trade data come from the United Nations Trade and
Development Database;
investment data are taken from China??s Foreign Investment Statistics Bulletin
(2003?C2016) on the website of the Ministry of Commerce
of the People??s Republic of China,
the US Bureau of Business Analysis,
and the official website of the Organization for Economic Cooperation and
Development; the air
cargo capacity, liner transportation capacity index, the number of days
required to establish a business, and the turnover time of imported goods are
all soured from the World Bank database.
(Three indicators??the liner transportation capacity index, the number of days
required to establish a business, and the turnover time of imported goods??are
not included in the statistics for North Korea. To replace these, the dataset
uses the corresponding data of the ??least developed nations?? defined by the
World Bank.) In order to ensure uniformity across the dataset, only trade data
from the time period 2000?C2016 were used in this study, while investment data
were selected between 2004?C2016. The final comparison
of geo-economic relations incorporates complete data between
2004?C2016. As the size and units differ across the dataset, SPSS19.0 is
used to standardize the data before eliminating the influence of dimensions.
Table 1 Metadata summary of the Geo-economic relation dataset between US and
Northeast Asia nations (2000?C2016)
|
Items
|
Description
|
|
Dataset
full name
|
Geo-economic
relation dataset between US and Northeast Asia nations (2000?C2016)
|
|
Dataset
short name
|
Geo-economic_US_NE_Asia
|
|
Authors
|
Ma, T., School of Economics and
Management, Hangzhou Normal University; Institute for Global Innovation and
Development, East China Normal University; mateng0119@163.com.
Li, Y. J., School of Economics and
Management, Hangzhou Normal University; liyijie199712@163.com.
Ge, Y. J., Faculty of Geographical
Science, Beijing Normal University; Academy of Plateau Science and
Sustainability; geyj@bnu.edu.cn.
|
|
Geographical
region
|
United
States, Japan, South Korea, Mongolia, China, Russia, North Korea
|
|
Year
|
2000?C2016
|
|
Data
format
|
.xlsx
Data
size 44.5 KB
|
|
Data
files
|
Raw
data of investment, trade, air cargo capacity, liner transport capacity
index, the number of days needed to start a business, and the turnover time
of imported goods across Northeast Asian nations (2000?C2016); trade tightness
between Northeast Asian nations (2000?C2016); investment tightness between
Northeast Asian nations (2004?C2016); trade, investment, and geo-economic
streaming potential between the United States and Northeast Asian nations
(2004?C2016)
|
|
Foundations
|
National
Natural Science Foundation of China (41871128, 41661033, 41701133); Major
Programme of the National Social Science Foundation of China (16ZDA041);
Strategic Priority Research Program of the Chinese Academy of Sciences (XDA20100311)
|
|
Data
publisher
|
Global
Change Research Data Publishing & Repository, http://www.geodoi.ac.cn
|
|
Address
|
No.
11A, Datun Road, Chaoyang District, Beijing 100101, China
|
|
Data
sharing policy
|
Data from
the Global Change Research Data Publishing & Repository includes metadata, datasets
(in the Digital Journal of Global Change Data Repository), and
publications (in the Journal of Global Change Data & Discovery). Data sharing policy
includes: (1) Data are openly available and can be free downloaded via the
Internet; (2) End users are encouraged to use Data subject to
citation; (3) Users, who are by definition also value-added service
providers, are welcome to redistribute Data subject to written permission
from the GCdataPR Editorial Office and the issuance of a Data redistribution
license; and (4) If Data are used to compile new
datasets, the ??ten per cent principal?? should be followed such that Data
records utilized should not surpass 10% of the new dataset contents, while
sources should be clearly noted in suitable places in the new dataset[10]
|
|
Communication
and
searchable system
|
DOI, CSTR, Crossref, DCI, CSCD, CNKI, SciEngine, WDS/ISC, GEOSS
|
3.3
Algorithms
3.3.1 The Construction of
a Geo-economic Relations Tightness Model
The spatial connection strength model has previously been
used in geography research, and it can comprehensively and objectively describe
the spatial connection strength of the research object [11]. Here,
the spatial linkage strength model is used to measure the tightness of trade
and investment linkages among Northeast Asian nations. The equation is:
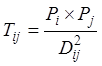 (1)
(1)
where Tij
is the strength of the trade (or investment) relationship between the two
nations; Pi and Pj represent the mutual
exports (or investment) between nation i
and nation j, respectively; and Dij is the spherical distance
between the two nations.
3.3.2 Construction of the Geo-economic Streaming Potential Model
Here, we use the static potential energy formula from
physics to analyze the geo-economics streaming potential within trade and
investments.
(1) At the trade level, the equation is:
 (2)
(2)
where GeoTij
(Geo-trade) represents the trade flow between i and j; EXPij is the total export
volume of nation i to nation j; whereas EXPji is the total export volume of nation j to nation i; CTij is the
trade flow channel index of the nation; and
r is the spherical distance between i
and j. The size of the trade flow
channel index CTij is
mainly dependent on the transportation capacity and convenience of goods. This
article defines the trade flow channel index as being related to its
transportation volume and turnaround time. The equation is:
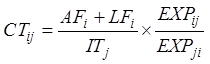 (3)
(3)
where AFi
is the air cargo capacity of nation i;
LFi is the liner
transportation capacity of nation i; ITj is the turnaround time of
nation j??s imports; and EXPij/EXPij is the proportion of nation i??s exports to nation j compared to nation i??s total exports that year.
(2) At the investment level, the equation is:
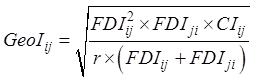 (4)
(4)
where GeoIij
(Geo-investment) represents the investment flow of i and j; FDIij is the
amount of foreign direct investment from nation i to nation j; FDIji is the amount of
foreign direct investment from nation j
to nation i; CIij is the investment flow channel index from nation j to nation i; and r is the
spherical distance between i and j. The degree of market openness of a
nation has a channel restrictive effect on investment. The market openness of
target nation j is divided into five
categories on a Likert scale comprising ??very open??, ??relatively open??,
??normal??, ??relatively closed??, and ??very closed??. We take the
five points from the United States, and compare the other nations with the
United States in turn and assign them a score according to an expert scoring
method. Here, we draw on relevant research for scoring[12] and
assign Japan and South Korea four points each, Mongolia and China three points,
Russia two points, and North Korea one point, according to the moment when each
nation joined the World Trade Organization (WTO) which could have led to
changes in the value. At the same time, the factor of the time required to
establish a business in the target nation has been used by some scholars to
indicate the factors of investment thresholds and obstacles[13].
From this, the investment flow
channel index (CIij) equation is:
 (5)
(5)
where Sj is
the Likert scale score of the market openness of target nation j, and BRj is the number of days required to start a business
in target nation j.
(3) The geo-economic streaming potential model is:
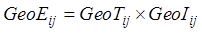 (6)
(6)
where GeoEij
(Geo-economic relation) is the geo-economic flow of the two nations i and j,
which is used to reflect the geo-economic relationship
between the two nations. The higher the score the stronger the geo-economic
relationship is, the lower the score, the weaker the relationship.
4 Data
Results
4.1 Data Composition
This
dataset has a national spatial resolution and covers the United States, Japan,
South Korea, Mongolia, China, Russia, and North Korea, including the results
and processing data. The results data consist of:
(1) the
trade tightness between Northeast Asian nations (2000?C2016);
(2) the
investment tightness between Northeast Asian nations (2004?C2016);
(3) the trade streaming
potential between the United States and Northeast Asian nations (2004?C2016);
(4) the investment
streaming potential between the United States and Northeast Asian nations (2004?C2016); and
(5) the geo-economic
streaming potential between the United States and Northeast Asian nations (2004?C2016).
The processing data in the attachment contains
the raw data of investment, trade, air cargo capacity, liner transport capacity
index, the number of days needed to start a business, and the turnover time of
imported goods downloaded from the United Nations Trade and Development
Database, China??s Foreign Investment Statistics Bulletin (2003?C2016), the US Bureau of Business Analysis, the
official website of the Organization for Economic Cooperation and Development,
and the World Bank database.
4.2 Data Results
4.2.1 Geo-economic Tightness
In terms of trade, from 2000 to 2016 the level of trade
tightness between the United States and Russia,
compared to other nations in Northeast Asia, continuously improved. After 2010,
the degree of trade tightness between China and the United States was
significantly higher than that between the United States and other Northeast
Asian nations, while Mongolia and North Korea were in a low static state
compared to other nations.
In terms of investment, in 2004 the scale of investment
flows across Northeast Asian nations was generally low, but this situation
began to change in 2008. The investment flows from the United States, Japan,
Russia, South Korea and China increased significantly. This shows that an
investment flow network with the United States as the core was gradually
forming. By 2012, this core position of the United States was further
consolidated, especially considering the improved investment tightness with
China, and the investment tightness between China, Japan and South Korea also
significantly increased. During this period, China gradually formed another
core. In 2016, the central position of the United States in the investment flow
network in Northeast Asia was even stronger, and the investment tightness
between China and other nations had greatly improved. In this way, China and
the United States formed a dual center pattern in the investment flow network.

Figure
1 Spatio-temporal evolution of the trade tightness between the United
States and Northeast Asian nations during 2000?C2016
4.2.2 Geo-economic Streaming
Potential
The United States and Northeast Asian
nations had low overall scores on geo-economic streaming potential, but this
continued to rise, especially after 2009. The strength of the United
States?CChina currents began to surpass that of the United States?CJapan currents
around 2008 and continued to rise, becoming the most important bilateral
current in Northeast Asia. In terms of economic relations, the United
States?CSouth Korea rising geo-economic streaming potential followed closely
behind; the remaining geo-economic trends between United States?CRussia, United
States?CMongolia and United States?CNorth Korea rose every year, but remained in
a low and static state. Compared with United States?CChina, United States?CJapan,
and United States?CSouth Korea, the strength of the geo-economic flow of United
States?CRussia, United States?CMongolia and United States?CNorth Korea remained
weak, which was consistent with the performance of trade and investment flows.
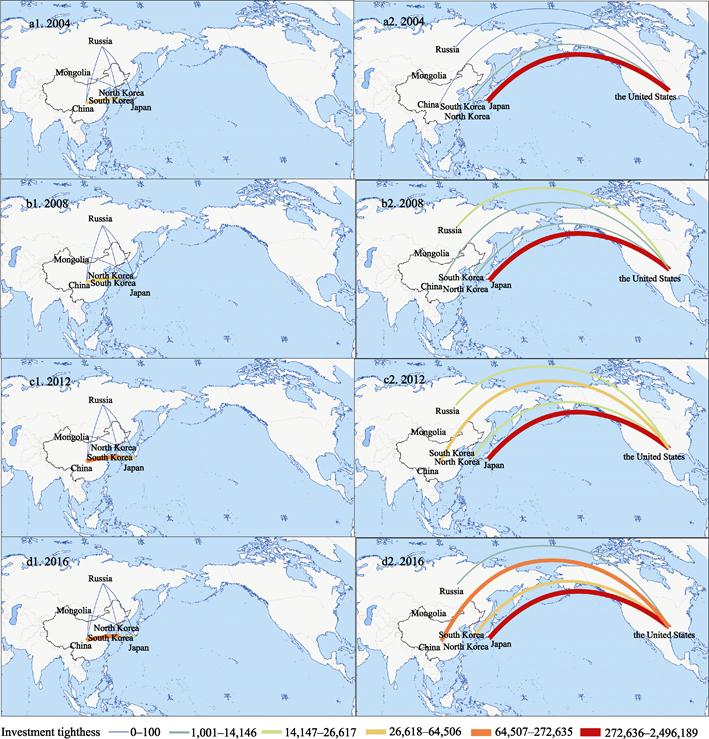
Figure 2
Spatio-temporal evolution of the investment
tightness between the US and Northeast Asian nations during 2004?C2016
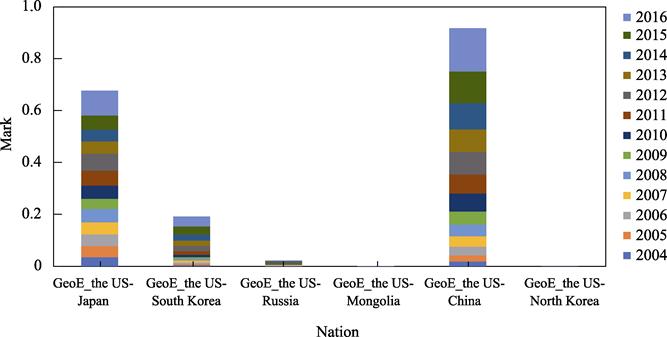
Figure 3 Geo-economic streaming potential between the US
and Northeast Asian nations during 2004?C2016
5 Conclusion
This dataset uses flow data, introduces the spatial
connection strength model and static potential energy formula, and evaluates
geo-economic relations from the two perspectives of trade and investment. The
improved geo-economic flow potential model based on the static potential energy
formula can describe the strength and dynamic changes of ??flow?? within
geo-economics well, and the channel index in the model is also an important
factor to modify the spatial distance across a geo-economy. In evaluating
geo-economic flow, the product of trade and investment flow is also selected
because there is no relevant method or associated research to determine the
weight of investment and trade in geo-economic relations. Calculating the
product makes the two mutually weighted, thus achieving the effect of
comprehensive evaluation of geo-economic relations.
At present, the model used in this dataset can only analyze
the geo-economic relationship between two nations, while there are still some
deficiencies in the study of trilateral or multilateral relations. At the same
time, although the quantitative model was verified through its usage, its
potential for universal applicability needs to be further tested, and the
weight of investment and trade also needs to be further studied.
Author Contributions
Ge, Y. J. and Ma, T. designed the overall dataset development; Ma,
T. collected the statistical data; Ma,
T. designed the model; Li, Y. J.
wrote the paper.
Conflicts of Interest
The authors declare no
conflicts of interest.
References
[1]
Wang, L. M., Mou, Ch. F., Lu, D. D. Changes in driving forces of
geopolitical evolution and the new trends in geopolitics studies [J]. Geographical
Research, 2016, 35(1): 3?C13
[2]
Ni, Sh. X. China??s Geopolitics and its Strategic Studies [M].
Beijing: Economic Science Press, 2015: 23?C25.
[3]
Luttwak, E. N. From geopolitics to geo-economics: logic of
conflict, grammar of commerce [J]. National Interest, 1990, 20(20): 17‒23.
[4]
Luttwak, E. N. Turbo Capitalism, Winners and Losers in the Global
Economy (Trans. by Chu, L. Y.) [M]. Beijing: Guangming Daily
Publishing House, 2000.
[5]
Li, D. R. Theoretical schools and development trend of
geo-economics [J]. Journal of Zhongnan University of Economics & Law, 2009(1): 26?C29, 111.
[6] Geoffrey, P. Geopolitics: Past, Present and Future (Trans.
by Liu, C. D.) [M]. Beijing: Xinhua Press, 2003.
[7]
Keohane, R. O., Nye, J. S. Power and Interdependence [M]. Boston:
Little, Brown, 1977.
[8]
Mead, W. R. America??s Sticky Power [Z]. Foreign Policy, 2004.
[9]
Ma, T., Li, Y. J., Ge, Y. J. Geo-economic relation dataset between
US and Northeast Asia nations (2000?C2016) [J/DB/OL]. Digital
Journal of Global Change Data Repository, 2021. https://doi.org/10.3974/geodb.2021.03.02.V1. https://cstr.escience.org.cn/CSTR:20146.11.2021.03.02.V1.
[10]
GCdataPR Editorial Office. GCdataPR data sharing policy [OL]. https://doi.org/10.3974/dp.policy.2014.05 (Updated
2017).
[11]
Xi, G. L., Zhen, F., Zhang, M., et al. Spatio-temporal evolution and regional connection of online
consumption: a case study on Jingdong Mall [J]. Scientia Geographica Sinica,
2015, 35(11): 1372?C1380.
[12]
Sun, L. J., Sun, L. X. Market openness and economic fluctuation:
the case of East Asia and China [J]. Economic Research Journal, 2005(6):
69?C81.
[13]
Zilibotti, F. Growing and slowing down like China [J]. Journal
of the European Economic Association, 2017, 15(5): 943?C988.