Livestock
Sampling Survey Dataset Development of Prairie Chenbarhu Banner in Hulunbuir
City Based on UAV Images
Wang, D. L.1*
Chen, W. B.1,2 Zhang, A. C.1
1. Key
Laboratory of Land Surface Pattern and Simulation, Institute of Geographic
Sciences and Natural Resources Research, Chinese Academy of Sciences
(IGSNRR/CAS), Beijing 100101, China;
2. College
of Surveying and Spatial Information Engineering, East China University of
Technology, Nanchang 330013, China
Abstract: Livestock
population surveys are essential for grassland management jobs, such as health
and epidemic prevention, grazing prohibition, rest grazing, and
forage-livestock balance assessment, which is closely related to the modern
transformation and upgrading of animal husbandry, and the sustainable
development of grasslands. In July 2023, a UAV-based survey was conducted in
Chenbarhu banner, Hulunbuir city. A total of 48 flights captured 45,254 images.
The UAV image tiles were then mosaicked to obtain flight strips that were
visually interpreted to label livestock. Finally, the population sizes of
sheep, cattle, and horse in the entire Chenbarhu banner were estimated
according to their population densities in flight strips. The dataset includes:
(1) boundary data of the study area; (2) boundaries of the sample strips
surveyed by UAV in 2023; (3) location of livestock surveyed in 2023; (4)
estimated livestock population size. The dataset is archived in .shp and .tif
formats, and consists of 49 data files with data size of 12.5 MB (Compressed into
one file with 4.19 MB).
Keywords: sampling
survey; UAV imagery; livestock;
visual interpretation
DOI: https://doi.org/10.3974/geodp.2023.03.12
CSTR: https://cstr.escience.org.cn/CSTR:20146.14.2023.03.12
Dataset Availability Statement:
The
dataset supporting this paper was published and is accessible through the Digital
Journal of Global Change Data Repository at: https://doi.org/10.3974/geodb.2023.12.02.V1
or https://cstr.escience.org.cn/CSTR:20146.11.2023.12.02.V1.
1
Introduction
China
is a major nation in grassland animal husbandry, grassland animal husbandry constitutes an important component of agricultural
production[1]. Accurate and timely livestock data is the basic data
for grassland management such as health and epidemic prevention, grazing prohibition,
rest grazing, and forage-livestock balance assessment. These data play a
crucial role in the rational utilization of grassland resources, ensuring a
stable supply of meat products, and mitigating the adverse ecological impacts
of overgrazing[2].
Traditional animal
population surveys typically employ ground surveys, allowing for close
observation of animal behavior and quantity, as well as the collection of
animal traces and forage samples. However, ground surveys are inefficient,
costly, prone to repetitive results, and may be restricted by terrain[3].
Due to the low resolution of satellite imagery, satellite surveys are mainly
used for monitoring and assessing suitable habitats, grass production, and
ecological capacity for wildlife[4], and could not be used to directly
observe small-sized livestock and juvenile individuals. UAVs equipped with high-resolution
cameras have been used to quickly and accurately capture small-sized livestock
and juvenile individuals, and then count the numbers of livestock[5].
Chenbarhu banner is a traditional animal husbandry area with animal husbandry
as the basic industry, covering an area of 17,458 km2.
The available livestock data in Chenbarhu banner are mainly ground-based
statistical data, which is laborious and costly. The timeliness of the
statistical data is poor. In this study, a fixed-wing UAV was used to capture
imagery for livestock surveys in Prairie Chenbarhu banner from July 13 to 26,
2023. Livestock were then labeled in the flight strips that were mosaicked from
UAV image tiles. Finally, the livestock population sizes of sheep, cattle, and
horses were estimated according to their population densities in flight strips.
This study provides a scientific basis for local animal husbandry production
and grassland management.
2 Metadata of the Dataset
The
metadata of livestock sampling survey dataset of Prairie Chenbarhu banner in
Hulunbuir city based on UAV images (July 2023)[6] is summarized in Table 1. It
includes the dataset full name, short name, authors, year of the dataset,
spatial resolution, data format, data size, data files, data publisher, and
data sharing policy, etc.
3 Study Area
Chenbarhu
banner (Figure 1) is located in the juncture of Great Khingan and Hulunbeier
upland plain in the northwest of Hulunbeier city, Inner Mongolia autonomous region.
It is the main part of Hulunbeier grassland, located at 48??48??N-50??12??N and 118??22??E-121??02??E,
and belongs to the semi-arid continental climate in the middle temperate zone,
with an annual average temperature of –2.5 ?? and an annual average precipitation ranging from
300 to 550 mm[8]. The terrain is relatively flat, with an average
elevation ranging from 600 to 800 m. and it is an animal husbandry banner with
Mongolian as the main body. The population of the banner
is 58,000. The banner??s land covers include temperate steppe, temperate
meadow-steppe, sandy meadow, mountain meadow, and lowland meadow for haymaking,
occupying a total area of 18,600 km2. The banner is dominated by
grasslands, covering 85% of the total area (15,800 km2). The banner is also the hometown and main breeding
base of Sanhe horse and Sanhe cattle, and it is one of the most important
animal husbandry production bases in Hulunbeier city. The main livestock types
include cattle, sheep and horses.
Table 1 Metadata summary of Livestock
sampling survey dataset in Prairie Chenbarhu banner, Hulunbuir city
|
Items
|
Description
|
|
Dataset full name
|
Livestock
sampling survey dataset in Prairie Chenbarhu banner, Hulunbuir based on UAV
images (July 2023)
|
|
Dataset short
name
|
Chenbuerhuqi_UAVlivestock
|
|
Authors
|
Wang, D. L.
0000-0002-1377-8394, IGSNRR/CAS, wangdongliang@igsnrr.ac.cn
Chen, W.B.
0009-0009-9608-1717, IGSNRR/CAS, 976101217@qq.com
Zhang,A.C.
0009-0009-5617-657, IGSNRR/CAS, zhangaochong0013@igsnrr.ac.cn
|
|
Geographical
region
|
Prairie Chenbarhu
banner, Hulunbuir city: 48??48??N-50??12??N, 118??22??E-121??02??E
|
|
Year
|
July 13-26, 2023
|
|
Spatial
resolution
|
3-5 cm
|
|
Data format
|
.shp, .tif
|
Data size
|
12.5 MB
|
|
Data files
|
boundary data of the study area, boundaries of the sample strips
surveyed by UAV in 2023, location of livestock surveyed in 2023,estimated
livestock population size
|
|
Foundations
|
Chinese Academy
of Sciences (XDA23100200); Ministry of Science and Technology of P. R. China
(2021YFD1300501)
|
|
Data publisher
|
Global Change Research Data Publishing & Repository,
http://www.geodoi.ac.cn
|
|
Address
|
No. 11A, Datun
Road, Chaoyang District, Beijing 100101, China
|
|
Data sharing
policy
|
(1) Data are openly available and can be free downloaded via the
Internet; (2) End users are encouraged to use Data subject to
citation; (3) Users, who are by definition also value-added service
providers, are welcome to redistribute Data subject to written permission
from the GCdataPR Editorial Office and the issuance of a Data redistribution
license; and (4) If Data are used to compile new
datasets, the ??ten per cent principal?? should be followed such that Data
records utilized should not surpass 10% of the new dataset contents, while
sources should be clearly noted in suitable places in the new dataset[7]
|
|
Communication and
searchable system
|
DOI, CSTR, Crossref, DCI, CSCD, CNKI,
SciEngine, WDS/ISC, GEOSS
|

Figure 1 Geo-location of
the study area (a), flight path (b), UAV (c) and sensor photo (d)
4 Data Sources and Acquisition
Methods
4.1 UAV Data Acquisition
From
July 13 to July 26, 2023, 45 UAS flights under vertical over-looking attitude
was conducted over Prairie Chenbarhu banner, as shown in Figure 1b. The
campaign captured 45,254 images covering an effective aerial surveying area of
approximately 526.24 km2. The flight altitude was 300 m above the
take-off location. The image resolution of each image ranged from 3 to 5 cm.
The total data size is 727 GB. These images were acquired by a fixed-wing UASs,
as shown in Figure 1c. The endurance of the fixed-wing UAS employed in this
study is 120 min flying at an altitude of 500 m with a cruising speed of 76
km/h. The UAV was mounted with a Sony RX1R II
camera that has effective pixels of 42.4 million (7952??5304) and a sensor size
of 35.9 ?? 24.0 mm, as shown in Figure 1d. The survey employs a systematic
sampling method with a sampling intensity of 2.15%.
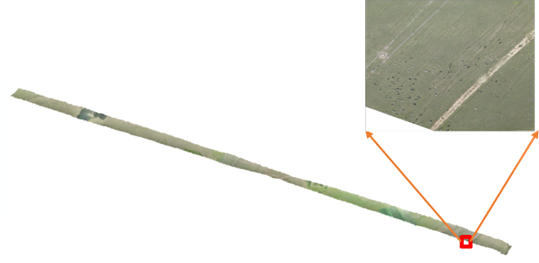
Figure 2 Example of a flight strip
mosaicked with UAV image tiles
4.2 UAV Image Mosaicking
Photoscan
was used to mosaick the UAV image. A total of 83 flight strips were generated,
and covered approximately 526.24 km2. One of the flight strips is
shown in Figure 2.
4.3 UAV Image
Interpretation
The
visual interpretation method is one of the classic and widely used
interpretation methods in the field of remote sensing[9]. Visual
interpretation was utilized to determine the position and type of livestock in
ArcGIS.
4.4 Population
Estimation Method
The population sizes of sheep, cattle, and
horses were estimated for Chenbarhu banner according to their population
densities in flight strips, as expressed by:
 (1)
(1)
where,
 ——the
population of the ith kind of livestock in the surveyed area.
——the
population of the ith kind of livestock in the surveyed area.
 ——the
population of the ith kind of livestock in the sampled strip.
——the
population of the ith kind of livestock in the sampled strip.
 ——the total
area of all surveyed strips.
——the total
area of all surveyed strips.
 ——the total
area of the surveyed region.
——the total
area of the surveyed region.
5 Data Results and Validation
5.1 Data Composition
The dataset includes: (1) boundary data of
the study area; (2) boundaries of the sample strips surveyed by UAV in 2023;
(3) location of livestock surveyed in 2023; (4) estimated livestock population
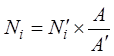
size. The boundaries of flight strips and locations of livestock within the
flight strips are shown in Figure 3.
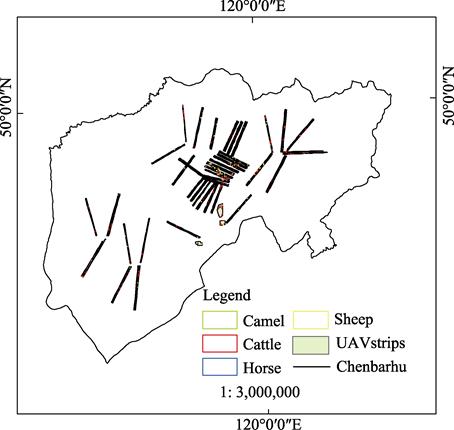
Figure 3 The distribution map of
livestock in Prairie Chenbarhu banner
5.2 Data
Products
5.2.1
Analysis of Livestock Strip Results in Prairie
Chenbarhu banner, Hulunbuir City
(1) Livestock numbers and densities within
flight strips. In the 2023 UAV flight strips, 52,171 livestock, including 38,956
sheep, 10,655 cattle, 2,560 horses and 25 camels, were found. The animal
densities across the flight strips averaged 74.02 sheep/km2, 18.33
cattle/km2, 4.40 horses/km2, and 0.047 camels/km2,
respectively.
(2) Group sizes
within flight strips. In the 2023 UAV flight strips, 128 cattle herds, 88 sheep
herds, 74 horse herds, 2 camel herds were found. The group size of cattle, sheep,
horse, and camel herd across the flight strips averaged 83, 641, 34, and 12.5 individuals,
respectively. Among 128 cattle herds, there are 30 herds with less than 20
individuals, accounting for 23.45% of the total herds; 85 herds had 20-200 individuals, representing 66.40% of the total herds; and 13
herds had over 200 individuals, constituting 10.15% of the total herds. Among
88 sheep herds, 18 herds had fewer than 100 individuals, representing 20.45% of
the total herds; 48 herds had 100-1,000
individuals, accounting for 54.55% of the total herds; and 22 herds had over
1,000 individuals, making up 25% of the total herds. Among 74 horse herds, 14
herds had fewer than 10 individuals, accounting for 18.92% of the total herds;
54 herds had 10-80 individuals, representing 72.97% of
the total herds; and 6 herds had over 80 individuals, constituting 8.10% of the
total herds. 13 and 12 individuals were found in 2 camel herds, respectively.
The group size frequency histograms for cattle, sheep, and horses are shown in
Figure 4.
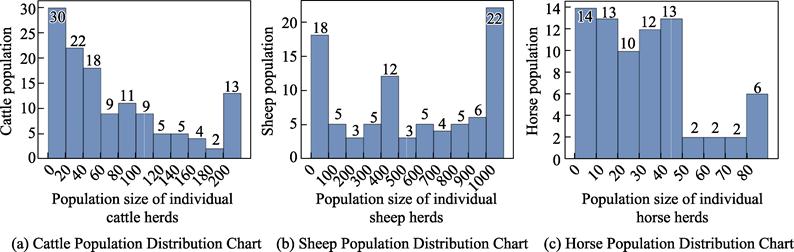
Figure 4 Population size
frequency histogram: (a) cattle, (b) sheep, and (c) horses
5.2.2 The Estimation and Validation of Livestock Population in Chenbarhu Banner
(1)
The population size of each kind of livestock across the entire Chenbarhu banner
was estimated using Equation (1). Chenbarhu banner has an area of 17,938.1 km2.
We estimated approximately 1,924,501 sheep, 363,200 cattle, and 87,263 horses
in Chenbarhu banner. The corresponding sheep unit was 4,176,816 (assuming that
one cattle and horse equals a 5 sheep unit equivalence).
(2) The livestock
population sizes estimated using UAV imagery were then compared with counts
from statistical yearbook 2022[10]. The statistical yearbook 2022
showed 1,234,406 sheep and 222,855 large livestock (cattle and horses) in Chenbarhu
banner in June, 2021(Table 2). The corresponding sheep unit was 2,348,681.
Compared to the ground-based statistical count, the UAV image counts deviated
in sheep and large livestock (cattle and horses) quantity by 55.9% and 102.1%,
respectively.
Table 2 Livestock population sizes estimated
using UAV imagery and statistical data for Chenbarhu banner
|
Livestock
|
Population sizes estimated using UAV imagery (July
2023)
|
Population sizes from statistical data (June, 2021)
|
Deviations between UAV image estimates and
statistical data
|
Relative deviations between UAV image estimates and
statistical data (%)
|
|
Sheep
|
1,924,501
|
1,234,406
|
690,095
|
55.91%
|
|
Large livestock
(cattle and horse??
|
450,463
|
222,855
|
227,608
|
102.13%
|
|
Sheep unit total
|
4,176,816
|
2,348,681
|
1,828,135
|
77.84%
|
6 Discussion and Conclusion
A
UAV-based livestock survey was conducted in Chenbarhu banner, Hulunbuir city in
July, 2023 and 45,254 UAV aerial images were mosaicked into 82 flight strips.
In the 82 UAV flight strips, 52,171 livestock, including 38,956 sheep, 10,655 cattle,
2,560 horses and 25 camels, were found. We estimated approximately 1,924,501
sheep, 363,200 cattle, and 87,263 horses in Chenbarhu banner according to the
livestock densities. Compared to the ground-based statistical count, the UAV
image estimates deviated in sheep and large livestock (cattle and horses)
quantity by 55.9% and 102.1%, respectively. The discrepancies between estimated
sheep inventory and statistical data were 55.9% and 35.8%. The discrepancies between
estimated large livestock (cattle and horses) and statistical data were 102.1%
and 76.2%, respectively. Such significant deviations may attribute to inter-
and intra-annual variations because of natural disasters and human factors, and
uneven distribution of UAV flight paths and the simple estimation method may
also result in inaccurate estimation. Additionally, the statistical data may
also have significant biases. Thus, comparisons of population sizes between UAV
image estimates and statistical data in different years have great uncertainty.
These UAV-based estimates provided better understanding livestock resources in
Chenbarhu banner.
Compared to
traditional ground-based statistical methods, UAV can be used for large-scale
livestock surveys in the shorter time and at the lower labor cost. However, UAV
survey may be affected by adverse weather conditions. On the other hand, the
use of visual interpretation methods is susceptible to subjective judgments. Different observers may interpret the same image or
scene with different results. Therefore, automatic recognition algorithms
should be introduced in the future which will allow the higher frequency of
counts for large areas both within and between years and provide more
consistent and objective results. Furthermore, significant deviations were
observed between UAV image estimates and statistical data. We will collaborate
with relevant statistical departments to investigate the reasons behind these
deviations, aiming to improve the accuracy and reliability of UAV-based
estimates.
Author Contributions
Zhang,
A. C. was responsible for unmanned aerial vehicle (UAV) image acquisition and
processing. Wang, D. L. undertook the overall design of the dataset
development, and Chen,W. B. along with Zhang, A.C. marked the sample dataset
and wrote the paper.
Acknowledgements
The authors would like to express their sincere
gratitude to Hulunbuir Youran Animal Husbandry Demonstration Farm Co.,
Ltd. for their generous support. Special thanks to Li Shenlong and others,
along with the assistance of local staff and members of the research team, for
their efforts in collecting and processing the UAV images
Conflicts of Interest
The
authors declare no conflicts of interest.
References
[1]
Thornton, P. K. Livestock
production: recent trends, future prospects [J]. Philosophical Transactions of the Royal Society B: Biological Sciences, 2010, 365(1554):
2853–2867.
[2]
Harris,
P., Brunsdon, C., Charlton, M. Geographically weighted principal components
analysis [J]. International Journal of Geographical Information Science, 2011, 25: 1717–1736.
[3]
Shao,
Q. Q., Guo, X. J., Li, Y. Z., et al.
Using UAV remote sensing to analyze the population and distribution of large
wild herbivores [J]. Journal of Remote
Sensing, 2018, 22(3): 497–507. DOI: 10.11834/jrs.20187267.
[4]
Liu, S. L., Zhao, H. D., Dong,
S. K., et al. Dynamic of vegetation
in the Altun mountain nature reserve based on SPOT NDVI [J]. Arid Zone Research, 2014, 31(5):
832–837.
[5]
Cao, N., Xi, R. N., He, L. N., et al. The Application Prospects and
Challenges of UAV in Livestock Farming [J]. Today Animal Husbandry and Veterinary Medicine, 2023, 39(7): 53–55.
[6]
Wang,
D. L., Chen, W. B., Zhang, A. C. Livestock sampling survey dataset in Prairie
Chenbarhu banner, hulunbuir based on UAV images (July 2023) [J/DB/OL]. Digital Journal of Global Change Data
Repository, 2023. https://doi.org/10.3974/geodb.2023.12.02.V1.
https://cstr.escience.org.cn/CSTR:20146.11.2023.12.02.V1.
[7]
GCdataPR Editorial Office.
GCdataPR data sharing policy [OL]. https://doi.org/10.3974/dp.policy.2014.05
(Updated 2017).
[8]
Nie, H., Yue, L., Yang, W., et al. Present situation, evolution
trend and causes of sandy desertification in Hulunbuir steppe [J]. Journal of Desert Research, 2005, 25(5):
635–639.
[9]
Zhou,
Z. W. Monitoring of marine macro-plastic litter in the coastal zone based on
UAV remote sensing and computer interpretation [D]. Shanghai: East China Normal
University, 2022. DOI: 10.27149/d.cnki.ghdsu.2022.001948.
[10]
Hulunbuir Bureau of Statistics.
Hulunbuir statistical yearbook 2022 [OL].
http://tjj.hlbe.gov.cn/ News/show/1037849.html.