Temperature Vegetation Dryness Index 1-km Grid Dataset in
Heilongjiang River Basin (2007-2018)
Zhou, Y. Z.1,2 Wang. J. L.1,3* Li, K.1,2
1. State Key Laboratory of Resources and Environmental
Information System, Institute of Geographic Sciences and Natural Resources
Research, Chinese Academy of Sciences, Beijing 100101, China;
2. College of Geoscience and Surveying Engineering, China
University of Mining & Technology (Beijing), Beijing 100083, China;
3. Jiangsu Center for
Collaborative Innovation in Geographical Information Resource Development and
Application, Nanjing 210023, China
Abstract: Temperature
Vegetation Dryness Index??TVDI??is the metric parameter which can
estimate the status of land surface soil moisture so as to reflect the drought
level of the region. The area covered by this dataset is
Heilongjiang River basin, the time series is from April to October (Vegetation
growing season) during 2007-2018. The dataset is obtained by the combination
formed by TVDI calculation model and the data of monthly normalized
differential vegetation index (NDVI) MODIS13A3, 8-day synthesized land surface
temperature (LST) MOD11A2 and ASTER-DEM data. The dataset is
in GeoTiff format, with a spatial resolution of 1 km and consists of 84 files,
the data size is 362 MB.
Keywords: Heilongjiang River basin; Growing season; Temperature Vegetation
Dryness Index; General NDVI-LST feature space
DOI: https://doi.org/10.3974/geodp.2021.03.11
CSTR: https://cstr.escience.org.cn/CSTR:20146.14.2021.03.11
Dataset Availability Statement:
The dataset
supporting this paper was published and is accessible through the Digital Journal of
Global Change Data Repository at: https://doi.org/10.3974/geodb.2021.05.02.V1 or
https://cstr.escience.org.cn/CSTR:20146.11.2021.05.02.V1.
1 Introduction
The Heilongjiang
River basin located in the northeastern Asia (Figure 1). The basin is converged
by two sources of Argun river (south) and Shilka river (north) in the west of
Mohe county, Heilongjiang Province. After Containing several Russian
tributaries named Zeya, Bureya and Amgun with Chinese tributaries named Songhua
and Ussuri, the basin finally afflux into Tartar Strait. The area of basin is
2,083,345.35 km2[1,2], It ranks 10th in the world in
terms of river basin area[1]. As one of the most important boundary
rivers in the world, its cross-border section is nearly 4,000 km and connects
15 first-level administrative regions of China, Mongolia, Russia and North
Korea. Therefore, the changes in its internal resources and environment have a
significant impact on the ecological development of the regions along the
economic corridor of China, Mongolia and Russia. In recent years, drought
events occurred frequently in various regions of the basin, which increased the
risk to various fields, especially food security in the areas along the river[3?C5].
Through multi-source data and scientific research methods, long-term drought
monitoring was carried out along the Heilongjiang River basin, this will help to provide scientific reference and
basic support for the implementation of drought prevention and future risk
assessment in this basin, and contributing to cooperative control and
international cooperation of managing the dryness disaster events in the areas
which covered by the catchment.

Figure 1 Geographical location and elevation
classification of Heilongjiang River basin
Drought monitoring
and early warning have gradually become a hot topic of concern and research in
academic circles in recent years. The early research method in this field is to
collect meteorological, hydrological, and soil moisture data such as
precipitation, temperature, evapotranspiration, and shallow soil moisture
monitored by the site, and perform statistical analysis based on various
drought evaluation indicators to quantify the degree of drought in the study
area[6]. Because the site is affected by factors such as natural
environment and economic costs, the monitoring data size is limited and the
spatial distribution is uneven. Therefore, the quality of the results obtained
by the site data in the process of monitoring drought is affected in terms of
time, space, and efficiency. The mature development of related technologies in
the field of remote sensing makes it possible to integrate research with
traditional methods. The new method can efficiently, objectively, and
economically complete the extraction of aridification information in a
multi-scale range [7]. In the drought monitoring and evaluation
based on remote sensing technology, the correlation index with vegetation index
and surface temperature as evaluation factors is more common[8].
Among them, the Temperature Vegetation Dryness Index (TVDI) was originally
proposed by Sandholt et al.[9].
The principle of the index model is to estimate the soil surface moisture
status based on the correlation between the vegetation index and the surface
temperature and then reflect the area in which it is located the degree of
drought[10]. Relevant scholars have used the index to conduct a
large number of drought monitoring applications at the geographic unit level,
national level, regional level, provincial and municipal level, and other
spatial scales. For example, Cao et al.[11]
and others have used the TVDI method to monitor the Mongolian Plateau for
nearly 40 years of long-term drought monitoring.
The results show
that using of this index can effectively reflect the drought and its evolution
characteristics in large-scale areas[11]. Cong et al. [12] conducted a combined analysis based on the
calculation results of the TVDI and the 10 cm soil moisture data monitored by
the site and verified that it is feasible to use this index to monitor the
dynamic drought of the whole year in Northeast China. Qin et al. [13] used TVDI to monitor and evaluate the
drought characteristics of the growing season in Inner Mongolia since 2000 and
combined the temperature and precipitation in the corresponding period to
discuss the trend and magnitude of the impact of changes in climatic conditions
during the period. However, when the TVDI is used to monitor drought in
large-scale areas, due to the influence of surface elevation fluctuations and
excessive longitude and latitude spans, there is a large deviation between the
surface temperature data and the actual situation, which affects the evaluation
effect of the corresponding feature space and reduces the accuracy of inversion
of surface soil moisture data by TVDI[14].
In response to
this, Liu et al. [15] used
the digital elevation data of the study area and carried out a topographic
correction on Ts in the process of constructing a variety of common vegetation
index (VI)??surface temperature (Ts) feature spaces, which reduced the influence
of terrain factors on the surface energy balance, and significantly improves
the effect of inversion of soil surface moisture in large-scale areas based on
the TVDI.
2 Metadata of the Dataset
The metadata summary of the dataset[16] is
summarized in Table 1, which includes the dataset full name, short name,
authors, year, temporal resolution, spatial resolution, data format, data size,
data files, publisher, and sharing policies, etc.
3 Methods
Remote sensing data prepared for the dataset include
the products of monthly normalized differential vegetation index (NDVI)
MODIS13A3[18] and 8-day synthesized land surface temperature (LST)
MOD11A2[19], the temporal extent is from April to October
(Vegetation growing season) during 2007-2018 (NDVI class include the
data from day 97 of the year 2000 to day 305 of the year; LST class include the
data from day 89 of the year 2000 to day 305 of the year). The row and column
number of Images include h24v03, h25v03-04, h26v03-04 and h27v04. The elevation
data include elevation Cluster dataset covering the Heilongjiang River basin[20].
Meteorological data include the dataset of remote-sensing- based surface soil
moisture[21] and monthly precipitation data, 10-day soil-moisture
data counted by the sites[22,23].
3.1 Algorithm Principle
Temperature Vegetation Dryness Index (TVDI) is a kind
of method for monitoring soil moisture based on NDVI-LST feature space[9],
Its calculation formula is as follows:
Table 1 Metadata summary of the Temperature
vegetation dryness index 1-km grid dataset in Amur River basin (2007??2018)
|
Item
|
Description
|
|
Dataset full name
|
Temperature vegetation dryness index 1-km grid dataset in Amur
River basin (2007-2018)
|
|
Dataset short name
|
TVDI_AmurRiverBasin_2007-2018
|
|
Authors
|
Zhou, Y. Z., Institute of Geographic Sciences and Natural Resources
Research, zhouyz@lreis.ac.cn
Wang, J. L. R-8881-2016, Institute of Geographic Sciences and Natural Resources Research,
wangjl@igsnrr.ac.cn
|
|
Geographical region
|
Heilongjiang River basin: 41??42¢N‒55??56¢N, 107??31¢E‒141??14¢E, Including15 first-level
administrative regions of China, Mongolia, Russia and North Korea
|
|
Year
|
2007?C2018
|
|
Temporal resolution
|
Monthly
|
|
Spatial resolution
|
1 km
|
|
Data format
|
.tif
|
|
Data size
|
319 MB (after compression)
|
|
Data files
|
84 monthly temperature
vegetation dryness index data files, the format of filename is
TVDI.YYYYMM.1_km_monthly.tif
|
|
Foundations
|
Special Exchange Program of Chinese Academy of Sciences
(Y9X90050Y2); China Knowledge Center for Engineering Sciences and Technology
(CKCEST-2021-2-18)
|
|
Computing environment
|
ENVI, ArcGIS
|
|
Data publisher
|
Global Change Research Data Publishing & Repository,
http://www.geodoi.ac.cn
|
|
Address
|
No. 11 A Datun Road, Chaoyang District, Beijing 100101, China
|
|
Data sharing policy
|
Data from
the Global Change Research Data Publishing & Repository includes metadata, datasets (in the Digital Journal of Global Change Data Repository), and
publications (in the Journal of Global Change Data & Discovery). Data sharing policy
includes: (1) Data are openly available and can be free downloaded via the
Internet; (2) End users are encouraged to use Data subject to
citation; (3) Users, who are by definition also value-added service
providers, are welcome to redistribute Data subject to written permission
from the GCdataPR Editorial Office and the issuance of a Data redistribution
license; and (4) If Data are used to compile new
datasets, the ??ten per cent principal?? should be followed such that Data
records utilized should not surpass 10% of the new dataset contents, while
sources should be clearly noted in suitable places in the new dataset[17]
|
|
Communication and searchable system
|
DOI, CSTR, Crossref, DCI, CSCD, CNKI, SciEngine, WDS/ISC, GEOSS
|
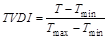 (1)
(1)
 (2)
(2)
 (3)
(3)
where T is the surface temperature of any
pixel, and Tmax and Tmin are respectively
the lowest and the highest surface temperatures corresponding to a certain
NDVI, a, b, c,
d are respectively the undetermined coefficients and the value range
of TVDI is [0, 1].
In the NDVI-LST theorical feature space, when the land cover
conditions in the study area meet the conditions from bare land to full
vegetation, and the soil water content meet the conditions from complete
drought to full water storage, the scatter plot of
this index approximately turn to triangular or trapezoidal [24]. But
in the actual cases, for the land cover types of monitoring area and various
aspects of other factors, physical condition often cannot completely satisfy
the terms needed for theoretical feature space, and therefore in the process of
feature space construction based on single-period remote sensing image, scatter
data of the dry and wet edges cannot completely cover the theoretical feature
space boundary. In view of this problem, the
land cover and soil water content in the monitoring area will change greatly in
a long time series. Therefore, the general feature space was built by extreme
value composite method based on long-time contemporaneous data, the building
scheme can include areas within different period of land cover changes and soil
moisture, so as to approximately get the setting conditions of land surface
coverage and water content in the theoretical feature space. This measure can
effectively improve the low feedback to drought conditions.
According to the above theories, several scholars have
verified the feasibility and superiority of the scheme on drought monitoring in
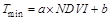
different regions[24,25]. In this study, correlation analysis was
conducted between the mean 10-cm soil moisture values and the calculation based
on the single and general feature space in representative months of the growing
season (April, July and October) in domestic provinces (Heilongjiang, Jilin and
Inner Mongolia) during 2007-2012 (Figure 2).
Figure 2 Comparison of correlation results based
on single/general feature space
The results showed that: the correlation coefficient of
single feature space is 0.352,5 at the minimum and 0.399,4 at the maximum. In
comparison, the results of general feature space increased in the same period,
with the minimum value being 0.397,1 and the maximum value being 0.414,3. The
TVDI results were more strongly correlated with the measured values than using
single feature space. In this study, the changes of LST extreme values based on
general feature space method and the dry-wet edge fitting equations are shown
in Table 2 and Figure 3.
Table 2 Monthly
dry-wet edge fitting equations in Heilongjiang River basin
|
Month
|
Dry edge fitting equations
|
Wet edge fitting
equations
|
|
April
|
y
= ‒20.234x + 52.094
|
y
= 12.216x ‒ 6.9245
|
|
May
|
y
= 11.838x ‒ 6.7406
|
y
= 11.441x ‒ 2.8382
|
|
June
|
y
= ‒6.7647x + 54.671
|
y
= 0.7518x + 12.232
|
|
July
|
y
= ‒11.188x + 62.355
|
y
= ‒3.6056x +21.516
|
|
August
|
y
= ‒20.381x + 68.587
|
y
= ‒3.8234x + 22.905
|
|
September
|
y
= ‒6.9896x + 40.358
|
y
= 8.3332x ‒ 8.3254
|
|
October
|
y
= ‒12.249x + 26.295
|
y
= 4.1039x ‒ 18.233
|
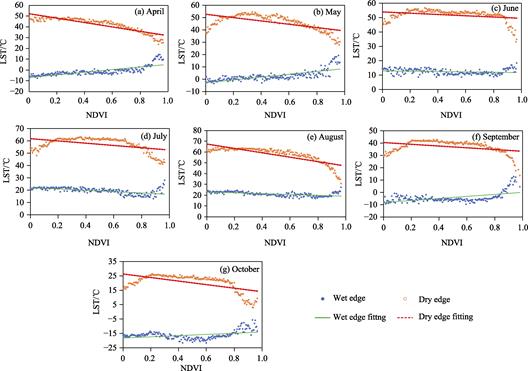
Figure 3 The general feature space of growing
season in Heilongjiang River basin
3.2 Technical Route
Data processing progress includes original NDVI and
LST data preprocessing, spatio-temporal sequence reconstruction, NDVI-LST
general feature space building and evaluation of TVDI calculation results (Figure
4).
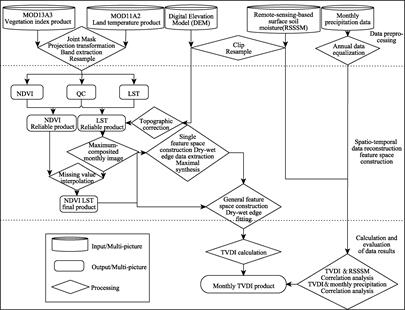
Figure 4 Flowchart of the TVDI research
algorithms
Data
preprocessing is mainly composed of fractional data splicing, projection
conversion, band extraction and pixel resampling. The reconstruction
of spatio-temporal data series includes spatial interpolation, terrain
correction, time-series completion and unification. The part of general feature
space construction mainly includes the extraction of dry and wet points
in single space and the extreme value composite of the general dry and wet
edges. TVDI calculation and evaluation is to analyze the correlation between
the calculation results with meteorological data in the study area to verify
its monitoring applicability.
(1) Data preprocessing
For the remote
sensing data products obtained in this dataset, the data format of vegetation
index and land surface temperature products is .hdf, and the projection method
is sinusoidal projection. In order to directly reflect the information
contained in the two types of data, we set relevant parameters in the MODIS
Rejection Tool (MRT), convert the projection to the geographical type based on
WGS 84, The nearest neighbor sampling method which is
suitable for continuous data resampling was selected to set the pixel size as 0.008,333,333,3
degrees (the spatial resolution after unit conversion was 1 km), and the
normalized vegetation index (NDVI), land surface temperature (LST) and the
quality control data band QC were selected. Finally, the above bands were set
as Geotiff format for output.
Based on the function of ArcPy in ArcGIS software, combined
with the boundary file of Heilongjiang River basin and the QA value of MODIS
product and the band data QC, the batch clipping and mask of above data were
carried out, and the unreliable pixels were removed to generate the
high-quality datasets in the study area.
(2) Spatio-temporal
sequence reconstruction
Data sequence reconstruction is mainly manifested in two
aspects of time and space, in time segments, the time scales of different data
are unified by the extreme value synthesis and make up the observed value
losses under the influence of the bad weather conditions. In the spatial part, we
interpolate missing or unreliable pixels and combine digital elevation model to
simulate the terrain correction so as to weaken the influence of topographic
factors on the deviation of observed values.
a) Data time-series unification
Since the temporal resolution of the final generated product
is month and the availability of LST data is greatly affected by cloud
covering, the MOD11A2 data product is converted from the original 8-day to the
monthly scale. The processing method is to assign the pixel value to the
maximum through the maximum composite method of the four images.
b) Reliable pixel value extraction and
unreliable pixel value interpolation
According to the QA value in MODIS NDVI data quality
specification and the bit flag information in LST quality control band data
(QC), the target pixels were extracted in batch by using Python language based
on the trusted pixel types specified in the above data.
For the pixel in depletion and unreliable-quality, using
condition function ??con??, judgement function ??isNull?? and statistical function
??Focal Statistics?? to do the interpolation task. The code is written as ??Con
(IsNull (??raster??), FocalStatistics (??raster??, NbrRectangle (5, 5, ??CELL??),
??MEAN??), ??raster??)??. In the sentence, the value of NbrRectangle (5, 5, ??CELL??)
is the length of a square centered on the target pixel, setting according to
the actual situation.
c) Terrain correction processing
In this part, the terrain of the study area is corrected
based on the classical C-correction model[13]. Firstly, slope and
aspect data are extracted from ENVI software using DEM data. Then, based on the
Bandmath function in the software combined with IDL language, slope matching
and correction were carried out twice for all kinds of slope areas to eliminate
the relationship deviation between the DN value of the land surface temperature
data and the solar incidence angle caused by atmospheric scattering and surface
reflected light refraction, so as to improve the data accuracy and output the
final result.
(3) NDVI-LST general feature space construction
In this part, the specific processing method is to use NDVI
and LST images in the same month of each year in the research period to
construct a monthly single feature space and extract the maximum LST values of
each point along the horizontal axis (NDVI value) with step size of 0.005 along
the dry and wet edges. Finally, these values were used as extreme values to
calculate the maximum LST values in the corresponding period of each year to
construct general feature space and generate dry and wet edge fitting
equations.
(4) The calculation and evaluation of TVDI
According to the coefficients of the dry-wet boundary and
equations (1)-(3), the monthly
TVDI in the growing season from 2007 to 2018 was calculated. Then, the
correlation analysis was conducted between the results and the measured data
related to surface soil moisture content to evaluate the quality and effect of
this data product.
4 Data Results and
Validation
4.1 Data Composition
The 1-km Grid TVDI dataset in Heilongjiang River basin
is a single wave band package of files. The data format is set as
TVDI.YYYYMM.1_km_monthly.tif, the specific respective meanings are:
(1) TVDI: represents the temperature vegetation drought index
product;
(2) YYYYMM: represents that the production
time is MM month of YYYY year;
(3) 1_km: represents that the product spatial resolution is 1
km;
(4) month:
represents that the product is monthly data. Among them, TVDI
ranges from 0 to 1, and is magnified 10,000 times during storage.
The pixel value
ranges from 0 to 10,000 and the multiplication factor is
multiplied by a scale factor of 0.000,1.
Table 3 Attribute information of the
product
|
Number
|
Attribute
|
Value
|
|
1
|
Data type
|
Unsigned int16
|
|
2
|
Row
|
4,045
|
|
3
|
Column
|
1,708
|
|
4
|
Pixel value
|
0-10,000
|
|
5
|
Pixel size
|
0.008,333,333,3,
0.008,333,333,3
|
|
6
|
Padding value
|
65,535
|
|
7
|
Applied proportionality coefficient
|
0.000,1
|
|
8
|
Coordinated system
|
WGS84
|
4.2 Data Results
The monthly drought
situation in Heilongjiang River basin during 2007-2018 is divided into 5 levels based on the calculation result
[25]: Wet (TVDIÎ[0, 0.2],
Normal (TVDIÎ(0.2, 0.4]), Slightly
drought (TVDIÎ(0.4, 0.6]), Medium drought (TVDIÎ(0.6, 0.8]), and Severe
drought (TVDIÎ(0.8, 1.0]). The measured results
are listed as below: In order to reflect the interannual variation of the drought
condition, this paper selected three periods of growing season (April-May for beginning, June-August for middle, and
September-October for end)
to make trend analysis of mean TVDI in each period.
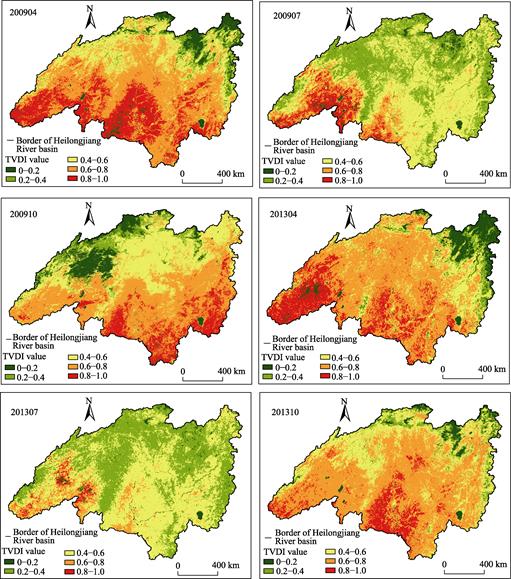
Figure 5 Drought grade distribution map of
representative month during growing season in Heilongjiang River basin based on
TVDI
4.3 Data Validation
Remote-sensing-based surface soil moisture (RSSSM)
dataset is the reversion result obtained by the fusion of various active and
passive microwave remote sensing data. The data accuracy is at the same level
as the current optimal remote sensing Soil water data
product, Soil Moisture Active Passive (SMAP) [26]. Therefore, RSSSM
and the precipitation data monitored by 50 meteorological stations evenly
distributed in the research area were selected in the quality assessment part
to conduct correlation analysis with the TVDI results (Figure 7-8).
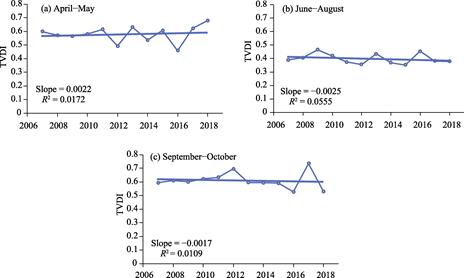
Figure 6 Interannual variation trend of mean
TVDI during different periods of growing season in Heilongjiang River basin
In
the correlation analysis between the index results and the former dataset at
pixel level, the analysis results show that the two results are negatively
correlated, the absolute value of the correlation coefficient is greater than
0.45, and all the correlations between the image points have all passed the
significance test of P<0.05. In
the correlation analysis with precipitation data, the results showed that the
TVDI of the station location was negatively correlated with precipitation, and
the maximum and minimum absolute values of the correlation coefficients were
0.558,1 and 0.129,1, respectively. The correlation analysis results of all the
data passed the significance test of P<0.01.
5 Discussion and Conclusion
Drought
monitoring for the Heilongjiang River basin, a climate-sensitive area, has very
important practical significance for the green and safe development of the
China- Mongolia-Russia Economic Corridor. For this reason, this article
combines multi-source data to construct a common feature space to calculate the
TVDI results of the 2007-2018
growing season in the region, Obtain the month-by-month drought characteristics
in this period. From the dry edge results in the general feature space of each
month, it can be seen that the surface temperature of most months in the NDVI
range of 0-0.2 ??climbs??. The reason may be that
the vegetation in these areas is too sparse, and the near-surface is covered by
wind. Natural factors, such as taking away more heat, cause the temperature to
be slightly lower than that in areas covered by vegetation. When the NDVI value
is greater than 0.8, the dry edge LST value in the feature space from June to
October has a significant downward trend, indicating that this transpiration in
areas with high vegetation coverage during the period can effectively reduce
the energy near the surface. In contrast to the wet edge equation, the general trend of surface temperature in April-May and September-October increases
with the increase of the vegetation index, while the NDVI-LST relationship is
generally negatively correlated in the middle of the growing season (June-August). The reason
for the difference between the two is related to the seasonal transpiration
capacity of vegetation and the temperature conditions of the season. It can be
seen from the inter-annual change trend of the average TVDI in each period of
the Heilongjiang River basin that the soil water content in each period in the
basin has remained stable. The index values of the initial and final periods
fluctuate around 0.6, while the mid-term index statistics approach 0.4. The
results, combined with the distribution map of the drought grades of the basin,
show that the relatively severe drought areas are mainly concentrated in the
central and southern parts of the Heilongjiang River basin.
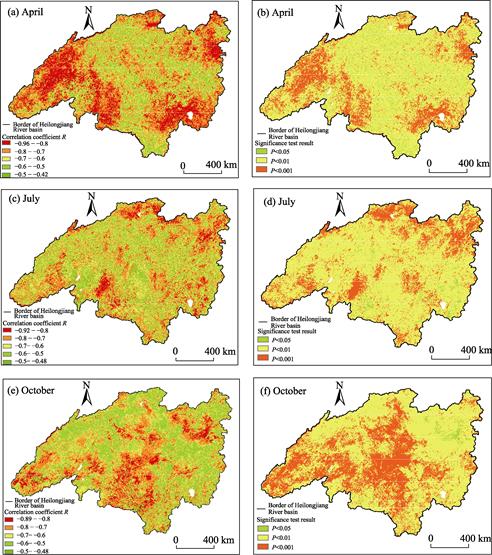
Figure 7 Correlation coefficient and
significance test results of TVDI and RSSSM
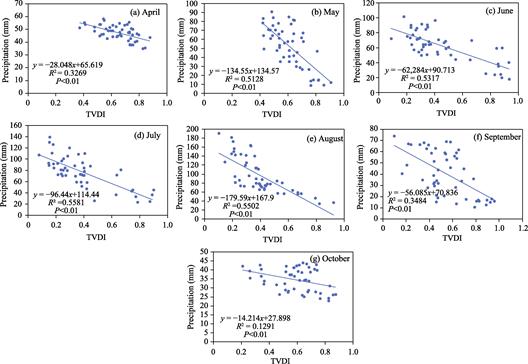
Figure 8 Correlation coefficient and significance
test results of TVDI and precipitation data
Among them, Mongolia and the border between China and
Mongolia have the highest drought grades each month. Based on the above
findings, this study provides basic reference materials for exploring the
drought characteristics of the growing season in the Heilongjiang River basin
and for the joint prevention and control mechanism of drought disasters in the
corresponding cross-border areas of China, Mongolia, Russia and North Korea.
Author Contributions
Wang,
J. L. developed the total design of the experiment and final dataset; Zhou, Y. Z.
and Li, K. are responsible for data collection, processing and verification;
Wang, J. L., Zhou, Y. Z. and Li, K. jointly wrote the paper.
Conflicts
of Interest
The authors declare no conflicts of
interest.
References
[1]
Huang, Y.
F., Li, T. J., Lv, E. Z., et al.
Boundary data of the Amur River Basin [DB/OL]. Global Change Data Repository,
2016. https://doi.org/10.3974/geodb.2016.03.11.V1.
[2]
Huang, Y.
F., Li, T. J., Lv, E. Z., et al.
Boundary data of the Amur River Basin [J]. Journal of Global Change Data & Discovery, 2017, 1(1):
114. https://doi.org/10.3974/geodp.2017.01.18.
[3]
Dai, C. L.,
Wang, S. C., Li, Z. J., et al. Review
on hydrological geography in Heilongjiang River basin [J]. Acta Geographica
Sinica, 2015, 70(11): 1823‒1834.
[4]
Haruyama,
S., Takayuki, S. Environmental Change and the Social Response in the Amur River
Basin [M]. Japan: Springer Press, 2015: 37‒38.
[5]
Yang, R.,
Li, X. Y., Mao, D. H., et al.
Examining fractional vegetation cover dynamics in response to climate from 1982
to 2015 in the Amur River Basin for SDG 13 [J]. Sustainability, 2020,
12(14): 5866.
[6]
Liu, X. F.,
Zhu, X. F., Pan, Y. Z., et al.
Agricultural drought monitoring: Progress, challenges, and prospects. [J]. Acta
Geographica Sinica, 2015, 70(11): 1835‒1848.
[7]
Liu, Q. H.,
Xin, J. F., Xin, X. Z., et al.
Agricultural drought remote sensing monitoring method based on surface
temperature and vegetation index [J]. Science & Technology Review, 2007(6): 12‒18.
[8]
Zhang, S. Q.,
Qing, Q. T., Hou, M. T., et al. Remote
sensing monitoring and impact assessment of drought in sichuan based on
temperature vegetation dryness index [J]. Transactions of the CSAE, 2007(9):
141‒146, 294.
[9]
Sandholt,
I., Rasmussen, K., Andersen, J. A simple interpretation of the surface
temperature/vegetation index space for assessment of surface moisture status [J].
Remote Sensing of Environment, 2002, 79(2): 213‒224.
[10]
Sha, S.,
Guo, N., Li, Y. H., et al.
Introduction of application of temperature vegetation dryness index in China [J].
Journal of Arid Meteorology, 2014, 32(1): 128‒134.
[11]
Cao, X. M.,
Feng, Y. M., Shi, Z. J. Spatio-temporal variations in drought with remote
sensing from the Mongolian Plateau during 1982?C2018[J]. Chinese Geographical
Science, 30(6): 1081?C1094.
[12]
Cong, D.
M., Zhao, S. H., Xian, L., et al.
Temporal and spatial distribution of drought in Northeast China based on
temperature vegetation drought index (TVDI) from 2001?C2013 [C]. IGARSS
2016??2016 IEEE International Geoscience and Remote Sensing Symposium, IEEE,
2016.
[13]
Zhang, Y.,
Zhang, Y. B., Yi, G. H., et al.
Remote sensing monitoring and analysis of influencing factors of drought in
Inner Mongolia growing season since 2000 [J]. Journal of Natural Resources, 2021, 36(2): 459‒475.
[14]
Zhao, J.
P., Zhang, X. F., Liao, C. H., et al.
Remote sensing inversion model of soil moisture in large arid area based on
TVDI [J]. Remote Sensing Technology and Application, 2011, 26: 742‒750.
[15]
Liu, L. W.,
Zhang, W. P., Duan, Y. H. Terrain corrected TVDI for agricultural drought
monitoring using MODIS data [J]. Acta Ecologica Sinica, 2014, 34(13): 3704‒3711.
[16]
Zhou, Y.
Z., Wang, J. L., Li, K. Temperature vegetation dryness index 1-km grid dataset
in Amur River basin (2007-2018) [J/DB/OL]. Digital Journal of Global
Change Data Repository, 2021. https://doi.org/10.3974/geodb.2021.05.02.V1.
https://cstr.escience.org.cn/CSTR:20146.11.2021.05.02.V1.
[17]
GCdataPR
Editorial Office. GCdataPR data sharing policy [OL].
https://doi.org/10.3974/dp.policy.2014.05 (Updated 2017).
[18]
MODIS13A3
data [DB/OL]. https://ladsweb.modaps.eosdis.nasa.gov/.
[19]
MODIS11A2 data [DB/OL].
https://ladsweb.modaps.eosdis.nasa.gov/.
[20]
Zha, F. L.,
Liu, C., Shi, R. X. Elevation cluster dataset covering the Amur River Basin [DB/OL].
Global Change Data Repository, 2016. https://doi.org/10.3974/geodb.2016.04.17.V1.
[21] Chen, Y. Z., Feng, X. M.,
Fu, B. J. Global 10-day Surface Soil Moisture Dataset (RSSSM, 2003-2018) [J/DB/OL]. Digital Journal
of Global Change Data Repository, 2021. https://doi.org/10.3974/geodb.2021.02.01.V1.
https://cstr.escience.org.cn/CSTR:20146.11.2021.02.01.V1.
[22]
Dataset of
crop growth and farmland soil moisture values in China [DB/OL].
http://data.cma.cn/data/cdcdetail/dataCode/AGME_AB2_CHN_TEN.html.
[23]
Dataset of
world monthly surface climatological data [DB/OL].
https://gis.ncdc.noaa.gov/maps/ncei/summaries/monthly.
[24]
Yu, M.,
Cheng, M. H., Liu, H. An improvement of the land surface temperature-NDVI space
drought monitoring method and its applications [J]. Acta Meteorologica
Sinica, 2011, 69(5): 922‒931.
[25]
Cao, X. M.,
Feng, Y. M., Wang, J. L. An improvement of the Ts-NDVI space drought monitoring
method and its applications in the Mongolian plateau with MODIS, 2000?C2012 [J].
Arabian Journal of Geosciences, 2016, 9(6): 433.
[26]
Chen, Y.
Z., Feng, X. M., Fu, B. J. An improved global remote-sensing-based surface soil
moisture (RSSSM) dataset covering 2003?C2018 [J]. Earth System Scientific Data, 2021, 13: 1?C31.