Maize
Ecosystem Dataset in the North China Plain
Liu, F.
S.1,2,* Ge, Q. S.2,3 Tao, F. L.2,3 Cai, Y. X.1 Bu, J. C.1 Bai, N. N.4
1. China National
Engineering Research Center of JUNCAO Technology, Life College, Fujian
Agriculture and Forestry University, Fuzhou 350002, China;
2. Key Laboratory
of Land Surface Pattern and Simulation, Institute of Geographic Sciences and
Natural Resources Research, Chinese Academy of Sciences, Beijing 100101, China;
3. College of
Resources and Environment, University of Chinese Academy of Sciences, Beijing
100049, China;
4. Forestry
College, Fujian Agriculture and Forestry University, Fuzhou 350002, China
Abstract: The change in farmland surface characteristics has
important feedback on the regional climate by affecting the surface energy and
water exchange at the land–atmosphere boundary layer. Based on the dynamics of
maize phenology in North China Plain, this dataset provided three scenarios
with different sowing dates and lengths of growth period: spring
(early sowing date and normal length), summer (late sowing date and normal
length), and potential (early sowing date and prolonged length of growth
period) maize. The calibrated SiBcrop model was used to simulate the responses
of surface energy and water flux in the three scenarios from 1980 to 2009. The
results showed that the different scenarios had an important influence on the
leaf area index, net radiation, latent heat, sensible heat, and canopy
temperature. The differences in the sowing date, harvest date, and growth
dynamics among scenarios were the key nodes in the changes in the surface
energy budget. An early sowing date had a warming effect, and the prolonged
length of the growth period exhibited no evident warming effect. The research
results have a certain guiding significance for the adaptation and mitigation
of climate change in farmland management.
Keywords: maize; phenology; surface energy partitioning; albedo
DOI: https://doi.org/10.3974/geodb.2022.02.16
CSTR: https://cstr.escience.org.cn/CSTR:20146.14.2022.02.16
Dataset Availability Statement:
The dataset
supporting this paper was published and is accessible through the Digital Journal of Global Change Data
Repository at: https://doi.org/10.3974/geodb.2021.11.07.V1 or
https://cstr.escience.org.cn/CSTR:20146.11.2021.11.07.V1.
1
Introduction
Surfaces
are an important source of energy, moisture, and gas in the climate system.
Changes in surface characteristics have become an important feedback process
for climate change by affecting the surface energy and water exchange at the
land–atmosphere boundary layer[1]. The surface characteristics of
farmland are strongly interfered with by anthropogenic
activities and have become an important driver of regional climate[2]. Improving the simulation accuracy of the material and energy
exchange process at the land–atmosphere boundary layer and quantitating the
climate feedback of farmland management through surface energy and water
processes are significant to adapting and mitigating climate change for
agroecosystems.
2 Metadata of the Dataset
Table
1 shows the dataset name, author, geographical area, data size, data publishing
and sharing service platform, data sharing policy, and other information of the
dataset[2].
3 Development Methods
With
the North China Plain as the research area, stations with complete phenological
and meteorological records from 1981 to 2009 were selected to carry out the
study. Ten sites, including Miyun, Baodi, Huanghua, Tangshan, Weifang,
Xinxiang, Zhengzhou, Shangqiu, Zhumadian, and Nanyang, were available (Table 2).
Guantao Station in Hebei province and Yucheng Station in Shandong province had
good maize growth and flux observation data, which were used for the
calibration and verification of the SiBcrop model to improve the simulation
accuracy of maize phenological period, leaf area index, latent heat, sensible
heat, canopy temperature, and other processes (Table 2). The data from Yucheng
Station were measured in 2004–2005 and came from the Chinese flux observation
and research network.
The measured time of the eddy-correlated data of Guantao Station was from 2009
to 2010 from the National Tibetan Plateau Data Center. The multi-year average temperature of the above stations
fluctuated between 11.86–14.33 ??C, and the annual precipitation fluctuated
between 617.96–1,060.3 mm; the soil type is sandy loam[1]; these values represent the natural growth conditions and
agriculture production level in North China Plain.
The three maize
scenarios, including different sowing dates and lengths of growth periods, were
established (Table 3). The sowing date in the spring maize scenario was the
median sowing date of spring maize at the selected site, that is, day of year
136 (DOY136), and the growing degree day reached 2,730 oC·d; The
sowing date in the summer maize scenario was the median sowing date of summer
maize at the selected site (DOY162), and the growing degree day reached 2,730 oC·d.
The sowing date in the potential maize scenario was the median sowing period of
spring maize at the selected site (DOY136); the harvest date was the median harvest
period of summer maize. The average growing degree day of 10 stations was 3,036
oC·d based on the dates of sowing and harvest. The other parameters
in the model remain unchanged.
A calibrated SiBcrop model[1] was used to simulate the responses of surface energy and water
balance under different maize scenarios. The simulation time was from 1980 to
2009, and the simulation step was half an hour. During the simulation, the
initial boundary conditions, meteorological data, soil types, and other
conditions were kept constant. The difference between spring and summer maize
scenarios reflected the effect of changes in the sowing date, the difference
between spring and potential maize scenarios reflected the influence of growth
period length, and the difference between summer and potential maize reflected
the combined effect of sowing date and length of the growth period.
Table
1 Metadata summary of the Maize ecosystem dataset including management
measures and surfaceenergy and water balance in the North China Plain
|
Items
|
Description
|
|
Dataset full name
|
Maize ecosystem
dataset including surface energy and water budget in North China Plain (1980–2009)
|
|
Dataset short
name
|
MaizeNorthChina_1980-2009
|
|
Authors
|
Liu, F. S.,
Fujian Agriculture and Forestry University, liufs.11b@igsnrr.ac.cn
Ge, Q. S.,
Institute of Geographic Sciences and Resources, Chinese Academy of Sciences, geqs@igsnrr.ac.cn
Tao, F. L.,
Institute of Geographic Science and Resource, Chinese Academy of Science, taofl@igsnrr.ac.cn
Cai, Y. X.,
Fujian Agriculture and Forestry University, 275196219@qq.com
Bu, J. C.,
Fujian Agriculture and Forestry University, 2450594360@qq.com
Bai,
N. N., Fujian Agriculture and Forestry University, 2450594360@qq.com
|
|
Geographical
area
|
North China
Plain
|
|
Year
|
1980–2009
|
|
Data format
|
.xlsx
|
|
Data size
|
64.6 MB (62.1MB
after compression)
|
|
Data files
|
The dataset includes the
following variables: site name, scenario, date, maize growth dynamics
(including leaf area index, growing degree day, leaf biomass, sowing date,
seedling date), surface energy budget (including sensible heat, latent heat,
four components of short-wave radiation, i.e., visible, infrared, scatter,
and direct radiation, and downward longwave radiation, net radiation), canopy
temperature, soil surface moisture and so on
|
|
Foundation
|
National Natural Science Foundation of China (41801020)
|
|
Data
publisher
|
Global Change Research Data Publishing &
Repository, http://www.geodoi.ac.cn
|
|
Address
|
No.
11A, Datun Road, Chaoyang District, Beijing 100101, China
|
|
Data sharing
policy
|
Data from
the Global Change Research Data Publishing & Repository includes metadata, datasets
(in the Digital Journal of Global Change Data Repository), and
publications (in the Journal of Global Change Data & Discovery). Data sharing policy
includes: (1) Data are openly available and can be free downloaded via the
Internet; (2) End users are encouraged to use Data subject to
citation; (3) Users, who are by definition also value-added service
providers, are welcome to redistribute Data subject to written permission
from the GCdataPR Editorial Office and the issuance of a Data redistribution
license; and (4) If Data are used to compile new
datasets, the ??ten per cent principal?? should be followed such that Data
records utilized should not surpass 10% of the new dataset contents, while
sources should be clearly noted in suitable places in the new dataset[3]
|
|
Communication and searchable system
|
DOI, CSTR, Crossref, DCI, CSCD,
CNKI, SciEngine, WDS/ISC, GEOSS
|
Table 2 Basic information of each site
|
Site name
|
Latitude
(N)
|
Longitude
(E)
|
Altitude above sea level (m)
|
Temperature
(oC)
|
Precipitation
(mm)
|
Data
|
|
Huanghua
|
38.37
|
117.35
|
7.3
|
12.92
|
589.48
|
Meteorology, phenology
|
|
Tangshan
|
39.67
|
118.15
|
28.6
|
11.85
|
636.56
|
Meteorology, phenology
|
|
Nanyang
|
33.03
|
112.58
|
130.7
|
15.16
|
897.9
|
Meteorology, phenology
|
|
Shangqiu
|
34.45
|
115.67
|
51
|
14.37
|
770.15
|
Meteorology, phenology
|
|
Xinxiang
|
35.32
|
113.88
|
74
|
14.55
|
611.38
|
Meteorology, phenology
|
|
Zhumadian
|
33
|
114.02
|
83.3
|
15.16
|
1,079.31
|
Meteorology, phenology
|
|
Zhenzhou
|
34.72
|
113.65
|
111.3
|
14.76
|
708.83
|
Meteorology, phenology
|
|
Weifang
|
36.75
|
119.18
|
19.3
|
12.74
|
609.19
|
Meteorology, phenology
|
|
Baodi
|
39.73
|
117.28
|
6
|
11.77
|
608.09
|
Meteorology, phenology
|
|
Miyun
|
40.38
|
116.87
|
73.1
|
11.27
|
691.31
|
Meteorology, phenology
|
|
Yucheng
|
36.83
|
116.57
|
28
|
13.1
|
582
|
Meteorology, phenology, flux
|
|
Guantao
|
36.52
|
115.13
|
40
|
13.82
|
490.47
|
Meteorology, flux
|
|
Table 3 Simulation
scenarios of maize
|
|
Simulation Scenarios
|
Parameters
|
Simulation time
|
|
Sowing date
|
Growing degree day
|
|
Spring maize
|
No earlier than DOY136
|
2,730 oC·d
|
1980–2010
|
|
Summer maize
|
No earlier than DOY162
|
2,730 oC·d
|
1980–2010
|
|
Potential maize
|
No earlier than DOY136
|
3,036 oC·d
|
1980–2010
|
4 Data Results and Validation
4.1 Dataset Composition
The
dataset included the following: site name, scenario, date, maize growth dynamics
(including leaf area index, growing degree day, leaf biomass, sowing date, and
seedling date), surface energy budget (including sensible heat, latent
heat, four components of short-wave radiation, i.e., visible, infrared,
scatter, direct radiation, and downward longwave radiation, net radiation),
canopy temperature, and soil surface moisture.
4.2 Data Results
Certain differences were
observed in the leaf area index between different scenarios, years, and
stations (Figure 1). Between different scenarios, the spring maize had an
earlier sowing date, a smaller peak of leaf area index, and an earlier harvest
date. The potential maize had an earlier sowing date, the highest peak of leaf
area index, and a later harvest date. The summer maize had a later sowing date,
a middle peak of leaf area index, and a later harvest date. The leaf area index
fluctuated significantly between different years. In most cases, the interannual
fluctuations of the leaf area index between different scenarios were similar;
that is, if the leaf area index is high in a certain year, then the leaf area
index of all three scenarios is high. The difference in the leaf area index
between stations is related to the spatial location. The stations located in
the south have excellent hydrothermal conditions and generally have a higher
leaf area index. According to the average leaf area index[3], the difference in the leaf area index between the three scenarios
was in the range of −2.5 to 2.5. The relative magnitudes in the early stage of
growth followed the order, potential maize > spring maize > summer maize,
and gradually became summer maize > potential maize > spring maize in the
later stage.

Figure 1
Season
variation of leaf area index among different scenarios
The
growth differences between different scenarios of each site were mainly
exhibited in the late growth period, and the difference was small in the early
stage of growth. For example, compared with the spring maize, the leaf area index
of summer maize in the late growth period was higher, and stations located in
the south had a larger difference. Compared with spring maize, the leaf area
index of potential maize was higher, and stations located in the north had a
larger difference. The leaf area index of potential maize in the northern
station was generally higher than that of summer maize, and the leaf area index
of potential maize in the southern site was lower than that of summer maize and
became positive with the harvest of summer maize.
Net radiation
showed evident seasonal dynamics (Figure 2). With the growth of maize, net
radiation gradually increased, peaked at the peak growth of maize, and
gradually declined. The peak of net radiation was 200 W·m−2, and the
non-growth period was reduced to −50 W·m−2. Large differences were
observed in the net radiation between different years, and this finding was
related to the leaf area index. However, the net radiation in some years (such
as 1998 and 2004) with a high leaf area index was not the highest, and this
finding was closely related to meteorological conditions. According to the
average value of net radiation, the difference in net radiation between
different scenarios can reach ??20 W·m−2, with early sowing and late
harvesting scenarios having higher net radiation. During the growth period,
scenarios with a high leaf area index captured more net radiation at about 10
W·m−2.
Changes in the
latent heat flux were similar to net radiation (Figure 3). The peak of latent
heat was 100–150 W·m−2. The difference in latent heat flux between
scenarios was ??20 W·m−2. Certain results were evident in the two
periods: the greater difference in the growth between different scenarios, the
greater the difference in the latent heat. In addition, maize harvesting
immediately significantly reduced the latent heat flux.
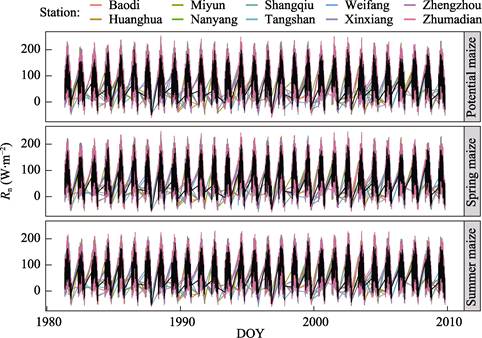
Figure 2 Seasonal
dynamics of net radiation at different stations
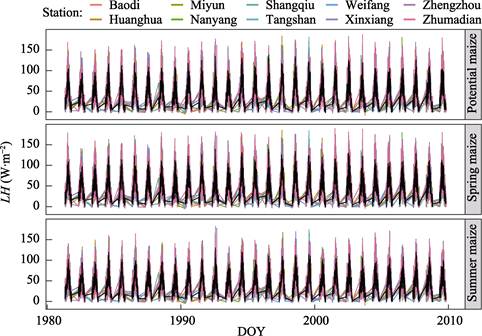
Figure 3 Seasonal dynamics of latent heat at
different stations
The sensible heat flux fluctuated in the
range of 0-50 W·m−2. Some sites have
peaked at more than 100 W·m−2 in certain years (Figure 4).
Differences were noticed in the sensible heat flux between scenarios. The
difference caused by various sowing dates was approximately 10 W·m−2,
and the fluctuation caused by the difference in harvest date exceeded 15 W·m−2.
The difference caused by different lengths of growth period was less than 5 W·m−2.
The difference in the sensible heat flux between stations was similar to the
change trends of net radiation and latent heat. Stations located in the south
had higher net radiation and were allocated more to sensible and latent heat;
the surface energy fluxes of northern stations were lower.
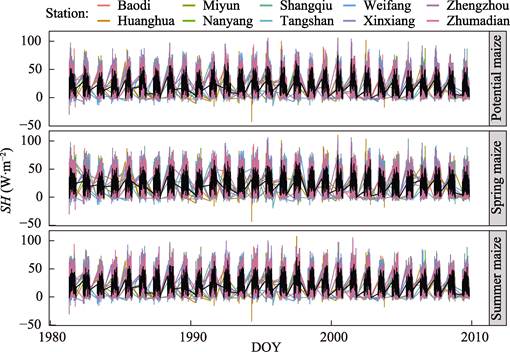
Figure 4 Seasonal
dynamics of sensible heat flux at different stations
|

Figure 5 Different
canopy temperatures
between various simulation scenarios
|
The fluctuation
range of the canopy temperature in the maize growing season was 280-300 K. The canopy temperature difference between scenarios was ??0.5 ??C
(Figure 5). In different scenarios, the canopy temperatures at different
nodes—the sowing date (early sowing, DOY145; abbreviated as D1; late sowing,
DOY173; abbreviated as D2), peak transition time of leaf area index (DOY225,
abbreviated as D3), harvest date (spring maize, DOY253, abbreviated as D4;
summer maize, DOY279, abbreviated as D5; potential maize, DOY304, abbreviated
as D6)—were compared; the sowing and harvest dates of maize are the key nodes
for temperature differences[3]. The difference in canopy temperature between different scenarios
varied with the change in the above key nodes. For example, the simulated
values of spring and summer maize showed that from D1 to D2 and D3 to D5, the
canopy temperature difference was positive, and the canopy temperature
difference from D2 to D3 was negative. The difference between the simulated
values of potential and spring maize was significantly negative from D4 to D5,
and the canopy temperature difference was positive from D5 to D6. The
difference between the simulated values of the potential and summer maize scene
was similar to the spring-summer scenario. A positive difference was observed
between D5 and D6, and the scenarios of spring and summer maize were obtained.
No difference was observed in the canopy temperature between the two.
4.3 Data Validation
Three
statistical parameters were used to analyze the model??s simulation errors in
the leaf area index, latent heat, and apparent heat (Table 4). The model showed
a good simulation of maize growth dynamics; the simulation accuracies of latent
and sensible heat flux were poor. The flux error varied from site to site. The
sensible heat flux simulation accuracy of Yucheng Station was higher than that
of Guantao Station, and the latent heat simulation accuracy of Guantao Station
was higher than that of Yucheng Station. Certain differences were observed
between the simulated and actual phenologies. On average, the simulated sowing
date of spring maize was 7.4 days later than the actual, and the harvest date
was 18.5 days later. The simulated sowing date of summer maize was 5.1 days
later than the actual, and the harvest date was 17.5 days later.
Table 4 Simulation
accuracy of SiBcrop model
|
Parameter
|
Yucheng Station
|
Guantao Station
|
|
R2
|
RMSE
|
IOA
|
R2
|
RMSE
|
IOA
|
|
LAI
|
0.93
|
0.49
|
0.96
|
–
|
–
|
–
|
|
LH
|
0.53
|
17.97 W·m−2
|
0.83
|
0.83
|
14.22 W·m−2
|
0.9
|
|
SH
|
0.6
|
14.82 W·m−2
|
0.77
|
0.47
|
9.7 W·m−2
|
0.75
|
Note: LAI, leaf area index; LH, latent heat flux;
SH, sensible heat flux.
5 Discussion and Conclusion
Changes
in agriculture phenology in temperature areas usually show that the surface
energy distribution-cooling effect exceeds the surface albedo-warming effect,
resulting in the overall cooling influence. In the Agro-IBIS model, changes in
the latent and sensible heat fluxes caused by the prolonged growth of maize
were more than 47 and −20 W·m−2[4], respectively. Early
sowing increased (decreased) the latent (sensible) heat flux in June, and
shortening from the maturity to the harvest date enhanced the net radiation in
October[5]. Compared with maize monoculture, winter wheat harvesting in
wheat–maize rotation system increases temperature and reduces humidity, which
in turn affects atmospheric circulation and precipitation[1]. Under the background of climate change, the early sowing date and
extended length of growth period are important changes in agroecosystems. This
dataset shows the influence of the sowing date and the length of growth period
on the surface energy budget. The magnitude of data was similar to the results
of others, but it contained more information, which provides good guiding
significance for the restructuring and management of the rotation system in
North China Plain.
The surface
process model showed a certain simulation error in the surface energy and water
flux. In the SiB2 model driven by remote sensing data, the
simulation errors of latent and sensible heats in the winter wheat–summer maize
rotation system in North China Plain were 35.6-40.8 and 32.6-69.8 W·m−2,
respectively[6]. The simulation errors in the VIP model were 40.37 and 47.7 W·m−2[7]. Community Land Model was used to simulate the growth process of
maize. The simulation errors of latent heat flux were 87.5 W·m−2
(root mean square error (RMSE)), 0.71 (R2),
and 0.89 (IOA); the simulation errors of sensible heat flux were 67.5 W·m−2
(RMSE), 0.4 (R2), and 0.77
(IOA)[1]. The simulation error of this data was close to that of others, and
provides the simulation accuracy of sowing and harvest dates, which has a good
application value.
This dataset
provided the surface energy and water balance under three maize scenarios based
on the SiBcrop model simulation. Based on the
phenological dynamics of maize under the background of climate change, two
maize sowing dates and two growth periods in the North China Plain were
constructed, and the effects of different scenarios on the material and
energy exchange in the boundary layer were simulated using improved SiBcrop.
The research results revealed different processes of surface energy and water
balance between maize scenarios. The differences in maize growth processes
interact with meteorological conditions. During the inter-sowing, growth, and
inter-harvest periods, different effects were observed on factors, such as net
radiation, latent heat, sensible heat, and canopy temperature. The earlier
sowing date showed a certain warming potential, and the warming effect of the
extended growth period was not evident. This climate feedback process is of
reference value in guiding the mitigation of climate change in the North China
Plain.
Author
Contributions
Liu, F. S., Ge, Q. S., and Tao, F. L. made the
overall design of data development; Cai, Y. X. and Bu, J. C. collected and
processed meteorological data; Liu, F. S. and Tao, F. L. designed models and
algorithms; Cai, Y. X., Bu, J. C., and Bai, N. N. did data verification; Liu, F.
S. and Tao, F. L. wrote data papers.
Conflicts
of Interest
The
authors declare no conflicts of interest.
References
[1]
Mahmood, R., Pielke, R. A.,
Hubbard, K. G., et al. Land cover
changes and their biogeophysical effects on climate [J]. International Journal of Climatology, 2014, 34(4): 929–953.
[2]
Liu, F. S., Ge, Q. S., Tao, F.
L., et al. Maize ecosystem dataset
including surface energy and water budget in North China Plain (1980–2009) [J/DB/OL].
Digital Journal of Global Change Data
Repository, 2021. https://doi.org/10.3974/geodb.2021.11.07.V1. https://cstr.escience.org.cn/CSTR:20146.11.2021.11.07.V1.
[3]
GCdataPR Editorial Office.
GCdataPR data sharing policy [OL]. https://doi.org/10.3974/dp.policy.2014.05
(Updated 2017).
[4]
Liu, F., Chen, Y., Bai, N., et al. Divergent climate feedbacks on
winter wheat growing and dormancy periods as affected by sowing date in the
North China Plain [J]. Biogeosciences,
2021, 18(7): 2275–2287.
[5]
A, D., Xiong, K., Zhao, W. J., et al. Temporal trend of climate change
and mutation analysis of North China Plain during 1960 to 2013 [J]. Scientia Geographica Sinica, 2016, 36(10):
1555–1564.
[6]
Liu, S., Xu, Z., Zhu, Z., et al. Measurements of
evapotranspiration from eddy-covariance systems and large aperture
scintillometers in the Hai River basin, China [J]. Journal of Hydrology, 2013, 487: 24–38.
[7]
Jia, Z., Liu, S., Xu, Z., et al. Validation of remotely sensed
evapotranspiration over the Hai River basin, China [J]. Journal of Geophysical Research: Atmospheres, 2012, 117: D13113. DOI:
10.1029/2011JD017037.
[8]
Liu, F. S., Ge, Q. S., Tao, F.
L., et al. Impacts of maize planting
date and variety on canopy temperature and surface biophysical mechanism in the
North China Plain [J]. Progress in
Geography, 2022, 41(4): 682–692.
[9]
Bagley, J. E., Miller, J.,
Bernacchi, C. J. Biophysical impacts of climate-smart agriculture in the
Midwest United States [J]. Plant Cell and
Environment, 2015, 38(9): 1913–1930.
[10]
Sacks,
W. J., Kucharik, C. J. Crop management and phenology trends in the US Corn
Belt: Impacts on yields, evapotranspiration and energy balance [J]. Agricultural and Forest Meteorology,
2011, 151(7): 882–894.
[11]
Zhang, X., Tang, Q., Zheng, J.,
et al. Warming/cooling effects of
cropland greenness changes during 1982–2006 in the North China Plain [J]. Environmental Research Letters, 2013,
8(2): 024038.
[12]
Zhang, X., Tang, Q., Zheng, J.,
et al. Suppression of spring rain by
surface greening over North China Plain [J]. International Journal of Climatology, 2015, 35(10): 2752–2758.
[13]
Lei, H., Yang, D., Shen, Y., et al. Simulation of evapotranspiration
and carbon dioxide flux in the wheat-maize rotation croplands of the North
China Plain using the Simple Biosphere Model [J]. Hydrological Processes, 2011, 25(20): 3107–3120.
[14]
Mo, X., Liu, S., and Lin, Z.
Evaluation of an ecosystem model for a wheat-maize double cropping system over
the North China Plain [J]. Environmental
Modelling & Software, 2012,
32: 61–73.
[15]
Peng, B., Guan, K. Y., Chen,
M., et al. Improving maize growth
processes in the community land model: Implementation and evaluation [J]. Agricultural and Forest Meteorology,
2018, 250: 64–89.