Road & Railway Network Density Dataset at 1 km over the Belt and Road and Surround Region
Kou, P. Y.1, 2 Niu, Z.1, 2* Liu, Z. J.3 Bi, K. Y.1, 2 Meng, M.1, 2
1. Institute of Remote Sensing and Digital Earth Chinese Academy of Sciences, Beijing 100101, China;
2. University of Chinese Academy of Sciences, Beijing 100101, China;
3. Institute of Geographic Sciences and Natural Resources Research, Beijing 100101, China
Abstract: Road & railway network density is one of the most important indexes to evaluate regional traffic and economic development, and is the foundation of implementing the interconnection and interworking proposal of the Belt and Road and Surround Region. Based on the real-time updated road vector data of OpenStreetMap and by ArcGIS spatial analysis technique, 1 km resolution of road density and railway density was calculated and analysed over the Belt and Road and surround region—Asia, Europe, Africa, Australia and New Zealand in October 2016. The dataset was archived in .tif format with data size of 4.58 GB. The dataset can provide distribution of road and railway over the Belt and Road and surround region and provide basic data for future road and railway studies.
Keywords: the Belt and Road; road; railway; network density; 1 km
1 Introduction
Generally, road density is defined as the total length of all roads, ignoring road grade, and the number of lanes divided by the area of the underlying surface, with its unit usually expressed in m/km2 or km/km2[1]. Road density is a significant indicator for measuring the development degree and convenience of regional roads[2–3]. In the process of economic globalisation driven by the “Belt and Road Initiative”, road density is a direct index that can measure whether the road is able to meet the demand of land transportation. At present, the data sources available on road networks are mainly statistical data and the range is limited to administrative units at all levels[4–6]. Therefore, study results have hysteresis quality over time, and lack detail and local information in space.
Based on real-time updated road vector data of OpenStreetMap (OSM) and by ArcGIS spatial analysis technique, the road density and railway density was calculated over the Belt and Road and surround regions including Asia, Europe, Africa, Australia and New Zealand in the dataset in the present study[7]. The spatial resolution of the dataset was 1 km and it was compiled in October 2016. This not only reflected the 1 km resolution of local details in coverage area, but also laid a foundation of statistical analysis over a wider range (e.g., administrative region and ecological zoning).
2 Metadata of Dataset
The name, author, geographic region, time, temporal resolution, spatial resolution, dataset composition, database publishing, sharing service platform, data sharing policy and other information of the 1 km resolution of road network density dataset over the Belt and Road and surround region (RoadDensity_B&R_2016) are shown in Table 1.
Table 1 Metadata summary of the 1 km resolution of road network density dataset over the Belt and Road and surround region
|
Items
|
Description
|
|
Dataset full name
|
Road & railway network density dataset in the Belt and Road and surround region in 1 km resolution (2016)
|
|
Data short name
|
RoadDensity_B&R_2016
|
|
Authors
|
Niu, Z. M-9923-2017, niuzheng@radi.ac.cn
Kou, P. Y. M-9835-2017, sept_kou@163.com
Liu, Z. J. O-8134-2014, liuzj@radi.ac.cn
Bi, K. Y. N-1140-2017, 2455398389@qq.com
Meng, F. M-9826-2017, 1911394686@qq.com
|
Institute of Remote Sensing and Digital Earth, Chinese Academy of Sciences
|
|
Geographic region
|
Asia, Europe, Africa, Australia and New Zealand
|
|
Time
|
2016
|
|
Spatial resolution
|
1,000 m
|
|
Data format
|
.rrd Data Size 4.58 GB
|
|
Dataset and data files
|
The dataset was consisted of 8 group files:
Asia_road: Road density in Asia, 684 MB; Asia _railway: Railway density in Asia, 541 MB;
Europe_road: Road density in Europe, 1.09 GB; Europe_railway: railway density in Europe, 291 MB; Africa _road: Road density in Africa, 530 MB; Africa_railway: Railway density in Africa, 360 MB; Australia_road: Road density in Australia and New Zealand, 618 MB; Australia_ railway: Railway density in Australia and New Zealand, 554 MB
|
|
Data publisher
|
Global Change Scientific Research Data Publishing System, http://www.geodoi.ac.cn
|
|
Address
|
11A, Datun Road, Chaoyang District, Beijing 100101, China
|
|
Data sharing policy
|
The Data of the Global Change Scientific Research Data Publishing System includes metadata (Chinese and English), entity data (Chinese and English), and data paper (Chinese and English) published in the Journal of Global Change Data & Discovery (Chinese and English). Data sharing policy includes: (1) Data shall be freely accessed by the whole society via the Internet and, via the most convenient method, the users can scan and download for free; (2) Data used by end users shall indicate the source in the reference lists and in-text citations in citation format; (3) Value-added service users or users who distribute and spread the Data in any forms (including through a computer server) shall sign a written agreement with the editorial office of the Journal of Global Change Data & Discovery (Chinese and English) to obtain permission; (4) The author who quotes new data of some record creation shall abide by 10% of citing principle, namely the data record selected from this dataset shall be less than 10% of total records of the new dataset. Meanwhile, the cited data record shall indicate the sources[8]
|
3 Methods
3.1 Definition and Computing Method of Road Density
Road density refers to the total length of all roads, ignoring road grade, and the number of lanes divided by the area of the underlying surface, with usual unit of m/km2, and calculation formula as follows:
Di = Li /Ai,i∈ (1,2,3, … ,n) (1)
where, Di refers to the network density of road facilities in region i (m /km2), Li refers to the length of the road or the number of nodes in region i, and Ai refers to the site area in region i [1, 9, 10].
3.2 Data Source Specification
The raw road vector data required in this road density dataset were derived from the open-source OSM, which can detect an area based on 5° (latitude) × 6° (longitude), and land the framing of the Universal Transverse Mercator (UTM) projection based on the central meridian and divided into 1 km the size of the grid. As an open geographic database that users can edit and apply freely, OSM is a real-time upgraded map with Wikipedia model prepared on the basis of hand-held GPS, aerial imaging and other free knowledge[11]. The OSM foundation was established in Britain in 2006 to maintain editorial platforms and encourage the development and output of free geographical data. Users worldwide can collect dots, lines and surface data from a variety of low-cost client GPS, and update them to OSM. Accordingly, the data collected is available for free download.
This dataset adopts OSM road and railway data from October 2016, and the document is in .shp format. Meanwhile, it will be utilized after implementing visual validation via Google Earth.
3.3 Data Processing
By virtue of ArcGIS software, UTM projection was performed for each subdomain to test the area on the basis of the central meridian. 1 km × 1 km grid was also established, with the roads tangent to the grid, ensuring that the road vector had grid attributes. Afterwards, the road network density was obtained by dividing the sum of the length of the roads in each grid by the area of the underlying surface.
4 Results and Validation
4.1 Spatial Distribution of Road Density
The scope of RoadDensity_B&R_2016 was Asia, Europe, Africa, Australia and New Zealand. The sampling time was October 2016 and the data was archived in .rrd file. For the large data size, the data files were framed as follows:
Based on 5° (latitude) × 6° (longitude), the dataset was divided between south latitude 60° and north latitude 90°, which are 1,800 divisions in total. The data file was divided into two groups consisting of road density and railway density, and their filenames were composed of sectional numbers (Table 2). The relationship between number n and corresponding geographical coordinates in the lower left corner was [(n mod 60)×60°-180°,(n/60)×5°-65°].
Table 2 Sectional filenames of RoadDensity_B&R_2016
|
Filenames
|
Longitude
|
Latitude
|
|
……
|
……
|
……
|
|
net_raster_wgs_651.img
|
126°
|
‒10°
|
|
net_raster_wgs_652.img
|
132°
|
‒10°
|
|
net_raster_wgs_653.img
|
138°
|
‒10°
|
|
……
|
……
|
……
|
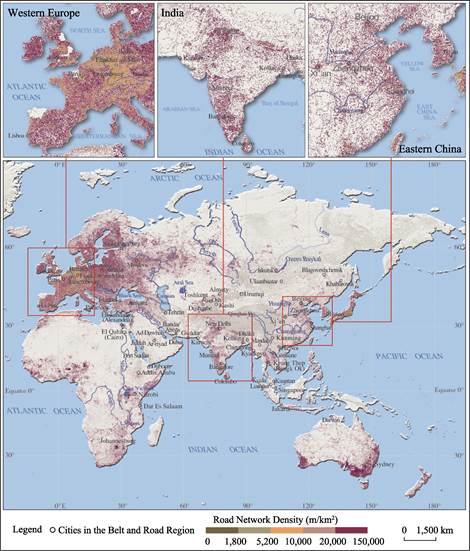
Figure 1 Spatial distribution of the road network density over the Belt and Road and surround region
The dataset included road density and railway density in the monitoring area; in addition, it also consisted of four continents. Therefore, the road network density in each continent was named “Asia_road”, “Europe_road”, “Africa_road” and “Australia_road”. Their data in sizes were 684 MB, 1.09 GB, 530 MB and 618 MB, respectively. Similarly, the railway network density was named “Asia_railway”, “Europe_railway”, “Africa_railway” and “Australia_railway”. Their data sizes were 541 MB, 291 MB, 360 MB and 554 MB, respectively.
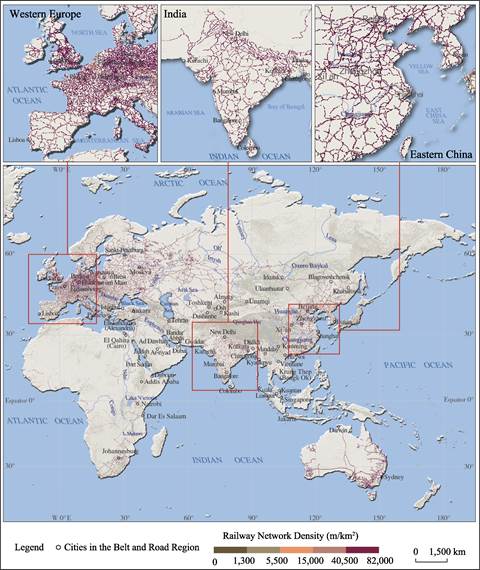
Figure 2 Spatial distribution of the railway network density over the Belt and Road and surround region
The 1 km resolution of the road network density and railway network density over the Belt and Road and surround region in 2016 is shown in Figure 1 and Figure 2, respectively.
In terms of spatial distribution, there was a trend that the road network density of coastal areas was higher than that of inland areas. Road coverage and density in coastal areas
of Southeast Asia and Europe, especially western Europe, southern India and southern
Australia were relatively high. Meanwhile, there existed clusters around economically active and populated cities. The overall trend of railway density was similar to road network density; however, the coverage of the former was lower than that of the latter and the clustering phenomena was not as obvious.
4.2 Validation
This dataset is second generation data; hence, its accuracy is completely based on the original road vector data. OSM data is based on user uploads; therefore, different users in different regions and the amount of uploaded data may lead to a gap between OSM data and actual road data.
5 Discussion and Conclusion
A 1 km resolution of the road network density dataset over the Belt and Road and surround region based on open-source OSM data from October 2016 was utilized in the present study. The spatial distribution of the 1 km resolution road network density over the whole region can be obtained by calculation. This provides a basic foundation for implementing the interconnection and interworking proposal of the “Belt and Road Initiative”, transportation infrastructure construction and future road studies.
Author Contributions
Kou, P. Y. was responsible for the overall design of preparing the dataset, collecting and disposing the data of Asia, Europe, parts of Africa, Australia and New Zealand. Liu, Z. J. was in charge of model design and algorithm. Bi, K. Y. and Meng, M. collected and handled the partial African data. Kou, P. Y. performed data validation and wrote the data paper.
References
[1] Fan, K. H., Li, Y. B., Feng, Y. L. Spatial Variation of Chongqing Road Density based on GIS [J]. Geographical Science, 2011, 31(3): 365-371.
[2] Bureau of Transportation Statistics. Publication BTS99—04 [M].Washington, D. C.: Department of Transportation, U. S., 1999.
[3] Li, S. M., Shum, Y. M. Impacts of the national truck highway system on accessibility in China [J]. Journal of Transport Geography, 2001, 9(1): 39-48.
[4] Jiang, X. W., Cao, W. D., Luo, J., et al. Spatial pattern and evolution of road network reachability Anhui province [J]. Progress in Geography, 2012, 31(12): 1591-1599.
[5] Wang, C. J., Wang, W., Zhang, M. T., et al. Evaluation and evolution mechanism of Chinese road network reachability [J]. Acta Geographica Sinica, 2014, 69(10): 1496-1509.
[6] Cao, X. S., Xue, D. S., Yan, X. P. Urban accessibility of China road network connection [J]. Acta Geographica Sinica, 2005, 60(6): 903-910.
[7] Kou, P. Y., Niu, Z., Liu, Z. J., et al. Road network density dataset over the Belt and Road and surround region (2016) [DB/OL]. Global Change Research Data Publishing & Repository, 2017. DOI: 10.3974/geodb.2017.03.15.V1.
[8] GCdataPR Editorial Office. GCdataPR Data Sharing Policy [OL]. DOI: 10.3974/dp.policy.2014.05 (Updated 2017).
[9] Ren, H., Zhou, Z. H., Zhou, X. X. Urban road network density calculation based on RS and GIS [J]. Computer and Information Management, 2009, 18 (2): 85-87.
[10] Wei, W., Shi, P. j., Tuo, M. Y., et al. Analysis of density distribution and spatial dependence of road network in Gansu Province based on GIS [J]. Geographical Science, 2012, 32 (11): 1297-1303.
[11] Zhang, Y. H., Zhang, S. P., Zhang, F. Q., et al. Analysis and implementation based on shortest path algorithm of OpenStreetMap [J/OL]. Computer Technology and Development, 2013, 23(11): 37-41.