Methodology and Practice on Quantifying the Impact of Global Change & Earth System Science Data in 2019
Liu, C.* Zhang, Y. H.
Institute of Geographic Sciences and Natural Resources Research, Chinese Academy of Sciences, Beijing 100101, China
Abstract: With the coming of data driven sciences, the importance of re-using scientific research data is increasingly significant. How to quantitatively measure the impact of the datasets, as well as the data authors, and data centers is particularly urgent. Based on the statistics of the data citation from 2014 to 2018 and the method of Data Impact Score (DIS) models, the DIS of each dataset among the 192 cited datasets published by the Global Change Research Data Publishing & Repository (GCdataPR) and the Geoscientific Data & Discovery Publishing System during 2014–2018 were calculated using the DIS model. Besides, the DIS of each author among the 565 dataset authors and two data publishing centers were also calculated using the DIS models. There are totally 324 citations with the DIS of 134.069,4 during 2014–2018. Taking 5%, 15%, 30% and 50% as the critical values, all the datasets were classified into Q1, Q2, Q3 and Q4 levels. As the result, 10 datasets were ranked into Q1 with the DIS above 6, 24 datasets were ranked into Q2 with the DIS between 2 and 6, 41 datasets were ranked into Q3 with the DIS between 0.2–2, and 117 were ranked into Q4 with the DIS less than 0.2. There were 28 data authors ranked into Q1, and the GCdataPR was ranked the top one of the data publishing centers. The DIS methodology can be used for more broad datasets from the data repositories or data publishers in national and international levels.
Keywords: big data; data impact score; statistics; data author; data center
1 Background
Global change and geoscience data are related to all spheres of the earth, multiple spatial-temporal scales (from global to regional and local, from instantaneous to monthly, yearly, …, historical and geological), and in different data formats(vector, raster or table based). The data is a necessary resource for global change, earth science research, and sustainable development. Dataset is a basic body of data publishing and dissemination, as well as the data citation. In order to promote the research data sharing and re-using, the Big Data Working Committee of the Geographical Society of China (BigData_WC/GSC) decided to have a quantitative measuring action with the Liu’s Data Impact Score (DIS) methodology[1] since 2018. Through quantitatively measuring with Data Impact Score, the first 5% and the first 5%–15% of the most impact datasets are ranked into Q1 and Q2, respectively.
In early 2019, the BigData_WC/GSC had a call for dataset impact measuring based on the datasets published during 2014–2018. The aim of the call is to encourage open good-quality data to be reused by citation in the broad fields of earth system science and global change studies. The BigData_WC/GSC shall release the data impact ranking based on the data citation[2] census and DIS models.
The qualifications for the dataset, which can be archived in the data impact measuring database, are as follows:
(1) The contents of the dataset are relevant to the fields of global change or earth sciences;
(2) The dataset is already published with DOI (Digital Object Identifier) and archived in any of the regular members of World Data System[3], or National Data Center, or any qualified and registered data publishers;
(3) The dataset is openly accessible through internet;
(4) The dataset was published from January 1, 2014 to December 31, 2018.
Any of the followings is eligible to submit his/her application:
(1) Dataset author: the dataset authors (the first author, corresponding author, or any of the co-authors) are eligible to submit the application for the dataset impact measuring;
(2) Data publisher: the data publisher is eligible to submit its application for all datasets published through it for the dataset impact measuring.
The deadline of the applications was May 15, 2019.
The Geographical Society of China will officially release the measuring datasets impact result at the 2019 Conference of the BigData_WC/GSC (September 21, 2019, Dalian)[4]
2 The Flowchart of Data Impact Assessment of Global Change and Earth System Science
The flowchart of data impact assessment of global change and earth system science is shown in Figure 1.
According to the process of data impact assessment of global change and earth system science in 2019, the first step is to identify each valid dataset, which will be measured, and then put it into the Assessment Sub-database; secondly, a comprehensive survey was conducted based on the dataset citation (including published title, author, journal, volume, year, DOI), and a Data Citation Sub-database was established; then, based on the Impact Factors (IF) of citing journals[5] collected, the citing journals’ IF Sub-database was established; finally, according to DIS model[1] and the above information, the DISdataset (2014–2018) was calculated.
Taking the first 5%, 15%, 30% and 50% of DISdataset (2014–2018) as the critical values, the Q1, Q2, Q3, and Q4 of DISdataset (2014–2018) were identified.
Based on the DISdataset (2014–2018) and DIS models[1] for measuring the data authors, funding agencies and projects, the author affiliations, and data publishers, the DIS for each of them was calculated separately.
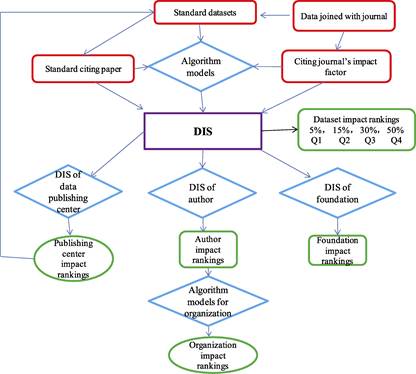
Figure 1 Flowchart of data impact assessment of global change and earth system science
3 Database Establishment for Measuring Impact of Published Datasets in 2019
The database for the published datasets impact measuring in 2019 consists of five tables, including:
(1) Valid datasets for impact measuring;
(2) Data citation information of each dataset;
(3) Impact Factors of each citing journal;
(4) DIS models for datasets, data authors, data authors’ affiliations, funding agencies, funding projects, and data publishers;
(5) DIS results and ranking for each of dataset, data authors, data authors’ affiliations, funding agencies, funding projects, and data publishers.
3.1 Valid Datasets for Impact Measuring (2014–2018)
There are 282 valid datasets for the data impact measuring among the 284 applications. Two datasets were not included, because no dataset was published along with the data papers.
The contents of dataset information include: dataset title, publisher, DOI, publication year, website, the authors, author’s affiliations, funding projects, data format, data size, data policies, data retrieval information, etc.
3.2 Data Citation Information of Each Dataset
For establishing the data citation sub-database for each dataset, the information of citing papers for each dataset from 2014 to 2018 was collected, including the title of dataset, title, DOI, and authors of citation paper, year of the paper published, journal title, journal ISSN, etc.
3.3 Impact Factors Sub-database of Each Citing Journal
The IF information of each citing journal in each year from 2014 to 2018 was collected to establish the IF sub-database for each citing journal.
3.4 DIS Model Sub-database
The DIS models are composed of several models, including:
(1) DIS model for dataset;
(2) DIS model for data publisher;
(3) DIS model for data author;
(4) DIS model for funding agencies;
(5) DIS model for funding projects;
(6) DIS model for ranking (Q1, Q2, Q3, Q4).
3.5 DIS and Ranking in 2019 (Based on Data During 2014–2018)
The DIS results and ranking database include:
(1) DIS ranking for dataset in Q1, Q2, Q3, Q4;
(2) DIS ranking for data publisher;
(3) DIS ranking for data author Q1, Q2, Q3, Q4;
(4) DIS ranking for funding agencies;
(5) DIS ranking for funding projects.
4 Practice on Measuring the Impact of Global Change & Earth System Science Data in 2019
4.1 Dataset Impact Score (DISdataset)
Among the 282 datasets from two data publishers, which were valid application for data impact measuring, 192 datasets were cited, with a citation rate of 68.09%. The authors of these datasets were 565 individuals.
The method of calculating the DIS of each dataset for five years is based on two steps. The first step is to calculate the DIS for each of the datasets each year[1] and then summarize the DIS for five years during 2014–2018. The model of DIS for a dataset for five years is shown in the following formula:
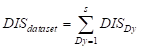 (1)
(1)
where DISDy is the dataset impact score in y year.
4.2 DIS Summary for the 192 Cited Datasets in Five Years (2014–2018)
The DIS for the 192 cited datasets in five years (2014–2018) is summarized in Table 1.
Table 1 Statistics of 192 cited datasets in five years (2014–2018)
|
Year
|
Cited No.
|
|
DIS
|
Mean of journals’ impact factor
|
|
Journal in Chinese
|
Journal in English
|
Sum
|
|
Journal in Chinese
|
Journal in English
|
Sum
|
|
2014
|
30
|
0
|
30
|
|
69
|
0
|
69
|
2.300,0
|
|
2015
|
2
|
5
|
7
|
|
2.786
|
15.144
|
17.93
|
2.561,4
|
|
2016
|
6
|
9
|
15
|
|
7.913
|
68.302
|
76.215
|
5.081,0
|
|
2017
|
20
|
82
|
102
|
|
18.080,5
|
78.533
|
96.613,5
|
0.947,2
|
|
2018
|
30
|
140
|
170
|
|
36.289,9
|
150.122
|
186.411,9
|
1.096,5
|
|
Sum
|
88
|
236
|
324
|
|
134.069,4
|
312.101
|
446.170,4
|
1.377,1
|
From 2014 to 2018, 192 datasets were cited for 324 times in total, and the DIS in 5 years was 446.170,4, and the average IF of citing journals was 1.377,1. There are 236 citing articles in English journals, accounting for 72.84%, while, there are 88 citing articles in Chinese journals, accounting for 27.16%. DIS calculated from the citation by English journals is 312.101, accounting for 69.95%, and that by Chinese journals is 134.069,4, accounting for 30.05%. DIS in English journals is about 2.33 times of that in Chinese journals. For both the cited times and DIS, English journals is higher than ·Chinese journals.
4.3 DISdataset Ranking for Four Portions
Based on the DISdataset calculated results, 4 portions were divided as the following:
(1) Q1: the 5-year DISdataset is ranking top 5% with DIS more than 6, and there are 10 datasets on the list of Q1 (Table 2).
(2) Q2: the 5-year DISdataset is ranking between 5%–15% with DIS more than 2, and there are 24 datasets on the list of Q2 (Table 3).
(3) Q3: the 5-year DISdataset is ranking between 15%–30% with DIS more than 0.2, and there are 41 datasets on the list of Q3.
(4) Q4: the 5-year DISdataset is ranking in the last 50% with DIS less than 0.2, and there are 117 datasets on the list of Q4.
4.4 Analysis on DISdataset in Q1
There were 10 datasets ranking in Q1 as listed in Table 4. As can be seen from Table 4, the 10 datasets in Q1 were cited 115 times in total, with 75 times cited by English journals, accounting for 65.22%, and 40 times cited by Chinese journals, accounting for 34.78%. DISdataset calculated by English journal citations is 246.206, accounting for 78.02%, and by Chinese journal citation is 69.368,3, accounting for 21.98%. It is about 3.55 times for English journals as that for Chinese journals. The average IF of citing journals is 2.744,1. For both the citing times and DISdataset, English journals is higher than Chinese journals.
Table 2 Statistics of DIS ranking Top 5% (Q1) Datasets in five years (2014–2018)
|
Year
|
Cited No.
|
|
DIS
|
Mean of journals’ impact factor
|
|
Journal in Chinese
|
Journal in English
|
Sum
|
|
Journal in Chinese
|
Journal in English
|
Sum
|
|
2014
|
17
|
0
|
17
|
|
39.1
|
0
|
39.1
|
2.300,0
|
|
2015
|
1
|
4
|
5
|
|
0.932,8
|
12.222
|
13.154,8
|
2.631,0
|
|
2016
|
6
|
7
|
13
|
|
7.913
|
65.441
|
73.354
|
5.642,6
|
|
2017
|
7
|
17
|
24
|
|
6.715
|
55.059
|
61.774
|
2.573,9
|
|
2018
|
9
|
47
|
56
|
|
14.707,5
|
113.484
|
128.191,5
|
2.289,1
|
|
Sum
|
40
|
75
|
115
|
|
69.368,3
|
246.206
|
315.574,3
|
2.744,1
|
Table 3 List of DIS ranking top 5% (Q1) Datasets in five years (2014–2018)
|
No.
|
Title
|
Author(s)
|
Dataset’s DOI
|
Publisher’s DOI
|
DIS
|
|
1
|
1 km grid population dataset of China[6]
|
Fu, J. Y., Jiang, D., Huang, Y. H.
|
10.3974/geodb.2014.01.06.V1
|
10.3974/
|
113.508,6
|
|
2
|
Datasets of the boundary and area of the Tibetan Plateau[7]
|
Zhang, Y. L., Li, B. Y., Zheng, D.
|
10.3974/geodb.2014.01.12.V1
|
10.3974/
|
94.067,2
|
|
3
|
1 km grid GDP data of China (2005, 2010)[8]
|
Huang, Y. H., Jiang D., Fu, J. Y.
|
10.3974/geodb.2014.01.07.V1
|
10.3974/
|
55.676,3
|
|
4
|
Time series of land ecosystem classification dataset of China in five-year increments[9]
|
Xu, X. L., Liu, J. Y., Zhang, Z. X., et al.
|
10.3974/geodb.2015.01.01.V1
|
10.3974/
|
11.766,6
|
|
5
|
Eco-regional boundary data of the roof of the world[10]
|
Liu, C., Shi, R. X., Chen, W. B.
|
10.3974/geodb.2014.01.01.V1
|
10.3974/
|
9.560,0
|
|
6
|
Elevation cluster dataset covering the eco-region of the roof of the world [11]
|
Liu, C., Shi, R. X., Lv, T. T., et al.
|
10.3974/geodb.2014.01.03.V1
|
10.3974/
|
6.900,0
|
|
7
|
Land slope cluster dataset of the eco-region of the roof of the world[12]
|
Liu, C., Shi, R. X., Lv, T. T., et al.
|
10.3974/geodb.2014.01.02.V1
|
10.3974/
|
6.900,0
|
|
8
|
Cropping rotation system data of China[13]
|
Xu, X. L., Liu, L.
|
10.3974/geodb.2014.01.08.V1
|
10.3974/
|
6.868,6
|
|
9
|
1 km/5-day NDVI product over China and the association of southeast Asian nations for 2013[14]
|
Li, J., Zeng, Y. L., Liu, Q. H., et al.
|
10.3974/geodb.2015.01.16.V1
|
10.3974/
|
6.697,0
|
|
10
|
1 km/5 day surface reflectance product over China and the association of southeast Asian nations for 2013[15]
|
Zhong, B., Wu, S. L., Liu, Q. H., et al.
|
10.3974/geodb.2015.02.02.V1
|
10.3974/
|
6.697,0
|
Table 4 List of DIS ranking top 5%–15% (Q2) datasets in five years (2014–2018)
|
No.
|
Title
|
Author(s)
|
Dataset’s DOI
|
Publisher’s DOI
|
DIS
|
|
1
|
Dataset of mangroves in southeast Asia[16]
|
Lv, T. T., Zhou, X., Liu, C., et al.
|
10.3974/geodb.2015.01.08.V1
|
10.3974/
|
5.994
|
|
2
|
The 60 hm2 plot in situ multi-scale species dataset in Jianfengling tropical montane rainforest, Hainan island, China[17]
|
Li, Y. P., Xu, H., Li, Y. D., et al.
|
10.3974/geodb.2017.02.05.V1
|
10.3974/
|
5.172
|
|
3
|
Pollutant coefficients data of livestock industry at provincial level in China[18]
|
Zhou, T. M., Zhu, Y. Q., Fu, Q., et al.
|
10.3974/geodb.2014.01.10.V1
|
10.3974/
|
5.041
|
|
4
|
Historical monthly temperature data of China at 1km resolution[19]
|
Jing, W. L., Yang, Y. P., Feng, M., et al.
|
10.3974/geodb.2015.01.02.V1
|
10.3974/
|
4.706
|
|
5
|
1 km/5 d fractional vegetation cover dataset in the belt and road and surround region (2015)[20]
|
Li, J., Liu, Q. H., Zhao, J., et al.
|
10.3974/geodb.2017.04.18.V1
|
10.3974/
|
4.61
|
|
6
|
Global land surface water dataset at 30 m resolution (2010)[21]
|
Chen, J., Liao, A. P., Chen, L. J., et al.
|
10.3974/geodb.2014.02.01.V1
|
10.3974/
|
4.003,2
|
|
7
|
Remotely sensed dataset of grassland degradation on the Qinghai-Tibetan plateau[22]
|
Wang, L., Xu, X. L., Liu, L.
|
10.3974/geodb.2014.01.11.V1
|
10.3974/
|
4.002,4
|
|
8
|
1 km/daily evapotranspiration product over China and the association of southeast Asian nations for 2013[23]
|
Jia, L., Hu, G. C., Zheng, C. L., et al.
|
10.3974/geodb.2015.01.11.V1
|
10.3974/
|
3.646
|
|
9
|
Boundary data of loess plateau region[24]
|
Wang, Z. X.
|
10.3974/geodb.2015.01.09.V1
|
10.3974/
|
3.526
|
|
10
|
Time series of land ecosystem classification dataset of China in five-year increments[25]
|
Xu, X. L., Liu, J. Y., Zhang, Z. X., et al.
|
10.3974/geodb.2015.01.01.V1
|
10.3974/
|
3.51
|
|
11
|
Suitability assessment data on marginal land resources for cultivating bio-energy crops of Asia[26]
|
Jiang, D., Fu, J. Y., Huang, Y. H.
|
10.3974/geodb.2014.01.04.V1
|
10.3974/
|
3.338
|
|
12
|
Global artificial land surface dataset at 30 m resolution (2010)[27]
|
Chen, J., Liao, A. P., Chen, L. J., et al.
|
10.3974/geodb.2014.02.02.V1
|
10.3974/
|
3.162
|
|
13
|
Dataset of percentile-based Etccdi temperature extremes indices for cmip5 model output[28]
|
Yang, C.
|
10.3974/geodb.2017.02.09.V1
|
10.3974/
|
3.1
|
|
14
|
Remote sensing based forest phenology data of northeast of China[29]
|
Yu, X. F., Zhuang, D. F., Wang, Q. K.
|
10.3974/geodb.2014.01.14.V1
|
10.3974/
|
2.42
|
|
15
|
Hydrothermal conditions change data of China in 1 km resolution in decades from 1951 to 2010[30]
|
Ning, X. J., Qin, Y. C., Cui, Y. P., et al.
|
10.3974/geodb.2016.01.07.V1
|
10.3974/
|
2.329
|
|
16
|
Time series of snow cover data of northeast of China (2003–2013)[31]
|
Chen, S. B., Yang, Q., Xie, H. J., et al.
|
10.3974/geodb.2014.01.15.V1
|
10.3974/
|
2.3
|
|
17
|
The gridded dataset of spring phenology of Fraxinus Chinensis in China from 1952 to 2007[32]
|
Ge, Q. S., Dai, J. H., Liu, H. L., et al.
|
10.3974/geodb.2014.01.19.V1
|
10.3974/
|
2.3
|
|
18
|
Typical plant phenological observation dataset of Chinese phenological observation network, Beijing (1963—2012)[33]
|
Ge, Q. S., Dai, J. H., Wang, H. J.
|
10.3974/geodb.2014.01.09.V1
|
10.3974/
|
2.3
|
|
19
|
Professor Lin Chao—pioneer of Chinese geographers in GU—remembering Lin Chao in his 100th birthday[34]
|
Hong, S. R., Lin, Y. X.
|
10.3974/geodb.2014.01.20.V1
|
10.3974/
|
2.3
|
|
20
|
Dataset of post stamps on rocket and satellite (1957–1959)[35]
|
Liu, C.
|
10.3974/geodb.2014.01.05.V1
|
10.3974/
|
2.3
|
|
21
|
Soil sample data for locust plague analysis around Baiyangdian lake in 2002[36]
|
Shi, R. X.
|
10.3974/geodb.2014.01.16.V1
|
10.3974/
|
2.3
|
|
22
|
Average soil potential productivity of Hunan province, China, 1981–2010[37]
|
Sun, W., Guo, C. X., Zhu, Y. Q.
|
10.3974/geodb.2014.01.18.V1
|
10.3974/
|
2.3
|
|
23
|
Dataset of winter fallow land in middle and lower reaches of Yangtze river (2007–2008)[38]
|
Xu, X. L., Zhai, M. Y, Liu, L.
|
10.3974/geodb.2014.01.17.V1
|
10.3974/
|
2.3
|
|
24
|
Dataset of regional vegetation changes from 1981–2009 in the Qinghai- Tibet plateau[39]
|
Yu, B. H., Lv, C. H., Lv, T. T., et al.
|
10.3974/geodb.2014.01.13.V1
|
10.3974/
|
2.3
|
5 DISA Ranking
According to the DIS model of data author[1] and statistics data in 2019, the 5-year DISA (2014–2018) were obtained for each of the 565 data authors. There were 28 authors ranked Q1 (top 5%) in 2019 (Table 5). The certificate was given to each Q1 dataset and data authors at the 2019 BigData_WC/GSC Conference (Figure 2). Among them, 16 are from the institute of geographic Sciences and Natural Resources Research, Chinese Academy of Sciences, accounting for 57.14% of the authors in Q1, and 7 are from the Institute of Remote Sensing and Digital Earth, Chinese Academy of Sciences, accounting for 25%.
Table 5 List of DISA ranking top 5% (Q1) authors (28 among 565) in five years (2014-2018)
|
No.
|
Author
|
Organization
|
DIS
|
|
1
|
Fu, J. Y.
|
Institute of Geographic Sciences and Natural Resources Research, Chinese Academy of Sciences (CAS)
|
71.507,9
|
|
2
|
Huang, Y. H.
|
Institute of Geographic Sciences and Natural Resources Research, CAS
|
57.049,8
|
|
3
|
Zhang, Y. L.
|
Institute of Geographic Sciences and Natural Resources Research, CAS
|
47.033,6
|
|
4
|
Jiang, D.
|
Institute of Geographic Sciences and Natural Resources Research, CAS
|
43.969,0
|
|
5
|
Zheng, D.
|
Institute of Geographic Sciences and Natural Resources Research, CAS
|
23.516,8
|
|
6
|
Li, B. Y.
|
Institute of Geographic Sciences and Natural Resources Research, CAS
|
23.516,8
|
|
7
|
Liu, C.
|
Institute of Geographic Sciences and Natural Resources Research, CAS
|
16.579,3
|
|
8
|
Xu, X. L.
|
Institute of Geographic Sciences and Natural Resources Research, CAS
|
13.230,7
|
|
9
|
Shi, R. X.
|
Institute of Geographic Sciences and Natural Resources Research, CAS
|
9.021,3
|
|
10
|
Li, J.
|
Institute of Remote Sensing and Digital Earth (RADI), CAS
|
5.777,3
|
|
11
|
Lv, T. T.
|
Institute of Remote Sensing and Digital Earth (RADI), CAS
|
5.084,5
|
|
12
|
Liu, L.
|
Xinjiang Institute of Ecology and Geography (XIEG), CAS
|
5.009,9
|
|
13
|
Wang, Z. X.
|
Institute of Remote Sensing and Digital Earth (RADI), CAS
|
4.197,3
|
|
14
|
Zhong, B.
|
Institute of Remote Sensing and Digital Earth (RADI), CAS
|
3.856,0
|
|
15
|
Liu, J. Y.
|
Institute of Geographic Sciences and Natural Resources Research, CAS
|
3.819,2
|
|
16
|
Chen, J.
|
National Geomatics Center of China
|
3.582,6
|
|
17
|
Chen, W. B.
|
Keio University
|
3.432,5
|
|
18
|
Yang, C.
|
Beijing Normal University
|
3.220,0
|
|
19
|
Liu, Q. H.
|
Institute of Remote Sensing and Digital Earth (RADI), CAS
|
3.003,7
|
|
20
|
Li, Y. P.
|
Research Institute of Tropical Forestry, Chinese Academy of Forestry Sciences
|
2.586,0
|
|
21
|
Zhou, T. M.
|
Institute of Geographic Sciences and Natural Resources Research, Chinese Academy of Sciences (CAS)
|
2.520,5
|
|
22
|
Jing, W. L.
|
Institute of Geographic Sciences and Natural Resources Research, CAS
|
2.353,0
|
|
23
|
Ge, Q. S.
|
Institute of Geographic Sciences and Natural Resources Research, CAS
|
2.300,0
|
|
24
|
Wang, L.
|
Institute of Geographic Sciences and Natural Resources Research, CAS
|
2.001,2
|
|
25
|
Wu, S. L.
|
Institute of Remote Sensing and Digital Earth (RADI), CAS
|
1.960,3
|
|
26
|
Zhou, X.
|
Institute of Remote Sensing and Digital Earth (RADI), CAS
|
1.959,8
|
|
27
|
Zhu, Y. Q.
|
Institute of Geographic Sciences and Natural Resources Research, CAS
|
1.925,3
|
|
28
|
Zhang, Z. X.
|
Institute of Remote Sensing and Digital Earth (RADI), CAS
|
1.909,6
|
6 DISp Ranking
Based on the statistics of datasets published by each data publisher and the DISdataset of each dataset, the DISp for each publisher in 5 years was calculated. The calculation method is as follows:
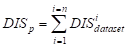 (2)
(2)
where DISp is the sum of DIS in 5 years for the data publisher, and n is the number of dataset published from 2014 to 2018. The DISi dataset was the impact score of the ith dataset from 2014 to 2018.
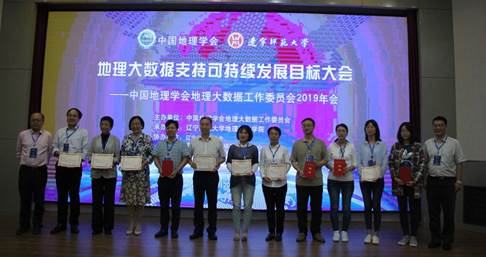
Figure 2 Prof. Liao Xiaohan, Chair of BigData_WC/GSC and Prof. Lu, Huayu, Vice President of GSC presented the certificates to each of the datasets and data authors in Q1 (September 21, 2019, Dalian, China)
According to the above calculation results, the Global Change Research Data Publishing & Repository (GCdataPR)[5] (DOI: 10.3974/) co-operated by the Institute of Geographic Sciences and Natural Resources Research (IGSNRR), CAS, and the Geographical Society of China (GSC) published 161 datasets, with credited DISp of 416.001,9, while the Geoscientific Data & Discovery Publishing System[6] (DOI: 10.23650/) operated by the National Geolog-ical Archive and superintended by the Ministry of Natural Resources of P. R. China, published 31 datasets, with the DISp of 30.048,5 (Table 6).
Table 6 Statistics of DIS for data publishers in five years (2014–2018)
|
Publishing center
|
Sponsor
|
Organization
|
DOI
|
Number of cited datasets
|
Citing number
|
DISp
|
Mean of journals’ impact factor
|
|
Global Chang Research Data Publishing & Repository
|
IGSNRR, GSC
|
CAS
|
10.3974/
|
161
|
291
|
416.001,9
|
1.429,6
|
|
Geoscientific Data & Discovery Publishing System
|
National Geological Archive, China
|
Ministry of Natural Resources of P. R. China
|
10.23650/
|
31
|
31
|
30.048,5
|
0.969,3
|
7 Examples of the Most Impact Dataset

Figure 3 Statistics of data citation on “1 km grid population dataset of China”
7.1 Example 1: “1 km Grid Population Dataset of China”
The “1 km grid population dataset of China” (DOI: 10.3974/geodb2014.01.06.V1) was published by GCdataPR in June 2014. Three authors were Fu, Jingying, Jang, Dong, and Huang, Yaohuan. During the five years from 2014 to 2018, it was cited for 42 times, and the total DISdataset was 113.508,6, which was listed as top 5% (Q1) in 2019.
Among the 42 citation papers, the highest IF paper was “Satellite-based mapping of daily high-resolution ground PM2.5 in China via space-time regression” (DOI: 10.1016/j.rse 2017.12.018) published in the journal of Remote Sensing of Environment (ISSN 0034-4257) in 2018, and the journal’s IF was 6.457. The number of dataset citations increased year by year in the last five years (Figure 3). More detailed records of citations are listed in Table 7.
Table 7 Statistics of data citation on “1 km grid population dataset of China”??2014–2018??
|
No.
|
Title
|
DOI of citing paper
|
Citing journal
|
ISSN
|
Citing date
|
Impact factor
|
|
1
|
1 km grid population dataset of China[40]
|
10.11821/dlxb2014S006
|
Acta Geographica Sinica
|
0375-5444
|
2014
|
2.3
|
|
2
|
Daily estimation of ground-level pm2.5 concentrations over Beijing using 3 km resolution modis aod[41]
|
10.1021/acs.est.5b01413
|
Environment Science & Technology
|
0013-936X
|
2015
|
5.393
|
|
3
|
An estimation model of population in China using time series DMSP night-time satellite imagery from 2002–2010[42]
|
10.1117/12.2207575
|
International Conference on Intelligent Earth Observing and Application
|
|
2015
|
0
|
|
4
|
Contamination of phthalate esters, organochlorine pesticides and polybrominated diphenyl ethers in agricultural soils from the Yangtze river delta of China[43]
|
10.1016/j.scitotenv.2015.12.012
|
Science of the Total Environment
|
0048-9697
|
2016
|
4.9
|
|
5
|
Comparison of socioeconomic factors between surrounding and non-surrounding areas of the Qinghai-Tibet railway before and after its construction[44]
|
10.3390/su8080776
|
Sustainability
|
2071-1050
|
2016
|
1.789
|
|
6
|
Study on grid refinement for population distribution based on DMSP/OLS[45]
|
10.3969/j.issn.1000-0666.2016.02.020
|
Journal of Seismological Research
|
1000-0666
|
2016
|
0.417,1
|
|
7
|
Preliminary numerical simulation of air pollution in Hefei with GIS data[46]
|
10.13671/j.hjkxxb.2016.0100
|
Acta Scientiae Circumstantiae
|
0253-2468
|
2016
|
1.217,5
|
|
8
|
Forest fire risk assessment for China under different climate scenarios[47]
|
10.13287/j.1001-9332.201603.034
|
Chinese Journal of Applied Ecology
|
1001-9332
|
2016
|
1.679,5
|
|
9
|
Predicting malaria vector distribution under climate change scenarios in China: challenges for malaria elimination[48]
|
10.1038/srep20604
|
Scientific Reports
|
2045-2322
|
2016
|
4.122
|
|
10
|
The air quality and health impacts of domestic trans-boundary pollution in various regions of China[49]
|
10.1016/j.envint.2016.08.004
|
Environment International
|
0160-4120
|
2016
|
7.297
|
|
11
|
The relief degree of land surface and its correlation with population distribution of Chaohu watershed[50]
|
–
|
Science Technology and Engineering
|
1671-1815
|
2016
|
0.12
|
|
12
|
A comprehensive biomass burning emission inventory with high spatial and temporal resolution in China[51]
|
10.5194/acp-17-2839-2017
|
Atmospheric Chemistry and Physics
|
1680-7316
|
2017
|
5.509
|
|
13
|
Development of a high-resolution emission inventory and its evaluation and application through air quality modeling for Jiangsu province, China[52]
|
10.5194/acp-17-211-2017
|
Atmospheric Chemistry and Physics
|
1680-7316
|
2017
|
5.509
|
|
14
|
Impacts of 1.5 and 2 °C global warming on water availability and extreme hydrological events in Yiluo and Beijiang River catchments in China[53]
|
10.1007/s10584-017-2072-3
|
Climatic Change
|
0165-0009
|
2017
|
3.537
|
|
15
|
Water scarcity under various socio-economic pathways and its potential effects on food production in the yellow river basin[54]
|
10.5194/hess-2016-188
|
Hydrology and Earth System Sciences
|
1027-5606
|
2017
|
4.256
|
|
15
|
Fire dynamics under monsoonal climate in Yunnan, SW China: past, present and future[55]
|
10.1016/j.palaeo.2016.10.028
|
Palaeogeography, Palaeoclimatology, Palaeoecology
|
0031-0182
|
2017
|
2.375
|
|
17
|
Impacts of sanitation improvement on reduction of nitrogen discharges entering the ENV. from human excreta in China[56]
|
10.1016/j.scitotenv.2017.03.177
|
Science of the Total Environment
|
0048-9697
|
2017
|
4.61
|
|
18
|
Relationship between provision and reception of ecological service of carbon fixation and oxygen release in Beijing-Tianjin-Hebei region[57]
|
10.11934/j.issn.1673-4831.2017.09.003
|
Journal of Ecology and Rural Environment
|
1673-4831
|
2017
|
0.911,2
|
|
19
|
Emission inventory of water soluble ions in fine particles from residential coal burning in China and implication for emission reduction [58]
|
10.13227/j.hjkx.201707063
|
China Environmental Science
|
1000-6923
|
2017
|
1.714,3
|
|
20
|
“Ghost cities” identification using multi-source remote sensing datasets: a case study in Yangtze river delta[59]
|
10.1016/j.apgeog.2017.02.004
|
Applied Geography
|
0143-6228
|
2017
|
3.117
|
|
21
|
Global change research data publishing & sharing rankings[60]
|
10.3974/geodp.2018.03.01
|
Journal of Global Change Data & Discovery
|
2096-3645
|
2018
|
0.12
|
|
22
|
Analysis to the highest impact dataset 2018 from the geographical society of China[61]
|
10.3974/geodp.2018.03.02
|
Journal of Global Change Data & Discovery
|
2096-3645
|
2018
|
0.12
|
|
23
|
Data impact score (DIS) —a quantitative method of data performance to the
Data-driven sciences [1]
|
10.3974/geodb.2018.02.02
|
Journal of Global Change Data & Discovery
|
2096-3645
|
2018
|
0.12
|
|
24
|
Optimal redistribution of an urban air quality monitoring network using atmospheric dispersion model and genetic algorithm[62]
|
10.1016/j.atmosenv.2018.01.011
|
Atmosphere Environment
|
1352-2310
|
2018
|
3.708
|
|
25
|
Mapping human influence intensity in the Tibetan Plateau for conservation of ecological service functions[63]
|
10.1016/j.ecoser.2017.10.003
|
Ecosystem Service
|
2212-0416
|
2018
|
4.395
|
|
26
|
Pedodiversity and its controlling factors in mountain regions—a case study of Taihang Mountain, China[64]
|
10.1016/j.geoderma.2017.09.027
|
Geoderma
|
0016-7061
|
2018
|
3.74
|
|
27
|
Resilience analysis of countries under disasters based on multisource data[65]
|
10.1111/risa.12807
|
Risk Analysis
|
0272-4332
|
2018
|
2.898
|
|
28
|
Simulation and projection of the spatial sattern of the Population in Beijing under the background of non-capital function extraction[66]
|
10.12082/dqxxkx.2018.170368
|
Journal of Geo-Information Science
|
1560-8999
|
2018
|
0.798,9
|
|
29
|
Application of the LUR model in the prediction of spatial distributions of soil heavy metals[67]
|
10.13227/j.hjkx.201704024
|
Environmental Science
|
0250-3301
|
2018
|
1.731,8
|
|
30
|
Research on the geo-environment in the era of big data[68]
|
10.3981/j.issn.1000-7857.2018.03.005
|
Science and Technology Review
|
1000-7857
|
2018
|
0.292,3
|
|
31
|
Potential threats from variations of hydrological parameters to the Yellow River and Pearl River Basins in China over the next 30 years[69]
|
10.3390/w10070883
|
Water
|
2073-4441
|
2018
|
2.069
|
|
32
|
Impact of land-cover layout on particulate matter 2.5 in urban areas of China[70]
|
10.1080/17538947.2018.1530310
|
International Journal of Digital Earth
|
1753-8947
|
2018
|
2.746
|
|
33
|
Satellite-based mapping of daily high-resolution ground PM2.5 in China via space-time regression modeling[71]
|
10.1016/j.rse.2017.12.018
|
Remote sensing of Environment
|
0034-4257
|
2018
|
6.457
|
|
34
|
The impacts of climate change and human activities on alpine vegetation and permafrost in the Qinghai-Tibet Engineering Corridor[72]
|
10.1016/j.ecolind.2018.04.067
|
Ecological Indicators
|
1470-160X
|
2018
|
3.983
|
|
35
|
Development of an asset value map for disaster risk assessment in China by spatial disaggregation using ancillary remote sensing data[73]
|
10.1111/risa.12806
|
Risk Analysis
|
0272-4332
|
2018
|
2.898
|
|
36
|
Study of car-sharing diffusion criticality conditions based on human traveling network[74]
|
10.1142/S0129183118400090
|
International Journal of Modern Physics C
|
0129-1831
|
2018
|
0.919
|
|
37
|
Spatiotemporal variations in satellite-based formaldehyde (HCHO) in the Beijing-Tianjin-Hebei region in China from 2005 to 2015[75]
|
10.3390/atmos9010005
|
Atmosphere
|
2073-4433
|
2018
|
1.704
|
|
38
|
Satellite-based high-
resolution pm2. 5 estimation over the Beiing-Tianjin-Hebei region of China using an improved geographically and temporally weighted regression model[76]
|
10.1016/j.envpol.2018.01.053
|
Environmental Pollution
|
0269-7491
|
2018
|
4.358
|
|
39
|
Assessing local resilience to typhoon disasters: a case study in Nansha, Guangzhou[77]
|
10.1371/journal.pone.0190701
|
PLoS ONE
|
1932-6203
|
2018
|
2.766
|
|
40
|
Spatial distribution and change of population in Guizhou based on stratigraphic and topographic conditions[78]
|
–
|
Guizhou Science
|
1003-6563
|
2018
|
0
|
|
41
|
Impacts of sectoral emissions in China and the implications: air quality, public health, crop production, and economic costs[79]
|
10.1088/1748-9326/aad138
|
Environmental Research Letters
|
1748-9326
|
2018
|
4.541
|
|
42
|
Are all cities with similar urban form or not? Redefining cities with ubiquitous points of interest and evaluating them with indicators at city and block levels in China[80]
|
10.1080/13658816.2018.1511793
|
International Journal of Geographical Information Science
|
1365-8816
|
2018
|
2.37
|
|
Sum in five years (2014–2018): cited 42, DIS 113.508,6, mean of the citing journal’s impact factor 2.70
|
7.2 Example 2: “Datasets of the Boundary and Area of the Tibetan Plateau”
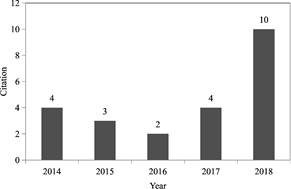
Figure 4 Statistics of data citation on “Datasets of the boundary and area of the Tibetan Plateau”
The “Datasets of the boundary and area of the Tibetan Plateau” (DOI: 10.3974/geodb.2014.01.12.V1) was published by GCdataPR in June 2014. Three authors are Zhang, Yili, Li, Bingyuan, and Zheng, Du. During the five years from 2014 to 2018, it was cited for 23 times, and the total DISdataset was 94.067,2, which was listed as top 5% (Q1) in 2019.
Among the 23 citing papers, the highest IF paper is “High-resolution mapping of global surface water and its long-term changes” (DOI: 10.1038/ nature20584) in Nature (ISSN 0028-0836) in 2016. The IF of Nature in 2016 was 40.137. The detailed records of the dataset citations are listed in Figure 4 and Table 8.
Table 8 Statistics of data citation on “Datasets of the boundary and area of the Tibetan Plateau” (2014–2018)
|
No.
|
Title
|
DOI of citing paper
|
Citing journal
|
ISSN
|
Citing date
|
Impact factor
|
|
1
|
Remotely sensed dataset of grassland degradation on the Qinghai-Tibetan Plateau[81]
|
10.11821/dlxb2014S011
|
Acta Geographica Sinica
|
0375-5444
|
2014
|
2.3
|
|
2
|
Datasets of the boundary and area of the Tibetan Plateau[82]
|
10.11821/dlxb2014S012
|
Aata Geographica Sinica
|
0375-5444
|
2014
|
2.3
|
|
3
|
Dataset of regional vegetation changes from 1981 to 2006 in the Qinghai-Tibet Plateau[83]
|
10.11821/dlxb2014S013
|
Acta Geographica Sinica
|
0375-5444
|
2014
|
2.3
|
|
4
|
Eco-regional boundary data of the roof of the world[84]
|
10.11821/dlxb2014S001
|
Acta Geographica Sinica
|
0375-5444
|
2014
|
2.3
|
|
5
|
Changes in the timing and duration of the near-surface soil freeze/thaw status from 1956 to 2006 across China[85]
|
10.5194/tc-9-1321-2015
|
Cryosphere
|
1994-0416
|
2015
|
4.906
|
|
6
|
Recent changes in wetlands on the Tibetan Plateau: a review[86]
|
10.1007/s11442-015-1208-5
|
Journal of Geographical Sciences
|
1009-637X
|
2015
|
1.923
|
|
7
|
Characteristics and protection effectiveness of nature reserves on the Tibetan Plateau, China[87]
|
-
|
Resources Science
|
1007-7588
|
2015
|
0.932,8
|
|
8
|
High-resolution mapping of global surface water and its long-term changes[88]
|
10.1038/nature20584
|
Nature
|
0028-0836
|
2016
|
40.137
|
|
9
|
Reconstruction of the historical crop land data in China using the partition and layering-based gridded method [89]
|
10.11821/dlxb201607005
|
Acta Geographica Sinica
|
0375-5444
|
2016
|
2.799,4
|
|
10
|
Tracing changes in atmospheric moisture supply to the drying southwest China[90]
|
10.5194/acp-17-10383-2017
|
Atmospheric Chemistry and Physics
|
1680-7316
|
2017
|
5.509
|
|
11
|
The dynamic response of lakes in the Tuohepingco basin of the Tibetan Plateau to climate change[91]
|
10.1007/s12665-017-6446-7
|
Environmental Earth Sciences
|
1866-6280
|
2017
|
1.435
|
|
12
|
Glacier changes on the Tibetan Plateau derived from Landsat imagery: mid-1970s-2000-13[92]
|
10.1017/jog.2016.137
|
Journal of Glaciology
|
0022-1430
|
2017
|
3.2
|
|
13
|
Spatial distribution and variation of precipitation in the Qiangtang Plateau[93]
|
10.11821/dlyj201711002
|
Geographical Research
|
1000-0585
|
2017
|
2.5263
|
|
14
|
GIS dataset of boundaries among four geo-eco regions of China [94]
|
10.3974/geodp.2018.01.08
|
Journal of Global Change Data & Discovery
|
2096-3645
|
2018
|
0.12
|
|
15
|
Global change research data publishing & sharing rankings[60]
|
10.3974/geodp.2018.03.01
|
Journal of Global Change Data & Discovery
|
2096-3645
|
2018
|
0.12
|
|
16
|
Analysis to the highest impact dataset 2018 from the geographical society of China[61]
|
10.3974/geodp.2018.03.02
|
Journal of Global Change Data & Discovery
|
2096-3645
|
2018
|
0.12
|
|
17
|
Mapping human influence intensity in the Tibetan Plateau for conservation of ecological service functions[63]
|
10.1016/j.ecoser.2017.10.003
|
Ecosystem Services
|
2212-0416
|
2018
|
4.395
|
|
19
|
Scenarios simulation of vascular plant species abundance distribution on Qinghai-Tibet Plateau[96]
|
10.11821/dlxb201801014
|
Acta Geographica Sinica
|
0375-5444
|
2018
|
3.015,7
|
|
20
|
Soil carbon stocks are underestimated in mountainous regions[97]
|
10.1016/j.geoderma.2018.01.029
|
Geoderma
|
0016-7061
|
2018
|
3.74
|
|
21
|
Grassland ecosystem responses to climate change and human activities within the Three-River Headwaters region of China[98]
|
10.1038/s41598-018-27150-5
|
Scientific Reports
|
2045-2322
|
2018
|
4.122
|
|
22
|
Current challenges in distinguishing climatic and anthropogenic contributions to alpine grassland variation on the Tibetan Plateau[99]
|
10.1002/ece3.4099
|
Ecology and Evolution
|
2045-7758
|
2018
|
2.34
|
|
23
|
The ecosystem carbon storage dataset in Tibet (2001–2010)[100]
|
10.3974/geodp.2018.01.11
|
Journal of Global Change Data & Discovery
|
2096-3645
|
2018
|
0.12
|
|
Sum in five years (2014–2018): cited 23, DIS 94.067,2, mean of the citing journal’s impact factor 4.1
|
8 Discussion
The practice of data impact measuring with the DIS methodology for global change and earth system science data in 2019 shows that the quantitative assessment of the data impact can reach to every dataset, data author, and data publisher. There is a phenomenon that the data citation is normally delaying a few years than that of discovery papers. From Tables 3 and 4, the two cases published by GCdataPR, either a single dataset or a data publisher, the citation delaying is at least 5 years. There may be several reasons. First, it may be that the data published is not well-known at its earlier stage, but it is more and more popular year by year. Second, the scientific achievements made by the dataset re-using are different from the scientific discovery. It requires a process of data re-application, re-integration and then discovery, which takes a longer time than the paper directly adopting the discovery viewpoints. Third, it is possible that data users are not very familiar with how to cite the dataset, and some of users mention their uses in acknowledgement instead of references. Because the data citation is a new specification, as time goes by, the data application and citation in standardization will increase.
As the current statistical data are all datasets published in China, according to the statistics of users’ source of download usage, the Chinese users are far more than that of international users. However, in terms of data citation, the number of citations of Chinese journals is less than that of English journals. This phenomenon indicates that Chinese users probably do not clear how to cite data in references, so they can’t be counted in the DIS model. Therefore, it is necessary to further strengthen the publicity and requirements of new regulation and scientific ethics to promote the standard data citation in China and the editors of each journal also need to strictly check and take the data citation as one of the important part of the paper review.
The peak of the data citations occurs in the last year of the 5-year statistics; does it happen in the fifth year or later? Does different datasets have different lag periods? How long could the data citation peak lag periods be? and when does the peak of data citation occur? It seems need more practice and take a longer time, as well as to have more sufficient data and cases to answer these questions.
Author Contributions
Liu, C. designed the DIS model and data processing procedure, and wrote the paper; Zhang, Y. H. set up the database framework, collected and processed the data.
References
[1] Liu, C. Data Impact Score (DIS)—a quantitative method of data performance to the data-driven sciences [J]. Journal of Global Change Data & Discovery, 2018, 2(2): 135–143. DOI: 10.3974/geodp.2018.02.02.
[2] Liu, C., Ma, J. H., Uhlir, P. F., et al. Challenge and solution for research data citation [J]. Journal of Global Change Data & Discovery, 2018, 2(2): 123–134. DOI: 10.3974/geodp.2018.02.01.
[3] World Data System [OL]. https://www.icsu-wds.org/.
[4] Zhang, W., Shen, Y. Geographic data for sciences and sustainability—Summary of 2019 conference of Geographic Big Data Working Committee of Geographical Society of China [J]. Journal of Global Change Data & Discovery, 2019, 3(3): 308–310. DOI: 10.3974/geodp.2019.03.14.
[5] Journal Citation Reports [OL]. https://jcr.clarivate.com/JCRLandingPageAction.action?wsid=6EKpNNj5m Cwv3EtO4QG&Init=Yes&SrcApp=IC2LS&SID=H4-tHxxYNNFDux2FxxlOByqgMn7Tblox2FcKQf3id-18x2dhjxxx2BSoPx2Baf7Xs0XqhOfBNgx3Dx3D34iaBIOODVHh1p4eZOTmKwx3Dx3D-WwpRYkX4Gz8e7T4uNl5SUQx3Dx3D-wBEj1mx2B0mykql8H4kstFL.
[6] Fu, J. Y., Jiang, D., Huang, Y. H. 1 km grid population dataset of China [DB/OL]. Global Change Research Data Publishing & Repository, 2014. DOI: 10.3974/geodb.2014.01.06.V1.
[7] Zhang, Y. L., Li, B. Y., Zheng, D. Datasets of the boundary and area of the Tibetan Plateau [DB/OL]. Global Change Research Data Publishing & Repository, 2014. DOI: 10.3974/geodb.2014.01.12.V1.
[8] Huang, Y. H., Jiang D., Fu, J. Y. 1 km grid GDP data of China (2005, 2010) [DB/OL]. Global Change Research Data Publishing & Repository, 2014. DOI: 10.3974/geodb.2014.01.07.V1.
[9] Xu, X. L, Liu, J. Y., Zhang, Z. X., et al. Time series of land ecosystem classification dataset of China in five-year increments [DB/OL]. Global Change Research Data Publishing & Repository, 2015. DOI: 10.3974/geodb.2015.01.01.V1.
[10] Liu, C., Shi, R. X., Chen, W. B. Eco-regional boundary data of the roof of the world [DB/OL]. Global Change Research Data Publishing & Repository, 2014. DOI: 10.3974/geodb.2014.01.01.V1.
[11] Liu, C., Shi, R. X., Lv, T. T., et al. Elevation cluster dataset covering the eco-region of the roof of the world [DB/OL]. Global Change Research Data Publishing & Repository, 2014. DOI: 10.3974/geodb. 2014.01.03.V1.
[12] Liu, C., Shi, R. X., Lv, T. T., et al. Land slope cluster dataset of the eco-region of the roof of the world [DB/OL]. Global Change Research Data Publishing & Repository, 2014. DOI: 10.3974/geodb.2014.01.02.V1.
[13] Xu, X. L., Liu, L. Cropping rotation system data of China [DB/OL]. Global Change Research Data Publishing & Repository, 2014. DOI: 10.3974/geodb.2014.01.08.V1.
[14] Li, J., Zeng, Y. L., Liu, Q. H., et al. 1 km/5-day NDVI product over China and the association of southeast Asian nations for 2013 [DB/OL]. Global Change Research Data Publishing & Repository, 2015. DOI: 10.3974/geodb.2015.01.16.V1.
[15] Zhong, B., Wu, S. L., Liu, Q. H., et al. 1 km/5 day surface reflectance product over China and the association of Southeast Asian nations for 2013 [DB/OL]. Global Change Research Data Publishing & Repository, 2015. DOI: 10.3974/geodb.2015.02.02.V1.
[16] Lv, T. T., Zhou, X., Liu, C., et al. Dataset of mangroves in Southeast Asia [DB/OL]. Global Change Research Data Publishing & Repository, 2015. 10.3974/geodb.2015.01.08.V1
[17] Li, Y. P., Xu, H., Li, Y. D., et al. The 60 hm2 plot in situ multi-scale species dataset in Jianfengling tropical montane rainforest, Hainan Island, China [DB/OL]. Global Change Research Data Publishing & Repository, 2017. DOI: 10.3974/geodb.2017.02.05.V1.
[18] Zhou, T. M., Zhu, Y. Q., Fu, Q., et al. Pollutant coefficients data of livestock industry at provincial level in China [DB/OL]. Global Change Research Data Publishing & Repository, 2014. DOI: 10.3974/geodb.2014.01.10.V1.
[19] Jing, W. L., Yang, Y. P., Feng, M., et al. Historical monthly temperature data of China at 1 km resolution [DB/OL]. Global Change Research Data Publishing & Repository, 2015. DOI: 10.3974/geodb.2015.01.02.V1.
[20] Li, J., Liu, Q. H., Zhao, J., et al. 1 km/5 d fractional vegetation cover dataset in the belt and road and surround region (2015) [DB/OL]. Global Change Research Data Publishing & Repository, 2017. DOI: 10.3974/geodb.2017.04.18.V1.
[21] Chen, J., Liao, A. P., Chen, L. J., et al. Global land surface water dataset at 30 m resolution (2010) [DB/OL]. Global Change Research Data Publishing & Repository, DOI: 10.3974/geodb.2014.02.01.V1.
[22] Wang, L., Xu, X. L., Liu, L. Remotely sensed dataset of grassland degradation on the Qinghai-Tibetan plateau [DB/OL]. Global Change Research Data Publishing & Repository, 2014. DOI: 10.3974/geodb.2014.01.11.V1.
[23] Jia, L., Hu, G. C., Zheng, C. L., et al. 1 km/daily evapotranspiration product over China and the association of southeast Asian nations for 2013 [DB/OL]. Global Change Research Data Publishing & Repository, 2015. DOI: 10.3974/geodb.2015.01.11.V1.
[24] Wang, Z. X. Boundary data of Loess Plateau region [DB/OL]. Global Change Research Data Publishing & Repository, 2015. DOI: 10.3974/geodb.2015.01.09.V1.
[25] Xu, X. L., Liu, J. Y., Zhang, Z. X., et al. Time series of land ecosystem classification dataset of China in five-year increments [DB/OL]. Global Change Research Data Publishing & Repository, 2015. DOI: 10.3974/geodb.2015.01.01.V1.
[26] Jiang, D., Fu, J. Y., Huang, Y. H. Suitability assessment data on marginal land resources for cultivating bio-energy crops of Asia [DB/OL]. Global Change Research Data Publishing & Repository, 2014. DOI: 10.3974/geodb.2014.01.04.V1.
[27] Chen, J., Liao, A. P., Chen, L. J., et al. Global artificial land surface dataset at 30 m resolution (2010) [DB/OL]. Global Change Research Data Publishing & Repository, 2014. DOI: 10.3974/geodb.2014.02.02.V1.
[28] Yang, C. Dataset of percentile-based ETCCDI temperature extremes indices for CMIP5 model output [DB/OL]. Global Change Research Data Publishing & Repository, 2017. DOI: 10.3974/ geodb.2017.02.09.V1.
[29] Yu, X. F., Zhuang, D. F., Wang, Q. K. Remote sensing based forest phenology data of northeast of China [DB/OL]. Global Change Research Data Publishing & Repository, 2014. DOI: 10.3974/geodb.2014.01.14.V1.
[30] Ning, X. J., Qin, Y. C., Cui, Y. P., et al. Hydrothermal conditions change data of China in 1km resolution in decades from 1951 to 2010 [DB/OL]. Global Change Research Data Publishing & Repository, 2016. DOI: 10.3974/geodb.2016.01.07.V1.
[31] Chen, S. B., Yang, Q., Xie, H. J., et al. Time series of snow cover data of northeast of China (2003–2013) [DB/OL]. Global Change Research Data Publishing & Repository, 2014. DOI: 10.3974/geodb.2014.01.15.V1.
[32] Ge, Q. S., Dai, J. H., Liu, H. L., et al. Typical plant phenological observation dataset of Chinese phenological observation network, Beijing (1963–2012) [DB/OL]. Global Change Research Data Publishing & Repository, 2014. DOI: 10.3974/geodb.2014.01.19.V1.
[33] Ge, Q. S., Dai, J. H., Wang H. J. The gridded dataset of spring phenology of Fraxinus Chinensis in China from 1952 to 2007 [DB/OL]. Global Change Research Data Publishing & Repository, 2014. DOI: 10.3974/geodb.2014.01.09.V1.
[34] Hong, S. R., Lin, Y. X. Professor Lin, Chao—pioneer of Chinese geographers in IGU—remembering Lin Chao in his 100th birthday [DB/OL]. Global Change Research Data Publishing & Repository, 2014. DOI: 10.3974/geodb.2014.01.20.V1.
[35] Liu, C. Dataset of post stamps on rocket and satellite (1957–1959) [DB/OL]. Global Change Research Data Publishing & Repository, 2014. DOI: 10.3974/geodb.2014.01.05.V1.
[36] Shi, R. X. Soil sample data for locust plague analysis around Baiyangdian lake in 2002 [DB/OL]. Global Change Research Data Publishing & Repository, 2014. DOI: 10.3974/geodb.2014.01.16.V1.
[37] Sun, W., Guo, C. X., Zhu, Y. Q. Average soil potential productivity of Hunan province, China, 1981–2010 [DB/OL]. Global Change Research Data Publishing & Repository, 2014. DOI: 10.3974/geodb.2014.01.18.V1.
[38] Xu, X. L., Zhai, M. Y, Liu, L. Dataset of winter fallow land in middle and lower reaches of Yangtze River (2007–2008) [DB/OL]. Global Change Research Data Publishing & Repository, 2014. DOI: 10.3974/geodb.2014.01.17.V1.
[39] Yu, B. H., Lv, C. H., Lv, T. T., et al. Dataset of regional vegetation changes from 1981–2009 in the Qinghai- Tibet plateau [DB/OL]. Global Change Research Data Publishing & Repository, 2014. DOI: 10.3974/geodb.2014.01.13.V1
[40] Fu, J., Jiang, D., Huang, Y. H. 1 km grid population dataset of China [J]. Acta Geographica Sinica, 2014, 69(Sup.): 136–139. DOI: 10.11821/dlxb2014S006.
[41] Xie, Y. Y., Wang, Y. X., Zhang, K., et al. Daily Estimation of Ground-Level PM2.5 concentrations over Beijing using 3 km resolution MODIS AOD [J]. Environment Science & Technology, 2015, 49(20): 12280–12288. DOI: 10.1021/acs.est.5b01413.
[42] Zhang, X. Y., Zhang, Z. J., Chang, Y. G., et al. An estimation model of population in China using time series DMSP night-time satellite imagery from 2002–2010 [C]. International Conference on Intelligent earth Observing and Application, 2015, 9808: 9808D. DOI: 10.1117/12.2207575.
[43] Sun, J. T., Pan, L. L., Zhan, Y., et al. Contamination of phthalate esters, organochlorine pesticides and polybrominated diphenyl ethers in agricultural soils from the Yangtze River Delta of China [J]. Science of the Total Environment, 2016, 544: 670–676. DOI: 10.1016/j.scitotenv.2015.12.012.
[44] Li, S. C., Wang, Z. F., Zhang, Y. L., et al. Comparison of socioeconomic factors between surrounding and non-surrounding areas of the Qinghai-Tibet Railway before and after its construction [J]. Sustainability, 2016, 8(8): 776. DOI: 10.3390/su8080776.
[45] Guo, S. S., Gong, J., Yo, J. F. Study on grid refinement for population distribution based on DMSP/OLS [J]. Journal of Seismological Research, 2016, 39(2): 321–326. DOI: 10.3969/j.issn.1000-0666.2016.02.020.
[46] Wang, H., Wu, H., Zhou, R. J., et al. Preliminary numerical simulation of air pollution in Hefei with GIS data [J]. Acta Scientiae Circumstantiae, 2016, 36(11): 3902–3912. DOI: 10.13671/j.hjkxxb.2016.0100
[47] Tian, X. R., Dai, X., Wang, M. Y., et al. Forest fire risk assessment for China under different climate scenarios [J]. Chinese Journal of Applied Ecology, 2016, 27(3): 769–776. DOI: 10.13287/j.1001-9332.201603.034.
[48] Ren, Z. P., Wang, D. Q., Ma, A. M., et al. Predicting malaria vector distribution under climate change scenarios in China: Challenges for malaria elimination [J]. Scientific Reports, 2016, 6: 20604. DOI: 10.1038/srep20604.
[49] Gu, Y., Yim, S. H. L. The air quality and health impacts of domestic trans-boundary pollution in various regions of China [J]. Environment International, 2016, 97: 117–124. DOI: 10.1016/j.envint.2016.08.004
[50] Chen, H. L., Xiao, W., Wang, Z., et al. The relief degree of land Surface and its correlation with population distribution of Chaohu Watershed [J]. Science Technology and Engineering, 2016, 16(17): 108–112, 144.
[51] Zhou, Y., Xing, X. F., Lang, J. L., et al. A comprehensive biomass burning emission inventory with high spatial and temporal resolution in China [J]. Atmospheric Chemistry and Physics, 2017, 17(4): 2839–2864. DOI: 10.5194/acp-17-2839-2017.
[52] Zhou, Y. D., Zhao, Y., Mao, P., et al. Development of a high-resolution emission inventory and its evaluation and application through air quality modeling for Jiangsu province, China [J]. Atmospheric Chemistry and Physics, 2017, 17: 211–233. DOI: 10.5194/acp-17-211-2017.
[53] Liu, L. L., Xu, H. M., Wang, Y. Impacts of 1.5 and 2 °C global warming on water availability and extreme hydrological events in Yiluo and Beijiang River catchments in China [J]. Climatic Change, 2017, 145(1-2): 145–148. DOI: 10.1007/s10584-017-2072-3.
[54] Yin, Y. Y., Tang, Q. H., Liu, X. C., et al. Water scarcity under various socio-economic pathways and its potential effects on food production in the Yellow River basin [J]. Hydrology and Earth System Sciences, 2017, 21(2): 791–804. DOI: 10.5194/hess-2016-188.
[55] Li, S. F., Hughes, A. C., Su, T., et al. Fire dynamics under monsoonal climate in Yunnan, SW China: past, present and future [J]. Palaeogeography, Palaeoclimatology, Palaeoecology, 2017, 465(part A): 168–176. DOI: 10.1016/j.palaeo.2016.10.028.
[56] Tong, Y. D., Bu, X. G., Chen. C, et al. Impacts of sanitation improvement on reduction of nitrogen discharges entering the environment from human excreta in China [J]. Science of the Total Environment, 2017, 593-594: 439–448. DOI: 10.1016/j.scitotenv.2017.03.177.
[57] Nian, W., Chen, Y. M., Gao, J. X., et al. Relationship between provision and reception of ecological service of carbon fixation and oxygen release in Beijing-Tianjin-Hebei region [J]. Journal of Ecology and rural Environment, 2017, 33(9): 783–791. DOI: 10.11934/j.issn.1673-4831.2017.09.003.
[58] Yan, Q., Kong, S. F., Liu, H. B., et al. Emission inventory of water soluble ions in fine particles from residential coal burning in China and implication for emission reduction. [J]. China Environmental Science, 2017, 37(10): 3708–3721. DOI: 10.13227/j.hjkx.201707063.
[59] Zheng, Q. M., Zeng, Y., Deng, J. S., et al. “Ghost cities” identification using multi-source remote sensing datasets: a case study in Yangtze River Delta [J]. Applied Geography, 2017, 80: 112–121. DOI: 10.1016/j.apgeog.2017.02.004.
[60] Geographical Society of China. Global change research data publishing & sharing rankings [J]. Journal of Global Change Data & Discovery, 2018, 2(3): 243–248. DOI: 10.3974/geodp.2018.03.01.
[61] Liu, C., Liao, X. H., Zhang, G. Y., et al. Analysis to the highest impact dataset 2018 from the Geographical Society of China [J]. Journal of Global Change Data & Discovery, 2018, 2(3): 249–255. DOI: 10.3974/geodp.2018.03.02.
[62] Hao, Y. F., Xie, S. D. Optimal redistribution of an urban air quality monitoring network using atmospheric dispersion model and genetic algorithm [J]. Atmosphere Environment, 2018, 177: 222–223. DOI: 10.1016/j.atmosenv.2018.01.011.
[63] Li, S. C., Zhang, Y. L., Wang, Z. F., et al. Mapping human influence intensity in the Tibetan Plateau for conservation of ecological service functions [J]. Ecosystem Services, 2018, 30(part B): 276–286. DOI: 10.1016/j.ecoser.2017.10.003.
[64] Fu, T. G., Han, L. P., Gao, H., et al. Pedodiversity and its controlling factors in mountain regions—a case study of Taihang Mountain, China [J]. Geoderma, 2018, 310: 230–237. DOI: 10.1016/j.geoderma. 2017.09.027
[65] Zhang, N., Huang, H. Resilience analysis of countries under disasters based on multisource data [J]. Risk Analysis, 2018, 38(1): 31–42. DOI: 10.1111/risa.12807.
[66] Hu, Z. Z., Zhao, Z. L., Zhang, G. X. Simulation and projection of the spatial pattern of the population in Beijing under the background of non-capital function extraction [J]. Journal of Geo-Information Science, 2018, 20(2): 205–216. DOI: 10.12082/dqxxkx.2018.170368.
[67] Zeng, Q. Q., Shen, C. Z., Zhou, S. L., et al. Application of the LUR model in the prediction of spatial distributions of soil heavy metals [J]. Environmental Science, 2018, 39(1): 371–378. DOI: 10.13227/ j.hjkx.201704024.
[68] Jiang, D., Wang, Q., Ding, F. Y. Research on the geo-environment in the era of big data [J]. Science and Technology Review, 2018, 36(3): 41–48. DOI: 10.3981/j.issn.1000-7857.2018.03.005.
[69] Liu, L. L., Jiang, T., Xu, H. M., et al. Potential threats from variations of hydrological parameters to the Yellow River and Pearl River Basins in China over the next 30 years [J]. Water, 2018, 10(7): 883. DOI: 10.3390/w10070883.
[70] Li, J. Y., Huang, X. Impact of land-cover layout on particulate matter 2.5 in urban areas of China [J]. International Journal of Digital Earth, 2018, 461: 1–13. DOI: 10.1080/17538947.2018.1530310.
[71] He, Q. Q., Huang, B. Satellite-based mapping of daily high-resolution ground PM2.5 in China via space-time regression modeling [J]. Remote Sensing of Environment, 2018, 206: 72–83. DOI: 10.1016/j.rse.2017.12.018.
[72] Luo, L. H., Ma, W., Zhuang, Y. L., et al. The impacts of climate change and human activities on alpine vegetation and permafrost in the Qinghai-Tibet Engineering Corridor [J]. Ecological Indicators, 2018, 93: 24–35. DOI: 10.1016/j.ecolind.2018.04.067.
[73] Wu, J. D., Li, Y., Li, N., et al. Development of an asset value map for disaster risk assessment in China by spatial disaggregation using ancillary remote sensing data [J]. Risk Analysis, 2018, 38(1): 17–30. DOI: 10.1111/risa.12806.
[74] Xu, Y., Ji, X. H. Study of car-sharing diffusion criticality conditions based on human traveling network [J]. International Journal of Modern Physics C, 2018, 29(5): 1840009. DOI: 10.1142/S0129183118400090.
[75] Zhu, S. Y., Li, X. Y., Chao, Y., et al. Spatiotemporal variations in satellite-based formaldehyde (HCHO) in the Beijing-Tianjin-Hebei region in China from 2005 to 2015 [J]. Atmosphere, 2018, 9(1): 5. DOI: 10.3390/atmos9010005.
[76] He, Q. Q., Huang, B. Satellite-based high-resolution PM2.5 estimation over the Beijing-Tianjin-Hebei region of China using an improved geographically and temporally weighted regression model [J]. Environmental Pollution, 2018, 236: 1027–1037. DOI: 10.1016/j.envpol.2018.01.053.
[77] Song, J. H., Huang, B., L, R. R. Assessing local resilience to typhoon disasters: a case study in Nansha, Guangzhou [J]. PLoS ONE, 2018, 13(3): e190701. DOI: 10.1371/journal.pone.0190701.
[78] Luo, Y. X., Zhou, Q. W., Xiao, Y. Q. Spatial distribution and change of population in Guizhou based on stratigraphic and topographic conditions [J]. Guizhou Science, 2018, 36(4): 50–55.
[79] Gu, T. F., Wong, T. W., Law, S. C. K., et al. Impacts of sectorial emissions in China and the implications: air quality, public health, crop production, and economic costs [J]. Environmental Research Letters, 2018, 13(8): 1–13. DOI: 10.1088/1748-9326/aad138.
[80] Song, Y. Z., Long, Y., Wu, P., et al. Are all cities with similar urban form or not? Redefining cities with ubiquitous points of interest and evaluating them with indicators at city and block levels in China [J]. International Journal of Geographical Information Science, 2018, 32(12): 2447–2476. DOI: 10.1080/13658816.2018.1511793.
[81] Wang, L., Xu, X. L., Liu, L. Remotely sensed dataset of grassland degradation on the Qinghai-Tibetan Plateau [J]. Acta Geographica Sinica, 2014, 69(Sup.): 159–163. DOI: 10.11821/dlxb2014S011.
[82] Zhang, Y. L., Li, B. Y., Zheng, D. Datasets of the boundary and area of the Tibetan Plateau [J]. Acta Geographica Sinica, 2014, 69(Sup.): 164–168. DOI: 10.11821/dlxb2014S012.
[83] Yu, B. H., Lv, C. H., Lv, T. T., et al. Dataset of regional vegetation changes from 1981 to 2006 in the Qinghai-Tibet Plateau [J]. Acta Geographica Sinica, 2014, 69(Sup.): 169–172. DOI: 10.11821/ dlxb2014S013.
[84] Liu, C., Shi, R. X., Chen, W. B. Eco-regional boundary data of the Roof of the World [J]. Acta Geographica Sinica, 2014, 69(Sup.): 104–112. DOI: 10.11821/dlxb2014S001.
[85] Wang, K., Zhang, T. J., Zhong, X. Y. Changes in the timing and duration of the near-surface soil freeze/thaw status from 1956 to 2006 across China [J]. The Cryosphere, 2015, 9: 1321–1331. DOI: 10.5194/tc-9-1321-2015.
[86] Zhao, Z. L., Zhang, Y. L., Liu, L. S, et al. Recent changes in wetlands on the Tibetan Plateau: a review [J]. Journal of Geographical Sciences, 2015, 25(7): 879–896. DOI: 10.1007/s11442-015-1208-5.
[87] Zhang, Y. L., Wu, X., Qi, W., et al. Characteristics and protection effectiveness of nature reserves on the Tibetan Plateau, China [J]. Resources Science, 2015, 37(7): 1455–1464.
[88] Pekel, J. F., Cottam, A., Gorelick, N., et al. High-resolution mapping of global surface water and its long-term changes [J]. Nature, 540: 418–422. DOI: 10.1038/nature20584.
[89] Wei, X. W., Miu, L. J., Jiang, Y., et al. Reconstruction of the historical crop land data in China using the partition and layering-based gridded method [J]. Acta Geographica Sinica, 2016, 71(7): 1144–1156. DOI: 10.11821/dlxb201607005
[90] Zhang, C., Tang, Q. H., Chen, D. L., et al. Tracing changes in atmospheric moisture supply to the drying Southwest China [J]. Atmospheric Chemistry and Physics, 2017, 17: 10383–10393. DOI: 10.5194/ acp-17-10383-2017.
[91] Zhao, Z. L., Liu, F. G., Zhang, Y. L., et al. The dynamic response of lakes in the Tuohepingco Basin of the Tibetan Plateau to climate change [J]. Environmental Earth Sciences, 2017, 76: 137. DOI: 10.1007/ s12665-017-6446-7.
[92] Ye, Q. H., Zong, J. B. A., Tian, L. D., et al. Glacier changes on the Tibetan Plateau derived from Landsat imagery: mid-1970s-2000-13 [J]. Journal of Glaciology, 2017, 63(238): 273–287. DOI: 10.1017/ jog.2016.137.
[93] Li, L. H., Liu, Q. H., Zhang, Y. L., et al. Spatial distribution and variation of precipitation in the Qiangtang Plateau [J]. Geographical Research, 2017, 36(11): 2047–2060. DOI: 10.11821/dlyj201711002.
[94] Liu, C., Shi, R. X. GIS Dataset of boundaries among four geo-eco regions of China [J]. Journal of Global Change Data & Discovery, 2018, 2(1): 42–50. DOI: 10.3974/geodp.2018.01.08.
[95] Li, L. H., Zhang, Y. L., Liu, L. S., et al. Spatiotemporal patterns of vegetation greenness change and associated climatic and anthropogenic drivers on the Tibetan Plateau during 2000–2015 [J]. Remote Sensing, 2018, 10(10): 1525. DOI: 10.3390/rs10101525.
[96] Fan, Z. M., Huang, Y., Yue, T. X. Scenarios simulation of vascular plant species abundance distribution on Qinghai-Tibet Plateau [J]. Acta Geographica Sinica, 2018, 73(1): 164–76. DOI: 10.11821/ dlxb201801014.
[97] Chen, S. C., Arrouays, D. Soil carbon stocks are underestimated in mountainous regions [J]. Geoderma, 2018, 320: 146–148. DOI: 10.1016/j.geoderma.2018.01.029.
[98] Han, Z., Song, W., Deng, X. Z., et al. Grassland ecosystem responses to climate change and human activities within the Three-River Headwaters region of China [J]. Scientific Reports, 2018, 8: 9079. DOI: 10.1038/s41598-018-27150-5.
[99] Li, L. H., Zhang, Y. L., Liu, L. S., et al. Current challenges in distinguishing climatic and anthropogenic contributions to alpine grassland variation on the Tibetan Plateau [J]. Ecology and Evolution, 2018, 8(11): 5949–5963. DOI: 10.1002/ece3.4099.
[100] Zhao, Z. H., Liu, G. H., Xu, Z. R. The ecosystem carbon storage dataset in Tibet (2001–2010) [J]. Journal of Global Change Data & Discovery, 2018, 2(1): 67–71. DOI: 10.3974/geodp.2018.01.11.