Journal of Global Change Data & Discovery2017.1(4):383-390

[PDF] [DATASET]

Citation:Shi,R.X.,Liu,C.,Ma,J.H.et al.Statistics and Analysis of Global Change Research Data Publishing & Sharing (2014-2017)[J]. Journal of Global Change Data & Discovery,2017.1(4):383-390 .DOI: 10.3974/geodp.2017.04.01 .

Statistics and Analysis of Global Change Research Data Publishing & Sharing (2014-2017)

Shi, R. X.*  Liu, C.  Ma, J. H.  Wang, Z. X.

Institute of Geographic Sciences and Natural Resources Research, Chinese Academy of Sciences, Beijing 100101, China


Abstract: As the first case in global change research data publishing and repository in World Data System (WDS) of International Council of Sciences (ICSU) and China GEO, 343 datasets in 17 issues were published in GCdataPR (Global Change Research Data Publishing & Repository) during 2014-2017. In which, 11 datasets were global scale, 23 datasets are trans-continental, 248 dataset (72.30%of total) cover Asia area. There were 567 authors from 11 countries; most of them (94.89%) came from China, mainly from the Chinese Academy of Sciences, and universities from the Ministry of Education of P. R. China. The online data size is 1,028.13 GB (209.10 GB compressed). More than 880,800 visitors and 36,800 computer IP users from 76 countries over the world downloaded 125,900 data files openly and freely with the data size of 2,675.70 GB during 2014-2017. China was the largest user group (32,749, 89%), followed by the United States, Australia, Japan, and Malaysia. The GCdataPR was on the top 50 of Big Data Products, Services and Solutions of China (the only one from scientific research and education) in 2016 and searchable list of Data Citation Index of Clarivate Analytics since 2016.

Keywords: global change; research data; data publishing; 2014-2017

1 Introduction

Since the National Global Change Research Program[13] launched, the global change research datasets have been continuously produced. In order to promote the data publishing and openly available to be re-used, the Institute of Geographic Sciences and Natural Resources Research (IGSNRR), Chinese Academy of Sciences (CAS) and the Geographical Society of China (GSC) officially launched the Global Change Scientific Research Data Publishing & Repository (GCdataPR) in June 2014. There were 343 datasets in 17 issues published from 2014 to 2017.

According to the Guidelines of Global Change Scientific Research Data Publishing & Repository[4], the annual report is conducted in two ways. The first is data publishing and sharing rankings, which is released in mid-year and the second is a comprehensive summary, which is released by end of each year. The GCdataPR 2017 Rankings was released in June 2017[56] and this article is the summary of the annual datasets repository report 2017, which covers from June 1, 2014 to December 20, 2017.

2 Statistics and Analysis on Dataset Published

2.1 Datasets Published

In total, 343 datasets were published in 17 issues from 2014-2017. Of these, 36 datasets published in 2 issues in 2014 and 34 datasets in 2 issues in 2015 separately, 190 datasets in 9 issues were published in 2016. While, in 2017, in conjunction with the Journal of Global Change Data and Discovery, 83 datasets in 4 issues were published (Table 1). There are 394,026 data files in total among the 343 datasets, which were compressed into 1,226 data file packages. The compressed data file packaging rate is 321.39. The total data size is 1,028.13 GB, 209.10 GB compressed; the data compressing rate is 4.92.

Table 1  Statistics of datasets published and archived (2014‒2017)

Year/Month

No.

Num.

Data file

Compressed data package

Data size (GB)

Compressed data size (GB)

2014.06

1

20

17,843

 57

 4.58

 3.95

2014.12

2

16

15,961

 99

71.54

18.90

Subtotal

2

36

33,804

156

76.12

22.85

2015.04-06

1

18

49,771

166

103.19

35.00

2015.07-12

2

16

 4,964

130

 35.78

20.80

Subtotal

2

34

54,735

296

138.97

55.80

2016.01-03

1

18

 2,090

 35

  3.71

 1.36

2016.04-05

2

20

  409

 26

  0.86

 0.26

2016.06

3

21

  871

 83

 48.78

 9.95

2016.07

4

21

  406

 42

 19.94

 1.00

2016.08

5

21

  470

 74

  8.80

 7.24

2016.09

6

25

1,499

 46

  0.11

 0.01

2016.10

7

25

 595

 51

  0.65

 0.24

2016.11

8

21

 251

 35

  1.11

 0.33

2016.12

9

18

 402

 35

  0.34

 0.16

Subtotal

9

190

6,993

427

84.30

20.55

2017.01-02

1

21

 355

 93

 25.67

14.80

2017.03-06

2

20

1,100

 63

 39.37

 5.08

2017.07-10

3

20

7,662

 32

  4.98

 0.32

2017.11-12

4

22

289,377

 159

658.72

 89.70

Subtotal

4

83

298,494

347

728.74

109.90

Total

17

343

394,026

1,226

1,028.13

209.10

2.2 Geographical Regions Covered by the Datasets

There are 11 datasets are in the global scale among the 343 datasets, which is 3.21% of the total; 23 datasets covering the cross-continental region, which is 6.71 % of the total. Most datasets cover Asia area (248 datasets), which is 72.30% of the total. Of these, 148 datasets cover China, accounting for 59.68% of the Asian and 43.15% of the total. There are 21 data sets covering Europe, 6.12 % of the total. There are few datasets cover Oceania, Africa and Latin America, 3 for Oceania and Africa and 4 for Latin America, respectively. 16 datasets cover North America, accounting for 4.66 % of total. And there are 11 datasets covering the Polar Regions, accounting for 3.21% of the total. In addition, there are 3 datasets dealing with data the new technologies (software and video, Table 2)

Table 2  Statistics of geographical regions covered by datasets published

Covering area

Dataset

%

Global

 11

3.21

Cross-continental (including B&R)

 23

6.71

Asia

248

72.30

Europe

 21

6.12

North America

 16

4.66

Latin America

  4

1.17

Oceania

  3

0.87

Africa

  3

0.87

Polar regions

  11

3.21

Technology

  3

0.87

Total

343

100

Table 3  Statistics of discipline of dataset published

Domain

Dataset

%

Terrestrial

Water

 40

 11.66

Land

 24

  7.00

Ecology/Biology

 79

 23.03

Atmosphere

 40

 11.66

Geological/Mineral

  7

 2.04

Environment

  7

 2.04

Disaster

  5

 1.46

Humanity

 26

 7.58

Oceanic

Ocean/Coastal zone/Islands

108

31.49

Others

Culture/Art

  4

 1.17

Technology

  3

 0.87

Total

343

100

Table 4  Summary of dataset in production level

Dataset

Production Level

%

250

2

72.89

 84

3

24.49

  9

4

 2.62

2.3 Datasets Published by Disciplines

The datasets published covered a wide range of spectrum in the global change sciences (Table 3). There were 228 datasets about land (66.47 %); 108 datasets about ocean (including polar regions, coastal area, and islands; 31.49%); 4 datasets about earth-science-related arts (1.17 %); 3 datasets about technology (0.87 %). Among the land datasets (228), there were 40 datasets about water in land (river, lake, and wetland) and 24 datasets about land cover and land use. The largest section of land datasets was from terrestrial ecosystems, totaling 79 datasets.

2.4  Data Levels

All datasets were identified into 0-5 levels, according to their stages in the development procedures. Specifically

Level 0 (L0)Raw data or signal from sensor or observer;

Level 1 (L1)Output of L0 after geometric and radiometric correction;

Level 2 (L2)Output of L1 integrated with new intelligence;

Level 3 (L3)Output of L1/L2 integrated with new intelligence;

Level 4 (L4)Output of L1/L2/L3 integrated with new intelligence;

Level 5 (L5)Output of L1/L2/L3/L4 data integrated with new intelligence; usually a time-serial, or global scale.

Based on above criteria, 343 datasets were categorized into 3 production levels (Table 4): 72.89% of the datasets were in level 2; 24.49% of them were in level 3, and only 2.62% of the datasets were in level 4.

Table 5  Statistics of country of the author and dataset

Country

Dataset

Country

Dataset

China

337

Netherlands

1

Japan

 13

Czech Republic

1

United States

  5

Thailand

  2

Total

364

Russia

  1

Dataset published

343

Chile

  1

Dataset published by

overseas authors alone

6

Pakistan

  1

Proportion

1.75%

Kenya

  1

Dataset published by

transnational team

16

Madagascar

  1

Proportion

4.66%


Table 6  Statistics of author group and their dataset

Number of Authors

Dataset

%

1

25

7.29

2-5

257

74.93

6-10

56

16.33

>10

5

1.46

Table 7  Statistics of affiliation of dataset author

Organization

Dataset

Organization

Dataset

Chinese Academy
of Sciences

240

China Earthquake
Administration

2

Ministry of Education

128

Ministry of Agriculture

2

National Geomatics
 Center of China

  9

Province

2

State Oceanic
Administration

  8

Ministry of Water
Resources

1

China Meteorological Administration

  8

National Development
 and Reform Commission

1

Company

  8

Total

422

State Forestry
Administration

  7

Data published

343

Ministry of Land
and Resources

  4

Dataset developed by
 trans-ministry

79

Ministry of Housing
and Urban-Rural
Development

  2

Proportion

23.03%

3 Dataset Author(s)

3.1 Dataset Author

The 343 datasets were developed by 567 authors from 11 countries, including China, Japan, Kenya, Thailand, etc.

Most datasets were contributed by Chinese scholars (94.89%). Only Six datasets (1.75%) were published by non-Chinese authors alone16 datasets (4.66%) were results of the international cooperation (Table 5).

3.2 Dataset Author Groups

Among the 343 dataset and 567 authorsonly 7.29% of the datasets were developed by a single author, 74.93% of the datasets were developed by a group consisted of 2-5 persons, and 16.33% by a group consisted of 6-10 persons. There were 5 datasets from the groups of over 10 persons, and the largest group was composed of 33 members (Table 6).

3.3 Statistics of Chinese Authors by Affiliation and Region

3.3.1 Datasets Authors by Affiliation (Institutes or Universities)

Table 7 presented the affiliations of datasets authors. Most of the authors are from Chinese Academy of Sciences and universities belong to the Ministry of Education of P. R. China (Table 7).

3.3.2 Chinese Authors by RegionsProvince, Municipality, Autonomous Region

The current distribution of dataset authors was quite uneven: authors from Beijing published 256 datasets, obviously the lion’s share of the total publication; the following 5 provinces, Shanghai, Sichuan, Henan, Gansu, Jiangsu contributed 10-20 datasets, respectively; there were no datasets from six regions, such as Ningxia, Qinghai, Guizhou, Hong Kong, Macao, and Taiwan (Table 8).

Table 8   Statistics of Chinese authors by region

Region

Dataset

Region r

Dataset

Region

Dataset

Region

Dataset

Beijing

256

Shaanxi

8

Hubei

3

Hainan

1

Shanghai

 16

Guangdong

7

Jiangxi

3

Anhui

1

Sichuan

 15

Shandong

6

Fujian

3

Tianjin

1

Henan

 13

Xinjiang

5

Hunan

3

Tibet

1

Gansu

 12

Shanxi

5

Yunnan

2

Chongqing

1

Jiangsu

 12

Hebei

5

Total

402

Jilin

  8

Inner Mongolia

4

Dataset published

343

Liaoning

  4

Heilongjiang

2

Dataset developed by trans-provinces

59

Zhejiang

  3

Guangxi

2

Proportion

17.20

Table 9  Statistics of foundation of the dataset

Foundation

Dataset

%

No fund

 53

15.45

One fund

162

47.23

More than one fund

128

37.32

Total

343

100

3.4 Statistics of Datasets by Founding Agencies

With or without foundations (Table 9): Of all the published datasets, 84.55% of them were founded, 15.45% of them were conducted by self support. Among the with-founding group, 47.23% of the datasets were funded by a single funding project; 37.32% of the datasets were funded by two or more funding projects, those datasets were usually large, broad-covered, time-serial datasets.

Foundation details (Table 10): Of all 343 datasets from 532 projects (programs) , 139 projects (26.13%) were from Ministry of Science and Technology of P. R. China; 123 projects (23.12%) were from Chinese Academy of Sciences and 118 projects (22.18%) were from Natural Science Foundation of China.

Table 10  Statistics of funds supporting datasets development

Foundations

Number of Funds

%

Foundations

Number of Funds

%

Ministry of Science and

Technology

139

26.13

National Development and Reform Commission

2

0.38

Chinese Academy of Sciences

123

23.12

Ministry of Environmental Protection

2

0.38

National Natural Science

 Foundation of China

118

22.18

State Forestry Administration

2

0.38

Province/Company

 91

17.11

National Space Administration

2

0.38

Ministry of Education

 19

 3.57

China Earthquake Administration

2

0.38

State Oceanic Administration

 10

 1.88

Ministry of Water Resources

1

0.19

National Social Science Fund

  6

 1.13

Ministry of Personnel

1

0.19

Ministry of Land and Resources

  3

 0.56

China National Tourism Administration

1

0.19

China Meteorological

Administration

  2

 0.38

Abroad

  8

 1.50

Total

532

100

4  Association of Datasets, Research Papers, and Data Papers

In order to promote the informed research data re-use, products in three dimensions have been considered: research datasets, research data paper and original research paper[7]. GCdataPR was the first case in World Data System (WDS) of International Council of Sciences (ICSU) and China GEO[8].

The publication of research data through the platform of Global Change Research Data Publishing and Repository (GCdataPR, http://www.geodoi.ac.cn) gives authors a new choice to protect their data and enjoy relevant credit. By the end of 2017, 37 academic journals have participated GCdataPR partner team, they can enhance their visibility through recommendation of research data from the papers published in their journals. GCdataPR was on the top 50 of Big Data Products, Services and Solutions of China (the only one from scientific research and education) in 2016[9] and searchable list of Data Citation Index of Clarivate Analytics since 2016.

Development of research data can be very complex and may not be fully instructed in original research papers. Therefore, it is necessary to provide more information to new users in order to apply the data in new research fields. This is so called data paper, published through Journal of Global Change Data and Discovery.

To give potential data users more insight about research data, the online hot link for each dataset to original research paper is provided at the GCdataPR platform. This means that data can be re-used on a transparent background, and credits and responsibilities of each part can be clarified in the very beginning.

It is worth noting that the above three steps have not been taken shoulder by shoulder. GCdataPR was launched in 2014, part of its data papers were published in Journal of Geography. This lag of data paper publication remained until March, 2017, when the new journal delivered its first issue. With the completion of trinity, more data papers will be published through the new journal. Table 11 gives a brief for this trend.

5 Statistics of Data Sharing

Table 11  Statistics of datasets with its informaiton

Year

Dataset

Data Paper

Res. Paper

Total Paper

2014

36

20

1

21

2015

34

0

0

0

2016

190

0

95

95

2017

83

73

23

96

Total

343

93

119

212

5.1 Datasets

Table 12 presented the major static items of data sharing during 2014-2017. More than 880,000 users visited the system, accumulatively. Through over 30,000 IPs, users have downloaded more than 2TB datasets in 120,000 times. The data users (IP) and the data file downloaded increased year by year (Figure 1, Figure 2).

Table 12  Statistics of data sharing through the GCdataPR

Year

Visitors

Accum.

Visitors

Added Data

Users (IP)

Accum. Data Users(IP)

Data Files

Downloaded

Accum. Data

File downloaded

Data Downloaded (GB)

Accum. Data Downloaded(GB)

2014

332,846

332,846

  174

  174

  822

  822

 25.79

  25.79

2015

124,668

457,514

9,764

9,938

23,726

24,548

976.11

1,001.90

2016

339,870

797,384

10,701

20,639

47,867

72,415

703.31

1,705.21

2017

 83,434

880,818

16,158

36,797

53,493

125,908

970.49

2,675.70

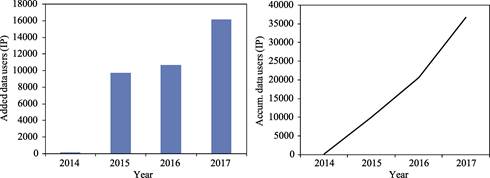
Figure 1  Statistics of annual added and cumulative data users of GCdataPR (2014–2017)

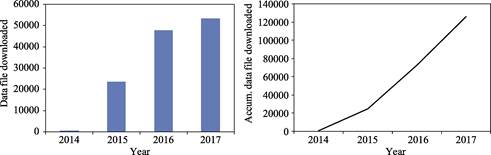
Figure 2  Yearly and cumulative data file downloaded from GCdataPR (2014-2017)

5.2 Data Users by Countries

Data users from 76 countries all over the world have downloaded the datasets. Most of the users were from China (32,749, 89%), followed by the United States, Australia, Japan, and Malaysia (Figure 3).

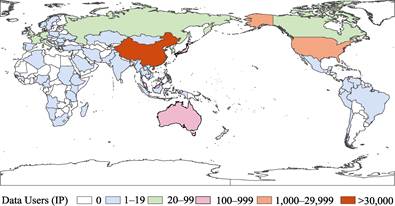
Figure 3  Map of the GcdataPR data users (IP)

6 Discussion

Global change research data is comprehensive and inter-disciplinary, just like Global change research. There is no doubt that the datasets and the data paper publishing together with the citation of the original research paper, could provide the scientific community with a new possibility to facilitate data quality assurance and informed research data re-use.

However, at its preliminary and exploratory stage, several key issues should be tackled further in a wide range of fields, such as data publishing, archiving, disseminating, sharing, application, citation, measurement of impact, etc. The most marked issues are: scientific community as a whole has not given enough credit to research data published; lack of enforcement of intellectual property protection for research data; inconsistency of data citation, the data content may need cover more regions and the data authors may expand to more communities.

Although the IGSNRR/CAS, SGC try hard to enhance the capacity building and communication in research communities and universities under the support of Chinese Academy of Sciences, the awareness of research data publishing should be more involved, especially from founding agencies; research institutes, universities. The due credit should be given to the each of stakeholders related to the published datasets.

There are still many confusing issues about data intellectual property protection among the scientific communities and the society. For instance, what makes up an innovative dataset and what should be protected by law? How to balance the protection and sharing? It is valuable to have such course as a basic education in universities about the data intellectual property.

Unlike paper citation, there are no common understanding the guidelines and standards for data citation. Usually, the data used in a paper may be specifically cited in terms of “acknowledge”, or in “data and method”, or just overlooked. In short, there was no such a tradition as paper citation before. That was history. In our new system, the data users are requested to formally cite both dataset according to the dataset citation format and the data paper according to the data paper citation format.

References

[1]    Future Earth (2013). Future earth initial design: report of the transition team [R]. Paris: International Council for Science (ICSU).

[2]    Experts Group of National Major Research Program on Global Change Research. Global change strategy research report of China [R]. 2009.

[3]    USGCRP. The national global change research plan 2012–2021: a strategic plan for the U.S. global change research program [R]. 2012.

[4]    Editorial office of Journal of Global Change Data & Discovery. Guidelines of global change research data publishing and repository [J]. Journal of Global Change Data & Discovery, 2017, 1(3): 253-261. DOI: 10.3974/geodb.2017.03.01.

[5]    Geographical Society of China. Global change research data publishing & sharing rankings (Top 10) [J]. Journal of Global Change Data & Discovery, 2017, 1(2): 249-251. DOI: 10.3974/geodp.2017.02.23.

[6]    Jiang, D., Song, X. F., Zhang, G. Y. A new milestone of scientific data sharing in China [R]. Journal of Global Change Data and Discovery, 2017, 1(2): 246-248. DOI: 10.3974/geodp.2017.02.22.

[7]    Liu, C. Global change research data publishing and repository [J]. Acta Geographica Sinica, 2014, 69(Sup): 3-11.

[8]    Liu, C., Guo, H. D., Uhlir, P. F., et al. GCdataPR: infrastructure for data publishing repository & sharing in/for/with developing countries [J]. Journal of Global Change Data & Discovery, 2017, 1(1): 3-11. DOI: 10.3974/geodp.2017.01.02.

[9]    Shi, R. X., Zhu, Y. Q., Jiang, D., et al. GCdataPR: an outstanding case in “Excellent Products, Services and Applications of Big Data in China” [R]. Journal of Global Change Data & Discovery, 2017, 1(2): 245. DOI: 10.3974/geodp.2017.02.21.

Co-Sponsors
Superintend