Dataset of OLR Abnormal
Signals in Nepal
(2009?C2018)
Lin, L.1* Kong, X. Z.2 Li, N.2 Jiang, X. Y.1
1. College of Mathematics and
Informatics, Fujian Normal University, Fuzhou 350117, China;
2. College of Computer and Information
Sciences, Fujian Agriculture and Forestry University, Fuzhou 350007,
China
Abstract: Studies
have shown that changes in surface temperature before a large earthquake can
cause abnormal outgoing longwave radiation (OLR), but there is currently no
effective technique for extracting these anomalies. We propose a data mining
algorithm called Abnormality Detection based on Randomized transducers and
power Martingales (ADRM), which uses stochastic sensors and martingale theory
to mine anomalies effectively through experimental comparison. OLR data from
the source NOAA satellite and the corresponding data sequence after anomalous
data mining are taken from the Nepal region for the period of 2009?C2018.
Spatially, the dataset covers 25 grid cells (five rows and five columns)
centered on the epicenter of the Nepal earthquake (28.23??N, 84.73??E). Each grid
cell covers 2.5??´2.5??, and the epicenter is located in the
central cell. In terms of time, each year is defined as 366 days from September
28 of one year to September 28 of the next year. The dataset includes abnormal
OLR signals recorded in Nepal from 2009 to 2018. The dataset is archived in
.xls format, consisting of a single file with a data size of 3.92 MB. A
research paper based on this dataset, titled ??Pre-earthquake anomaly data
mining of remote sensing OLR in Nepal earthquake,?? was published in the Journal of Geo-information Science (Vol.
20, No. 8, 2018), and a paper titled ??Relationship of stress Changes and
Anomalies in OLR Data of the Wenchuan and Lushan earthquakes?? was published in
the IEEE Journal of Selected Topics in
Applied Earth Observations and Remote Sensing (Vol. 11, No. 8, 2018).
Keywords:
OLR; Nepal
earthquake; data mining; abnormal information; Journal of Geo-information Science; IEEE
Journal of Selected Topics in Applied Earth Observations and Remote Sensing
1 Introduction
Earthquakes are often accompanied by
an increase in geothermal radiation, and data related to the temperature
increase of landmarks in the seismogenic area before the earthquake can be
monitored by thermal infrared remote sensing satellites[1]. Outgoing
longwave radiation (OLR) refers to the energy density of electromagnetic waves
emitted by the earth?Cgas system to outer space. Such large-scale changes in
surface temperature cause fluctuations in OLR that can be remotely sensed by
thermal infrared sensors placed in satellites[2]. After the US
polar-orbiting National Oceanic and Atmospheric Administration (NOAA) satellite
synchronized with the solar orbit to capture OLR data, the telemetry data were
spatially averaged multiple times, resulting in global daily and monthly
average OLR data with a 2.5?? ?? 2.5?? pitch on the longitude-latitude grid. Human
activities, climate change, the greenhouse effect, and the effects of surface
temperature, atmospheric temperature, water vapor, and cloud cover destabilize
the temperature, meaning that OLR data are noisy, unstructured, and robust. The raw OLR data are required for the
anomalous signals and pre-earthquake signs hidden in the data to be
extracted through statistical principles and data mining techniques. Many
scholars have proposed methods for extracting such data, such as wavelet
transforms, Bayesian estimation, fuzzy neural algorithms, and anomaly mining
based on errors and key points of earthquake precursor observation data.
However, most of these techniques are ineffective in terms of extracting
earthquake-related abnormalities and trends, and the bulk of remote sensing
data are not fully utilized[3?C9]. We propose an outlier signal
analysis algorithm called Abnormality Detection based on Random Process and Power
Martingales (ADRM). This technique uses random sensors and power martingales to
mine outlier data from the OLR source data, effectively obtaining the changes
in outlier signals and forming a new data sequence after outlier capture. This
dataset mainly includes OLR data for the period of 2009?C2018. The regional
range is a rectangular area centered on the epicenter of the 7.8-magnitude
earthquake (28.23??N, 84.73??E) that struck Nepal on April 25, 2015. The longitude
and latitude coordinates are the dataset formed by applying ADRM to extract
abnormal signals from the regional 10-year OLR data centered on 28.23??N,
84.73??E.
2 Metadata of the
Dataset
The metadata of the dataset is summarized in Table 1.
Among other information, it includes the full and short names of the dataset,
the authors, year, temporal resolution, spatial resolution, data format, data
size, data files, data publisher, and data sharing policy, etc.
3 Methods
3.1
Algorithmic Principles
For the OLR data source, we performed
three processing steps: regional grid division, data preprocessing, and data
analysis of the ADRM algorithm for abnormal signal capture.
The first step concerns the division of regional grids[13].
According to the characteristics of OLR data, the data are recorded in grid
cells covering latitude and longitude of 2.5???? 2.5??, and
the global area is divided into grid cells based on this unit. For example, the
epicenter of the Nepal earthquake (28.23??N, 84.73??E) has relative coordinate
values of (25, 34). The 25 grid cells centered on this coordinate value are the
OLR data research objects. Corresponding to the column name of the dataset, the
relative coordinates of grid cell 1 in the upper left corner are (23, 32), and
the corresponding dataset column name is Grid No. 1 (23, 32).
The second step involves the
preprocessing of the source data. The source data (OLR_raw column) uses the
??Afternoon Satellite (1430?C0230 LST)?? data of the OLR data sequence captured by
the NOAA-14 satellite. Using the afternoon dataset is believed to reduce the
disturbance from human activity, noise, and climate that can be encountered in
the daytime.
The preprocessing of the source data is as follows:
(1) Fill in missing data. If data are missing for 1?C2
days, data from the previous day are used to fill the missing values.
Otherwise, the annual average is used as the missing value.
(2) The year of data is unified, that is, the first 28
days in February are unified.
(3) Removal of noise. When the data are less than some
threshold value or are suspected of being unreasonable, the annual average is
used in place of the noisy data.
Table 1 Metadata summary of ??Dataset of OLR
abnormal signals in Nepal (2009-2018)??
|
Items
|
Description
|
|
Dataset full name
|
Dataset of OLR abnormal signals in
Nepal (2009-2018)
|
|
Dataset short name
|
OLRAbnormalSignalNepal_2009-2018
|
|
Authors
|
Lin, L. AAB-6198-2019, College of Mathematics and Informatics, Fujian Normal University, linling@fjnu.edu.cn
Kong, X. Z. AAI-1869-2019, College of Mathematics and Informatics, Fujian Normal University, xzkong_fjnu@163.com
Li, L. AAB-3416-2020, College of Computer and Information Sciences, Fujian Agriculture and
Forestry University, 13509338919@qq.com
|
|
|
Jiang, X. Y. AAI-1865-2019, College of Mathematics and Informatics, Fujian Normal University, 13509338919@qq.com
|
|
Geographical region
|
Nepal region
Year 2009?C2018
Temporal resolution day
|
|
Spatial resolution
|
2.5º??2.5º
Data format .xls
Data size 3.92 MB
|
|
Data files
|
The dataset includes 10 years of data and 25 grid
overlays centered on the epicenter of the Mw7.8 earthquake in Nepal on April
25, 2015. The relative grid coordinates are (23, 32) to (27, 36), which are
the source and result in data of abnormal signal analysis of OLR data during
the 10 years from 2009 to 2018. They mainly include: 10 sheets representing
10 years data, each composed of 25 grids of data, and the data of each grid
are divided into source data (OLR_raw), preprocessed data (OLR_prep), and
result data (CD-value) after extraction of abnormal information
|
|
Foundations
|
Fujian
Province (2019Y0008); National Natural Science Foundation of China (61772004,
41601477)
|
|
Data publisher
|
Global Change
Research Data Publishing & Repository, http://www.geodoi.ac.cn
|
|
Address
|
No. 11A, Datun Road, Chaoyang
District, Beijing 100101, China
|
|
Data sharing policy
|
Data from the
Global Change Research Data Publishing & Repository includes metadata, datasets
(data products), and publications (in this case, in the Journal of Global Change
Data & Discovery). Data sharing policy include: (1) Data are openly available and can
be freely downloaded via the Internet; (2) End users are encouraged to use Data
subject to citation; (3) Users, who are by definition also value-added
service providers, are welcome to redistribute Data subject to written
permission from the GCdataPR Editorial Office and the issuance of a Data redistribution license; and (4) If Data are used to
compile new datasets, the 'ten percent principal' should be followed such
that Data records utilized should not surpass 10% of the new
dataset contents, while sources should be noted in suitable places in the new
dataset[11]
|
|
Communication and searchable system
|
DOI, DCI,
CSCD, WDS/ISC, GEOSS, China GEOSS, Crossref
|
After
the above pre-processing, the dataset corresponds to the value of the OLR_prep
column.
Finally, the OLR_prep data are mined for abnormal
signals, that is, the ADRM algorithm based on martingale theory is used to mine
the changing characteristics and trends of the OLR_prep data[12?C14]
to generate a new CD-value Change Detection. The principle of the ADRM algorithm
is as follows:
 is defined as the known historical data, where Dt represents the current OLR value. When the geological
activity is stable, the OLR data should be relatively stable, with some similar
characteristics between the sample data[15].
is defined as the known historical data, where Dt represents the current OLR value. When the geological
activity is stable, the OLR data should be relatively stable, with some similar
characteristics between the sample data[15].
The outlier measure of the
OLR data signal is determined as follows. The offset value Dt is 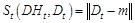 , where m is the clustering
center
, where m is the clustering
center  obtained by a clustering algorithm and
 denotes
the distance measure function. The initial outlier sequence is
denotes
the distance measure function. The initial outlier sequence is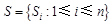 . The confidence map of a random sensor for sequence
  [16] is then given by
 (1)
(1)
This
is mapped to the confidence space of  , where the random value
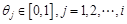 , and
, and is the
number of samples that meet the given condition. It can be seen from equation
(1) that larger values
is the
number of samples that meet the given condition. It can be seen from equation
(1) that larger values  indicate that
  it is more consistent with the distribution of
historical samples, and it is, therefore, less likely that it will be abnormal on that day.
it is more consistent with the distribution of
historical samples, and it is, therefore, less likely that it will be abnormal on that day.
A relatively small value on
one day is not enough to indicate that the overall OLR data are abnormal. Thus,
the randomized values
corresponding to each data point are
analyzed[17] using the following formula:
 (2)
(2)
where , the initial value
  and the
set of the first 50 points is the initial center of the cluster (i.e., the
first 50 CD_value data in the set are the same). To smooth the noise that may
appear in OLR data and reduce any misjudgment of the changing trend, the M value is subjected to a
and the
set of the first 50 points is the initial center of the cluster (i.e., the
first 50 CD_value data in the set are the same). To smooth the noise that may
appear in OLR data and reduce any misjudgment of the changing trend, the M value is subjected to a  average smoothing processing to generate the CD sequence
value:
average smoothing processing to generate the CD sequence
value:
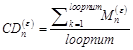 . (3)
. (3)
Due
to the relatively violent crustal movement before and after a major earthquake,
the OLR data may fluctuate within a short period. Although the value of  , which reflects the fluctuation, has been smoothed, it may still
increase to an uncontrollable degree[18]. To prevent this from
happening, we set a stop threshold. When
, which reflects the fluctuation, has been smoothed, it may still
increase to an uncontrollable degree[18]. To prevent this from
happening, we set a stop threshold. When  , the calculation is stopped
and re-initialized at the current position.
, the calculation is stopped
and re-initialized at the current position.
|
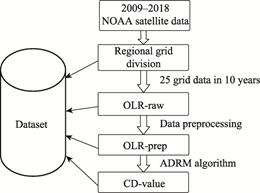
Figure 1 Acquisition
procedure of OLR
data abnormality
|
3.2 Technical
route
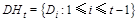
The overall process of generating the
dataset is shown in Figure 1. The NOAA[12] provides OLR remote
sensing data from NOAA satellites. This article considers OLR data from 2009 to
2018. We digitize the regional data grid in the earthquake area, forming 25
grid cells for analysis. The OLR_raw source data are preprocessed by inserting
missing data, normalization, and noise reduction to obtain the OLR_prep
sequence, and then the abnormalities are analyzed using the ADRM algorithm to obtain
the CD-value data sequence.
4
Results and Validation
4.1
Data Composition
The dataset is saved in an Excel file
consisting of 10 sheets, with the sheet name representing the year of the data.
Each sheet is composed of 25 sets of data, and each set of data represents the
OLR source data, OLR preprocessed data and CD-value in the corresponding grid.
The format of the column name ??Grid No.* (**, **)?? represents the grid number
and corresponding coordinates. For example, the coordinates of grid cell 1 are
(23, 32) and the column name in the sheet is ??grid No.1 (23, 32)??.
Table 2 Attribute description of each column in
the dataset
|
Attribute
|
Description
|
Note
|
|
OLR_raw
|
Raw source data
from NOAA
|
NCAR and NOAA.
Available: ftp ftp.cpc.ncep.noaa.gov; cd precip/ noaa18_olr for OLR data
|
|
OLR_prep
|
Pre-processed
data (the following removal
of invalid and
noisy data)
|
|
CD-value
|
Abnormal
information dataset
|
Result of data
analysis using the ADRM algorithm
|
4.2 Results
This dataset
organizes data from both a geographic and temporal perspective. In terms of
time, each year is defined as running from September 28 of one year to
September 28 of the next year, a total of 366 days (after preprocessing). Thus,
a total of 366 rows of data are stored in a sheet. In the region, the Nepal
earthquake epicenter (28.23ºN, 84.73ºE) is used as the center, and the
neighboring areas are gridded to cover 2.5º latitude and 2.5º longitude. The
epicenter grid coordinate is (25, 34). The grid is formed by extending in the
longitude and latitude directions to form a grid square. For example, the
corresponding latitude and longitude range of Grid No.1, which has coordinates
(23, 32), are 31.98??N?C34.48??N, 78.48??E?C80.98??E.
4.3 Data Validation
This dataset contains OLR anomaly data for 25 grid cells covering a period
of 10 years. We use grid cell 13 as an example to illustrate the effectiveness
of the algorithm. Figure 2 shows the data map for one year (from September 28,
2014, to July 25, 2015). Figure 2(a) shows the fluctuation of the OLR raw data
of NOAA satellites. It is difficult to observe the data with the naked eye or
through simple data analysis. Figure 2(b) shows the CD_value waveform of the
abnormal changes calculated by the ADRM algorithm, and the data change trend
chart after effectively extracting the abnormal information. The three vertical
lines in the figure represent the three earthquakes with magnitudes of 5.0,
7.8, and 7.3 that struck in Nepal on December 18, 2014, April 25, 2015, and May
12, 2015, respectively. The source of the seismic information is the network
data provided by the US Geological Survey (USGS)[19].
It
can be seen from Figure 2 that the three earthquakes are consistent with
changes in CD-value in terms of time and the magnitude of the event. The
magnitude of the earthquake on May 12, 2015, was smaller, but the CD-value
displays a sudden increase in the change curve. The value suddenly increased
because of the drastic changes in data on April 25, 2014, making subsequent
data mining changes more ??sensitive.??
The OLR anomalies occurred about a month before the
earthquake. The December 18 earthquake in Figure 2(b) began to produce anomalous
OLR changes on November 20, and the April 25 earthquake gave rise to anomalous
readings as early as February 25. The change in the anomalous CD-values began
to appear soon after, and over time, the CD-value tended to climb, with the
general trend continuously fluctuating and rising, before reaching a peak on
the day of the magnitude-7.9 earthquake, April 25. Although the curve declined
thereafter, it then started to rise until May 12, when Nepal experienced
another large aftershock. As shown in Figure 2(b), CD-value rose sharply, and a
peak appeared the day before the earthquake on May 12 (marked by the third
vertical line in the middle). After that, the CD-value quickly dropped, and
although there were several small aftershocks in Nepal, there were no more
large earthquakes. This shows that studying the CD-value sequence of OLR
anomaly information can provide a reference for earthquake prediction.
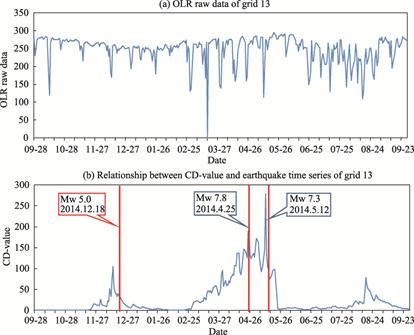
Figure 2 Comparison
of OLR source data and CD-value (Sep. 28, 2014?CSep. 28, 2015)
By comparing the 10-year mean of the CD-value with the
2015 CD chart, the pre-seismic anomalies can also be analyzed. In Figure 3, the
red triangles represent three earthquakes, and the yellow curve shows the
CD-value in 2015. The blue curve represents the average CD-value in grid cell
13 over the 10years from 2009 to 2018 covered by the dataset. Through
comparisons with the mean value, it can be found that the fluctuations in
CD-value before the three earthquakes are all greater than the mean value.
Similarly, the value began to exceed the average value around November 20, and
the CD-value reached its peak on December 16, 2 days before the earthquake. For
the two subsequent earthquakes, CD captured the anomaly, and its value greatly
exceeded the mean. After the earthquake, the CD-value fell, which coincided
with the time of the earthquake.
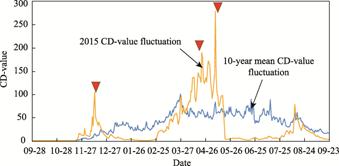
Figure
3 Comparison of the 10-year mean and 2015 of the CD-value
In spatial terms, we can apply the CD-value to further
research the relationship between the anomalous OLR signals and the area. The
CD-values of the 25 grid cells in 2015 was calculated as the unit mean over
every 5 days for about 30 days before the earthquake and 15 days after the
earthquake. The average histogram shown in Figure 4 was obtained, where each
column corresponds to the mean CD value and the red vertical line denotes the
time of the earthquake on May 12, 2014. Analysis suggests that grid cells 11,
12, 16, and 17 in the western vicinity of the epicenter (grid 13) showed
obvious data anomalies, as shown in Figure 4, and all had large CD-values about
one month before the earthquake. Grid cell 13 (the epicenter) exhibits extreme
changes.
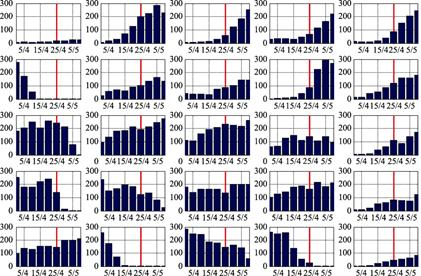
Figure 4
Analysis of CD value of regional correlation pre-seismic anomalies
Comparing the grid with the corresponding geographic
location, the middle horizontal line of the grid in Figure 4 is located on the
Mediterranean-Himalaya seismic zone, which is the
boundary of the Eurasian plate with the African Plate and the Indian Ocean
plate. In Figure 4, there is a clear signal change trend along the
middle horizontal axis of the seismic zone, and the signal characteristics are
obvious in the lower half, which is consistent with the squeeze situation in
the Indian plate. Compared with the trend in mean CD in other grid cells, the
number of cylinders in which the mean CD reaches or exceeds 200 is greatest in
the seismic zone. In particular, the mean CD of grid cells 11, 12, and 13 is
generally around 200, indicating abnormal changes. The anomalous features of
grid cells 12 and 13 are particularly obvious, which conforms to the behavior
of the epicenter and the regional characteristics of the earthquake zone[13].
5 Discussion and
Conclusion
The dataset described in this paper is
based on the 2009?C2018 OLR source data from a rectangular area of Nepal
centered on 28.23??N, 84.73??E. The raw data were
subjected to the ADRM algorithm for anomaly signal mining. For 25 grid cells, a
three-dimensional matrix sequence dataset with dimensions of [366, 25, 10] was
formed. Nepal is located in the Mediterranean-Himalayan earthquake zone. This
seismic zone is the junction of the Eurasian plate with the African Plate and
the Indian Ocean plate. Its seismic activity accounts for 24% of the total
energy released by global earthquakes. Thus, taking Nepal as an example to
study the relationship between earthquakes and signals is of great exploration
value.
The dataset produced in this work provides the basis for
studying the correlation between OLR data and the occurrence of major
earthquakes. Data mining methods are used to extract useful components from the
signal, and these are used for the subsequent research of earthquake prediction
and even the analysis of various other signals Anomaly extraction provides
further research ideas and database libraries.
Author
Contributions
Lin, L. designed
the algorithms for the dataset and wrote the data paper. Jiang, X. Y. contributed
to data processing and collection. Kong, X. Z. contributed to the model design
and algorithm. Li, N. contributed to the data analysis and verification.
References
[1] Liu, D. F., Kang, C. L. Predicting heavy disasters by
outgoing longwave radiation (OLR) of the earth [J]. Earth Science Frontiers, 2003, 10(2): 427?C435.
[2] Kong, X. Z., Bi, Y. X., Glass, D.
Detecting seismic anomalies in outgoing long-wave radiation data [J]. IEEE
Journal of Selected Topics in Applied Earth Observations and Remote Sensing,
2014, 8(2): 649?C660.
[3] Guo, X., Zhang, Y. S., Wei, C. X., et al. Medium wave infrared brightness anomalies
of Wenchuan 8.0 and Zhongba 6.8 earthquakes [J]. Acta Geoscientica Sinica,
2014, 35(3): 338?C344.
[4]
Lin, L., Kong, X., Li, N. A martingale-based temporal
analysis of pre-earthquake anomalies at Jiuzhaigou, China, in the period of
2009?C2018 [C]. In E3S Web of Conferences, EDP Sciences, 2019,
131: 01072.
[5]
Saraf, A. K., Choudhury, S. Cover: NOAA-AVHRR detects thermal anomaly
associated with the 26 January 2001 Bhuj earthquake, Gujarat, India [J]. International
Journal of Remote Sensing, 2005, 26(6): 1065?C1073.
[6]
Ouzounov, D., Bryant, N., Logan, T., et
al. Satellite thermal IR phenomena associated with some of the major
earthquakes in 1999?C2003 [J]. Physics and Chemistry of the Earth, 2006,
31(4): 154?C163.
[7]
Tramutoli, V., Cuomo, V., Filizzola, C., et al. Assessing the potential of thermal infrared satellite
surveys for monitoring seismically active areas: The case of Kocaeli (İzmit)
earthquake, August 17, 1999 [J]. Remote Sensing of Environment, 2005,
96(3): 409?C426.
[8]
Selva, J., Marzocchi, W., Papale, P., et
al. Operational eruption forecasting at high-risk volcanoes: the case of
CampiFlegrei, Naples [J]. Journal of Applied Volcanology, 2012, 1(1): 5.
[9]
Xiong, P., Bi, Y. X., Shen, X. H. Study of outgoing longwave radiation
anomalies associated with two earthquakes in China using wavelet maxima [C]. HAIS??09 Proceedings of the 4th International
Conference on Hybrid Artificial Intelligence Systems, 2009: 77?C87.
[10] Lin, L., Kong, X. Z., Li, N. Dataset of OLR abnormal
signals in Nepal from 2009 to 2018 [DB/OL]. Global Change Data Repository, 2019.
DOI:10.3974/geodb.2019.05.11.V1.
[11] GCdataPR Editorial Office. GCdataPR
data sharing policy [OL]. DOI: 10.3974/dp.policy.2014.05 (Updated 2017).
[12] U.S. Department of Commerce.
National oceanic and atmospheric administration [DB/OL]. ftp://ftp.cpc.necp.noaa.gov/precip/noaa18_olr.
[13] Lin, L., Kong, X. Z., Li, N. Pre-earthquake anomaly
datamining of remote sensing OLR in Nepal earthquake [J]. Journal of Geo-information Science,
2018, 20(8): 1169?C1177.
[14] Intelligence, M., Wechsler, H. A
Martingale framework for detecting changes in data streams by testing exchangeability
[J]. IEEE Transactions on Pattern Analysis and Machine Intelligence,
2010, 32(12): 2113?C2127.
[15] Kong, X., Li, N., Lin, L., et al. Relationship of stress changes
and anomalies in OLR data of the Wenchuan and Lushan earthquakes [J]. IEEE
Journal of Selected Topics in Applied Earth Observations and Remote Sensing,
2018, 11(8): 2966?C2976. DOI: 10.1109/JSTARS.2018.2839089.
[16] Kong, X., Bi, Y., Glass, D. H.
Detecting seismic anomalies in outgoing long-wave radiation data [J]. IEEE
Journal of Selected Topics in Applied Earth Observations and Remote Sensing,
2015, 8(2): 649?C660. DOI: 10.1109/JSTARS. 2014.2363473.
[17] Molchan, G., Romashkova, L., Peresan
A. On some methods for assessing earthquake predictions [J]. Geophysical
Journal International, 2017, 210(3): 1474?C1480.
[18] Li, N., Kong, X., Lin, L. Anomalies
in continuous GPS data as precursors of 15 large earthquakes in Western North
America during 2007?C2016 [J]. Earth Science Informatics, 2019, 12: 1?C12.
[19] USGS [Z]. https://earthquake.usgs.gov/earthquakes/.