MODIS-based Monthly Dataset of Particulate
Organic Carbon Flux in the Bottom of the Global Ocean Euphotic Layer
(2003?C2018)
Xie,
F. T.1,2 Zhou, X.1* Tao, Z.1 Lv, T. T.1 Wang, J.1 Li, R. X.1,2
1. Aerospace Information Research Institute, Chinese Academy
of Sciences, Beijing 100012, China;
2. School of Electronic, Electrical and Communication Engineering, University
of Chinese Academy of Sciences, Beijing 101408, China
Abstract: The research on the flux of particulate organic carbon (POC) in
the bottom of ocean euphotic layer is of great significance for understanding
and evaluating ocean organic carbon pumps and ocean carbon cycles. POC flux is
the product of e-ratio and net primary production (NPP). The accuracy of seven
classic e-ratio estimation models was first evaluated by using the in situ POC flux and NPP products in
this paper. Then the e-ratio of global ocean from 2003 to 2018 was calculated
with the estimation model established by Dunne (2005a) and the monthly MODIS
products with a spatial resolution of 9 km, which include sea surface
temperature (SST), Chlorophyll concentration (Chl) and euphotic zone depth
(Zeu). On this basis, we developed a MODIS-based monthly dataset of POC flux in
the bottom of the global ocean euphotic layer (2003-2018) combined with the
marine NPP data of Tao et al. (2019).
This dataset is monthly data with a spatial resolution of 9 km. Each data file
includes two parameters, poc_flux and pe_ratio, the former is POC flux and the
latter is e-ratio. The dataset is stored in ??.hdf?? format and consists of 192
files, with a data volume of 13.3 GB (compressed into 16 files, 4.48 GB).
Keywords: global ocean;
particulate organic carbon flux; monthly data
Dataset Availability Statement:
The
dataset supporting this paper was published and is accessible through the Digital Journal of Global Change Data Repository at:
https://doi.org/10.3974/geodb.2020.09.02.V1.
1 Introduction
In
the ocean, the transfer of carbon from the surface to the deep water mainly
includes physical process and biological process, among which the biological
process is called marine biological carbon pump (BCP)[1]. BCP not only has profound influence in regulating global atmospheric CO2,
but also is an important indicator for studying global carbon cycle[2]. The flux of particulate organic carbon (POC flux) in the bottom of the
ocean euphotic layer directly reflects the efficiency of BCP[3], therefore, one of the most important methods for studying BCP is to
measure POC flux. Traditional methods for measuring POC flux include the
sedimentation trap method[4] and radioisotope 234Th decay method[5], but the high cost and complicated instrument operations make these methods
unable to obtain long time series in-situ
POC flux of global ocean. In addition, some ecosystem models and earth system
models are emerged by researchers to estimate POC flux[6,7], which have made constructive contributions for
understanding the internal mechanism of POC flux. However, calculating
continuous POC flux simulation data on a global scale requires lots of in-situ and auxiliary data as input,
which is difficult to obtain. The large-scale observation and short revisit
period characteristics of satellite remote sensing enable continuous
observation of global ocean. Early studies have shown that the ratio of the
output POC flux in the bottom of the ocean euphotic layer to net primary
production (NPP) is similar to the ratio of ??new productivity?? to ??total
productivity??[8,9], which directly links POC flux to NPP, and
provides a new approach to estimating POC flux based on remote sensing
satellites.
Based on remote sensing data such as sea surface temperature (SST),
Chlorophyll concentration (Chl), euphotic zone depth (Zeu) and etc.,
researchers have developed a series of models for estimating e-ratio to
calculate the global ocean POC flux[9?C13]. At present, the research on the temporal and
spatial variations of POC flux is mostly concentrated on local waters such as
the Indian Ocean, the South Ocean and the Pacific Ocean, and the analysis of
long time series POC flux of global ocean is insufficient. To provide basic
data for the study of long time series
global ocean POC flux, we developed a monthly dataset of POC flux in the bottom
of global ocean euphotic layer from 2003 to 2018. First, the performance of several
classic POC flux estimation models was evaluated by using the in-situ POC flux and NPP products in
this paper. Then, the best estimation method was selected to calculated global
ocean POC flux combined with the MODIS products data and the NPP product data.
2 Metadata of the Dataset
The metadata of the MODIS-based monthly dataset of POC Flux in the
bottom of the global ocean euphotic layer (2003?C2018)[14] is summarized in Table 1. It includes the
dataset full name, short name, authors, year of the dataset, temporal
resolution, spatial resolution, data format, data size, data files, data
publisher, and data sharing policy, etc.
3 Methods
3.1 Data Sources
The
source data includes the remote sensing data and the in-situ POC flux data. The remote sensing data includes MODIS
products such as SST, Chl and Zeu, as well as the NPP products produced based
on three model of VGPM[16], CbPM[17] and SAbPM[18].
All the products are global ocean monthly data from January 2003 to December
2018 with a spatial resolution of 9 km. The in-situ
POC flux data include the data measured in the Hawaii site (HOT), the Bermuda
site (BATS), the Beaufort Sea and the East China Sea[19?C21]. A total
of 285 POC flux in-situ data were
collected at different water depths from 2003 to 2016. After data preprocessing
and satellite synchronization matching, a total of 230 in-situ POC flux data were used as testing dataset, accounting for
80.7% of all in-situ data.
Table 1 Metadata Summary of the MODIS-based
monthly dataset of POC Flux in the bottom of the global ocean euphotic layer
(2003?C2018)
|
Items
|
Description
|
|
Dataset full name
|
MODIS-based
monthly dataset of POC Flux in the bottom of the global ocean euphotic layer
(2003?C2018)
|
|
Dataset short
name
|
GlobalMarinePOC
|
|
Authors
|
Xie, F. T.
ABH-7123-2020, Aerospace Information Research Institute, Chinese Academy of
Sciences, xieft@radi.ac.cn
Zhou, X.
L-7359-2016, Aerospace Information Research Institute, Chinese Academy of
Sciences, zhouxiang@radi.ac.cn
Tao, Z.
L-4530-2016, Aerospace Information Research Institute, Chinese Academy of Sciences,
taozui@radi.ac.cn
Lv, T. T.
R-8978-2016, Aerospace Information Research Institute, Chinese Academy of Sciences,
lvtt@radi.ac.cn
Wang, J.
ABH-9051-2020, Aerospace Information Research Institute, Chinese Academy of
Sciences, wangjin01@radi.ac.cn
Li, R. X.
ABH-7136-2020, Aerospace Information Research Institute, Chinese Academy of
Sciences, liruoxi19@mails.ucas.ac.cn
|
|
Geographical region
|
Global ocean Year 2003?C2018 Temporal
resolution Month
|
|
Spatial resolution
|
9 km Data
format .hdf Data
size 4.48 GB
|
|
Data files
|
Consists of 192
files (compressed into 16 files)
|
|
Foundations
|
Ministry of
Science and Technology of P. R. China (2018YFE0124200); Chinese Academy of
Sciences (2020)
|
|
Data publisher
|
Global Change Research Data Publishing & Repository,
http://www.geodoi.ac.cn
|
|
Address
|
No. 11A, Datun
Road, Chaoyang District, Beijing 100101, China
|
|
Data sharing policy
|
Data from the Global
Change Research Data Publishing & Repository includes metadata, datasets (in the Digital Journal of Global Change Data Repository), and
publications (in the Journal of Global Change Data & Discovery). Data sharing policy includes: (1) Data are openly available
and can be free downloaded via the Internet; (2) End users are encouraged to
use Data subject to citation; (3) Users, who are by definition
also value-added service providers, are welcome to redistribute Data
subject to written permission from the GCdataPR Editorial Office and the
issuance of a Data redistribution license; and (4) If Data are used to compile
new datasets, the ??ten per cent principal?? should be followed such that Data
records utilized should not surpass 10% of the new dataset contents, while
sources should be clearly noted in suitable places in the new dataset[15]
|
|
Communication and
searchable system
|
DOI, DCI, CSCD,
WDS/ISC, GEOSS, China GEOSS, Crossref
|
3.2
Algorithm Principle
POC
flux is the product of e-ratio and NPP, so both the accuracy of the e-ratio
estimation model and NPP data will affect the estimation results of POC flux.
The accuracy of seven classic e-ratio estimation models in Table 2 was first
evaluated by using the in-situ POC
flux and three different NPP products. Since the in-situ POC flux were collected from different water depths, and
the data calculated by the models is the POC flux in the bottom of the ocean
euphotic layer, they cannot be compared directly. We first used the classic POC
flux vertical migration formula[22] to convert all POC flux data to
the data of 150 m water depth (most of the
in-situ data were collected at this depth), then compared them and used the
logarithmic deviation (Bias), the logarithmic root mean square error (RMSD),
coefficient of determination (R2)
and the average relative error (r.e) to evaluate the results[23].
The vertical
migration of POC flux is shown in Equation (1), where POC(z) and POC(z0) are the POC flux at water depth
z and z0,
respectively.
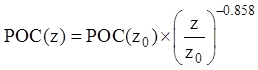 (1)
(1)
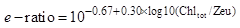
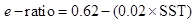
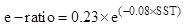
Table 2 lists seven classic
e-ratio estimation models, in which Chltot is the integral of Chl in ocean euphotic layer.
Table
2 Seven classic POC output
ratio (e-ratio) estimation models
|
Author
|
Model Expression
|
|
Baines (1994)
|
|
|
Laws (2000)
|
|
|
Dunne (2005a)
|

|
|
Dunne (2005b)
|

|
|
Henson (2011)
|
|
|
Laws (2011a)
|

|
|
Laws (2011b)
|

|
After evaluation,
we found that the POC flux calculated using the e-ratio model of Dunne (2005a)[11]
and the NPP data of SAbPM model has the highest accuracy and stability. On this
basis, global ocean e-ratio data was calculated by using MODIS?? SST, Chl and
Zeu products, and then combined with the NPP data published by Tao et al.[24], POC flux in the
bottom of global ocean euphotic layer was calculated according to Equation (2).
 (2)
(2)
3.3 Technical Route
|
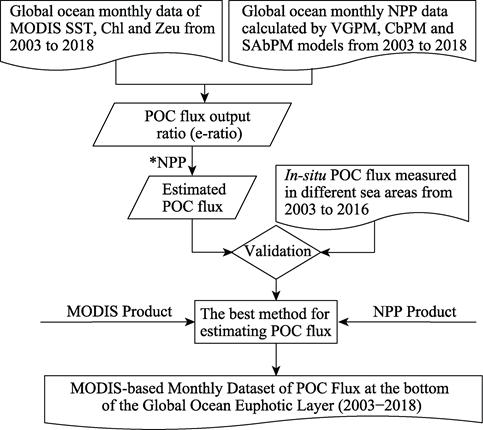
Figure 1 The technical route of developing the dataset
|
The
technical route of developing the dataset is shown in Figure 1. First, e-ratio
of global ocean was calculated by using the MODIS products from 2003 to 2018
according to Dunne (2005a)??s estimation model in Table 2, and then multiplied
by the NPP data to obtain the estimation global ocean POC flux. For comparative
analysis, both the estimation POC flux and the in-situ POC flux were converted to the data of 150 m water depth according
to Equation (1), and used the accuracy indicators in section 3.2 to evaluate
the accuracy and stability of the estimated POC flux. Finally, the optimal
method for estimating POC flux was selected, that is, the combination of the
e-ratio estimated by Dunne (2005a)??s model and the NPP data retrieved by the
SAbPM model. Using the MODIS products and NPP products from January 2003 to December
2018 as inputs, the MODIS-based monthly dataset of POC flux in the bottom of
global ocean euphotic layer was developed.
4 Results and Validation
4.1 Data Products
The
monthly average data with the spatial resolution of 9 km contains a total of
192 data files from January 2003 to December 2018. Each data file includes
POC_flux and pe_ratio two parameters, the former is POC flux and the latter is
e-ratio. The unit of POC flux is mgC??m?C2??day?C1, and
e-ratio has no unit. The data is stored in ??.hdf?? format, with a total data size
of 13.3 GB. The data is compressed into ??.zip?? format according to different
year, that is, a total of 16 compresses files with the data size of 4.48 GB.
4.2 Data Results
From
Figure 2, we can see that the global ocean POC flux
has different distribution characteristics in different regions. The POC flux
in most sea areas is less than 100 mgC??m?C2??day?C1 between 30??N and 30??S, while in high latitude sea
areas, the maximum POC flux may exceed 600 mgC??m?C2??day?C1. In addition, the
POC flux in Continental Margins is much higher than the POC flux in Deep Ocean, where Continental Margins refers to the sea areas with a water depth less
than 2,000 m, while the water depth of Deep Ocean is greater than 2,000 m. In
order to highlight the spatial distribution of POC flux, we have calculated the
annual average data of the global ocean POC flux from 2003 to 2018, and
analyzed the proportion of POC flux in different latitudes and sea areas to the
total global ocean POC flux. The results are shown in Table 3.
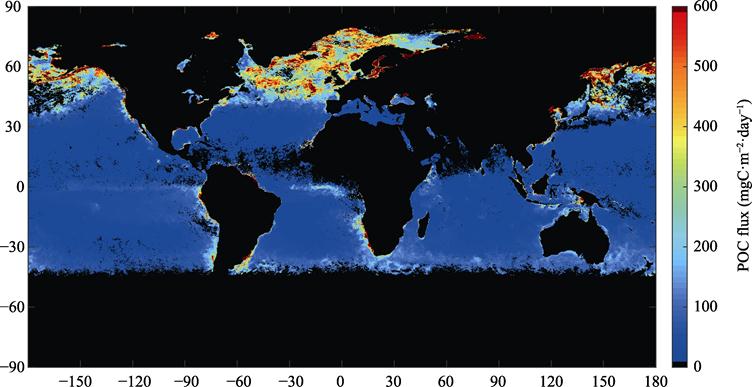
Figure 2 Map of monthly average POC
flux in the bottom of global ocean euphotic layer (June 2015)
|
Table 3 The proportion of POC
flux statistics in different latitudes and sea areas
|
|
Sea Areas
|
POC flux
|
|
0?C30??
|
28.70%
|
|
30?C60??
|
61.00%
|
|
60?C90??
|
10.30%
|
|
Continental Margins
|
29.50%
|
|
Deep Ocean
|
70.50%
|
From Table 3, we
found that the annually average amount of POC flux is 11 PgC??m?C2??yr?C1, where the POC flux in the low latitude (0?C30??) sea areas accounts for 28.7% of the total, and the
POC flux in the mid latitude (30?C60??) sea areas accounts for 61%. It is caused
by the difference of e-ratio, the e-ratio of low latitude sea areas is
generally low, only about 10%, while the average e-ratio of mid latitude sea areas
is more than 30%, and the e-ratio of some continental shelf sea areas is even
higher than 50%. In the high latitude (60?C90??) sea areas, due to the small
ocean area and the freezing period in the north and south poles, the POC flux
only accounts for 10.3% of the total. In addition, the POC flux in Deep Ocean accounts
for 70.5% of the total, and the POC flux in Continental Margins accounts for
29.5%. Although the area of Continental Margins is about 4.8??107 km2,
which is only 1/7 of the global ocean area, the POC flux in Continental Margins
accounts for about 1/3 of the global ocean due to the higher e-ratio. It is a
non-negligible part of the global ocean carbon cycle and worthwhile for us to
conduct more research.
From Figure 3, we
found that the POC flux in the bottom of global ocean euphotic layer shows a
decreasing trend. We analyzed the changes of POC flux in time scale in the sea
areas at latitudes of 0?C30??, 30?C60?? and 60?C90??, respectively, and found that in
low latitude and mid latitude sea areas, the annually average POC flux
decreased year by year, and the rate of descent is faster in low latitude sea
areas. In high latitude sea areas, the annually average POC flux is increasing
year by year. Global warming led to the area of open waters in the Polar
Regions increasing continuously, which explains the continuous increase of POC
flux.
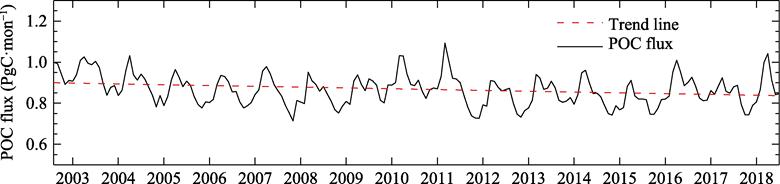
Figure
3 Monthly average POC flux of
global ocean from 2003 to 2018
4.3 Data Validation
Compared
with the POC flux data calculated by using other e-ratio models and NPP products,
the global ocean POC flux estimated by using Dunne (2005a)??s e-ratio model and
the NPP product of SAbPM model has the highest accuracy and stability. Among
the accuracy indicators, Bias is only ?C0.01, RMSD is 0.17, R2 is 0.50 and r.e is 30%. The detailed comparison
results of the estimated POC flux with the in-situ
POC flux can be found in Xie et al.
(2019)[25]. In addition, the annually average POC flux of global
ocean is about 11 PgC??m?C2??yr?C1. Taking into account the
average relative error of the estimation results and the lack of data in polar
regions, the annually average POC flux of global ocean calculated in this
dataset is about 8.5?C14.3 PgC??m?C2??yr?C1. It is close to
the estimation results of most researchers[12, 26?C27], which proves
that the POC flux dataset developed in this paper is accurate and reliable.
The in-situ
POC fluxes of HOT and BATS are long time series data from 2003 to 2016, and their temporal changes can be used to clarify the
trend of global ocean POC flux.
Figure
4 is the scatter plots of the in-situ
POC flux data in these two sites. From the trend lines and the coefficients of
equations in the figure, it can be seen that from 2003 to 2016, the POC flux
shows a decreasing trend year by year. It is consistent with the changing trend
of the POC flux estimated in this paper, proving that POC flux in this dataset
can clearly reflect the change of global ocean POC flux.
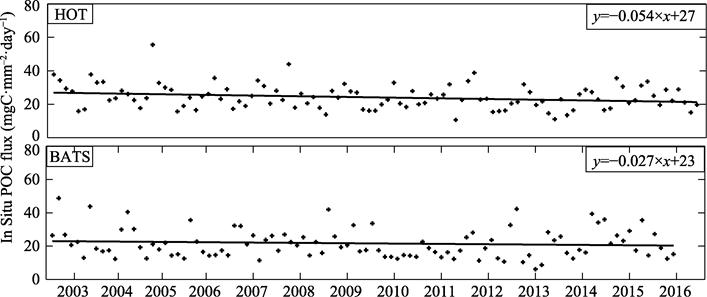
Figure 4 Monthly data of in-situ POC flux in HOT and BATS and their changing trend from 2003
to 2016
5 Discussion and Conclusion
BCP
is related to the regulation of CO2 content in the atmosphere, the
carbon cycle and carbon balance in the ocean, and POC flux is a key indicator
to evaluate the efficiency of BCP. Therefore, the issue on spatial and temporal
variations of POC flux is a hot topic that many researchers pay attention to.
Based on Dunne (2005a)??s e-ratio estimation model and NPP products provided by
Tao et al. (2019), this paper
developed MODIS-based monthly dataset of POC flux in the bottom of global ocean
euphotic layer (2003?C2018).
The in-situ POC fluxes used in this paper to
validate the estimation results are the measured data of long time series
observation sites in the equatorial Pacific Ocean (HOT and BATS), as well as
some observation data in the East China Sea and the Beaufort Sea. The
observation areas cover the low, mid and high latitude sea areas, and the
values of in-situ data cover the
range of high and low values, both of which prove that these in-situ POC flux data are enough to
represent the global ocean POC flux. Compared with these in-situ POC flux data, the POC flux calculated by using Dunne
(2005a)??s e-ratio model and NPP data based on SAbPM model has the highest
accuracy and the best stability. In addition, we analyzed the variation of
global ocean monthly POC flux from 2003 to 2018, and found that it shows a
decreasing trend year by year, which is consistent with the changing trend of
the in-situ POC flux.
In summary, the
MODIS-based monthly dataset of POC flux in the bottom of global ocean euphotic
layer (2003?C2018) developed in this study provides basic data of a time series of
global ocean POC flux, which sould be effectively used to in studying the spatial
distribution and temporal variation of global ocean POC flux.
Author Contributions
Zhou,
X. and Tao, Z. made the overall design for the development of the dataset. Xie,
F. T. and Tao, Z. collected and processed MODIS data, POC flux in-situ data and NPP products. Xie, F.
T. finished data analysis and validation, all the authors jointly wrote and
revised the data paper.
Conflicts of Interest
The authors
declare no conflicts of interest.
References
[1]
Falkowski, P. G., Barber, R. T.,
Smetacek, V. Biogeochemical controls and feedbacks on ocean primary production
[J]. Science, 1998, 281(5374): 200?C206.
[2]
Lima, I. D., Lam, P. J., Doney,
S. C. Dynamics of particulate organic carbon flux in a global ocean model [J]. Biogeosciences,
2014, 11(4): 1177?C1198.
[3]
Ducklow,
H. W., Steinberg, D. K., Buesseker, K. O. Upper ocean carbon export and the biological pump [J]. Oceanography, 2001, 14(4):
50?C58.
[4]
Gardner, W. Sediment Trap
Sampling in Surface Waters [M]. Cambridge: Cambridge University Press, 2000.
[5]
Loeff, D., Van, M. R., Pinghe,
H., et al. 234Th in surface waters: distribution of particle
export flux across the Antarctic Circumpolar Current and in the Weddell Sea
during the GEOTRACES expedition ZERO and DRAKE [J]. Deep Sea Research,
2011, 58(25): 2749?C2766.
[6]
Gloege, L., Mckinley, G. A.,
Mouw, C. B., et al. Global evaluation of particulate organic carbon flux
parameterizations and implications for atmospheric pCO2: evaluating
POC flux parameterizations [J]. Global Biogeochemical Cycles, 2017,
31(7): 1192?C1215.
[7]
Buesseler, K. O., Boyd, P. W.
Shedding light on processes that control particle export and flux attenuation
in the twilight zone of the open ocean [J]. Limnology and Oceanography,
2009, 54(4): 1210?C1232.
[8]
Dugdale, R. C., Georing, J. J.
Uptake of new and regenerated forms of nitrogen in primary productivity [J]. Limnology
& Oceanography,
1967, 12(2): 196?C206.
[9]
Baines, S. B., Karl, P. D. M.
Why does the relationship between sinking flux and planktonic primary production
differ between lakes and oceans [J]. Limnology and Oceanography, 1994,
39: 213?C226.
[10]
Laws, E. A., Falkowski, P. G.,
Smith, W. O., et al. Temperature effects on export production in the
open ocean [J]. Global Biogeochemical Cycles, 2000, 14(4): 1231?C1246.
[11]
Dunne, J. P., Armstrong, R. A.,
Gnanadesikan, A., et al. Empirical and mechanistic models for the
particle export ratio [J]. Global Biogeochemical Cycles, 2005, 19(4): GB4026.
[12]
Henson,
S. A., Sanders, R., Madsen, E., et al. A reduced
estimate of the strength of the ocean??s biological carbon pump [J]. Geophysical
Research Letters, 2011, 38(4): L04606.
[13]
Laws,
E. A., D??Sa, E., Naik, P., et al. Simple
equations to estimate ratios of new or export production to total production
from satellite-derived estimates of sea surface temperature and primary production
[J]. Limnology and Oceanography Methods, 2011, 9(12): 593?C601.
[14]
Xie,
F., Zhou, X., Tao, Z., et al. MODIS-based monthly dataset of POC flux in the bottom of the global
ocean euphotic layer (2003?C2018) [J/DB/OL]. Digital Journal of Global Change
Data Repository, 2020. https://doi.org/10.3974/geodb.2020.09.02.V1.
[15]
GC dataPR Editorial Office. GC
dataPR Data Sharing Policy [OL]. https://doi.org/10.3974/dp.policy. 2014.05
(Updated 2017).
[16]
Behrenfeld, M. J., Falkowski,
P. G. A consumer??s guide to phytoplankton primary productivity models [J]. Limnology
& Oceanography,
1997, 42(7): 1479?C1491.
[17]
Behrenfeld, M. J., Boss, E.,
Siegel, D. A., et al. Carbon-based ocean productivity and phytoplankton
physiology from space [J]. Global Biogeochemical Cycles, 2005, 19(1): GB1006.
[18]
Tao,
Z., Wang, Y., Ma, S., et al. A Phytoplankton
class-specific marine primary productivity model using MODIS data [J]. IEEE
Journal of Selected Topics in Applied Earth Observations & Remote Sensing, 2017,
10(12): 5519?C5528.
[19]
Hung, C. C., Tseng, C. W.,
Gong, G. C., et al. Fluxes of
particulate organic carbon in the East China Sea in summer [J]. Biogeosciences,
2013, 10(10): 6469?C6484.
[20]
Hung, C. C., Chen, Y. F., Hsu,
S. C., et al. Using rare earth elements to constrain particulate organic
carbon flux in the East China Sea [J]. Scientific Reports, 2016, 6:
33880.
[21]
Sallon, A., Michel, C.,
Gosselin, M. Summertime primary production and carbon export in the
southeastern Beaufort Sea during the low ice year of 2008 [J]. Polar Biology,
2011. 34(12): 1989?C2005.
[22]
Martin,
J. H., Knauer, G. A., Karl, D. M., et al. VERTEX:
carbon cycling in the northeast Pacific [J]. Deep Sea Research, 1987,
34(2): 267?C285.
[23]
Friedrichs, M., Carr, M.
Barber, R., et al. Assessing the uncertainties of model estimates of
primary productivity in the tropical Pacific Ocean [J]. Journal of Marine
Systems, 2009, 76(1): 113?C133.
[24]
Tao,
Z., Zhou, X., Xie, F., et al. Time series of monthly global marine NPP dataset based on MODIS and
SABPM model (since 2003) [DB/OL]. Global Change Data Repository, 2019. https://doi.org/10.3974/geodb.2019.05.01.V1.
[25]
Xie,
F., Tao, Z., Zhou, X., et al. Spatial and temporal variations of particulate
organic carbon sinking flux in global ocean from 2003 to 2018 [J]. Remote
Sensing, 2019, 11(24): 2941.
[26]
Bopp,
L., Monfray, P., Aumont, O., et al. Potential
impact of climate change on marine export production [J]. Global
Biogeochemical Cycles, 2001, 15(1): 81?C99.
[27]
Henson,
S. A., Yool, A., Sanders, R. Variability in efficiency of particulate organic
carbon export: a model study [J]. Global Biogeochemical Cycles, 2015, 29(1): 33?C45.