A 1-km
Resolution Daily Land Surface Temperature Dataset for the Qinghai-Tibet Plateau
(2000-2020)
Xu, X. P.1, 2, 3 Zhang, Y.1, 2, 3 Zhang, Y. C.4 Ji, L. Y.1,2 Tang, H. R.1, 2, 3*
1. Aerospace Information Research Institute,
Chinese Academy of Sciences, Beijing 100094, China;
2. the Key Laboratory of Technology in
Geo-Spatial information Processing and Application System, Chinese Academy of
Sciences, Beijing 100190, China;
3. the School of Electronic, Electrical and
Communication Engineering, University of Chinese Academy of Sciences, Beijing
101408, China;
4. A military representation room of the PLA
rocket forces, Beijing 100000, China
Abstract: Remote
sensing data are strongly correlated with continuity in space and time, giving
remote sensing time-series images low rank. This paper repairs images using
low-rank tensor complementation by pre-processing the Moderate Resolution Imaging Spectroradiometer (MODIS)
land surface temperature (LST) data and employing spatiotemporal interpolation
to initially fill in missing values caused by cloud cover. We then treat the
LST time series data as a third-order spatiotemporal tensor and introduce a
Fourier transform on the time dimension to convert it into a space-frequency
tensor. Performing singular value decomposition and Gaussian low-pass filtering
on this tensor followed by inverse a Fourier transform provides the space-time
tensor. We further optimize the missing tensor using the alternating direction
method of multipliers. Accuracy is validated through simulations, where
artificial masks are added and subsequently recovered. The resulting mean absolute error (MAE) falls within the
2.1?C4.9 K. This dataset includes the following daily data for the Tibetan
Plateau for the years 2000?C2020. (1) The optimized surface temperature data
(MOD11A1_QTP_PART and MYD11A1_QTP_PART) for the cloud-shaded regions of the
MOD11A1 and MYD11A1 products. (2) The optimized MOD11A1 for the cloud-shaded
regions, and MYD11A1 products as the optimized surface temperature data
(MOD11A1_QTP_Temp and MYD11A1_QTP_Temp). (3) Original MOD11A1 and MYD11A1
products (MOD11A1_QTP_ORIGIN and MOD11A1_QTP_ORIGIN). All data have a spatial
resolution of 1 km and are archived in an integer data format. The image
element values represent the thermodynamic temperature of the surface with a
scale factor of 0.02 K The dataset is archived in .tif format, which can be
directly opened and processed using remote sensing software such as ENVI and
ArcGIS.
Keywords: Qinghai-Tibet Plateaut; daily land
surface temperature; 1
km; 2000?C2020;
MODIS
DOI: https://doi.org/10.3974/geodp.2023.03.03
CSTR:
https://cstr.escience.org.cn/CSTR:20146.14.2023.03.03
Dataset Availability Statement:
The
dataset supporting this paper was published and is accessible through the Digital
Journal of Global Change Data Repository at: https://doi.org/10.3974/geodb.2023.10.02.V1
or https://cstr.escience.org.cn/CSTR:20146.11.2023.10.02.V1.
1 Introduction
Land
surface temperature (LST) refers to the energy emitted and radiated by Earth??s
surface in the near-infrared and thermal infrared bands. It is a significant
indicator describing the thermal state of Earth??s surface. This parameter holds
considerable research value in fields such as climate change, ecological
environment, and agricultural production[1?C3]. Leveraging remote sensing data to acquire LST allows for rapidly,
comprehensively, and accurately assessing surface temperature distributions
over large areas. This capability effectively guides decision-making and
planning across relevant domains. The resolution and accuracy of LST data have
remarkably improved with the continuous advancement of remote sensing
technology and ongoing updates to satellite data. This has led to an increased
production of LST products available for researchers.
The Qinghai-Tibet
Plateau region is pivotal due to its vast territory, abundant resources, unique
geographical environment, and distinctive climatic conditions. Thus, it is
consistently positioned as a focal point in geography, climate, and
environmental sciences. In recent years, intensified global climate change has
drawn widespread attention and research efforts toward abnormal variations in
LSTs within the Qinghai-Tibet Plateau region. Therefore, studying land surface
temperatures in this area has profound theoretical and practical significance
as it is intricately linked to many issues spanning climate change, water
resource management, and ecological environment protection. However, this
region??s intricate topography and complex climate substantially challenge
acquiring and processing remote sensing data. One notable challenge is cloud
cover, which significantly impacts the accuracy and usability of land surface
temperature data, diminishing its application value. Consequently, enhancing
the quality and usability of LST data is a critical challenge demanding
immediate attention.
The low-rank
tensor completion method effectively applies to cloud restoration in remote
sensing imagery[4?C7]. This method exploits low-rank data attributes, enabling tensor
completion from incomplete observations and recovering information masked by
cloud layers in remote sensing data. This technique elevates data quality and
utility by preserving fine details. This paper uses the MOD11A1 V6 and MYD11A1
V6 products of day-by-day surface temperature data and joint spatiotemporal
low-rank tensor complementation[8] to replace missing data and cropping
day-by-day surface temperature data in the Tibetan Plateau region[9].
Finally, a daily cloud-free surface temperature dataset is produced for the
Tibetan Plateau region from 2000?C2022. This dataset has a wide range of
research and application value and promotes the development of climate
research, ecological and environmental assessments, and other related fields in
the Qinghai-Tibet Plateau region.
2 Metadata of the Dataset
The
metadata of the 1-km/Daily land surface temperature optimized dataset for the
Qinghai-Tibet Plateau based on MODIS data (2000?C2020)[10] is
summarized in Table 1. It includes the dataset full name, short name, authors,
year, temporal resolution, spatial resolution, data format, data size, data
files, data publisher, data sharing policy, etc.
Table 1
Metadata summary of
the 1-km/Daily land surface temperature optimized dataset for the Qinghai-Tibet
Plateau based on MODIS data (2000?C2020)
|
Items
|
Description
|
|
Dataset full name
|
1-km/Daily land
surface temperature optimized dataset for the Qinghai-Tibet Plateau based on
MODIS data (2000?C2020)
|
|
Dataset short
name
|
MODIS_QTP_Temp
|
|
Authors
|
Xunpeng Xu,
Aerospace Information Research Institute, Chinese Academy of Sciences,
xuxunpeng21@mails.ucas.ac.cn
|
|
|
Yu Zhang,
Aerospace Information Research Institute, Chinese Academy of Sciences,
zhangyu217@mails.ucas.ac.cn
Luyan Ji,
Aerospace Information Research Institute, Chinese Academy of Sciences,
jily@mail.ustc.edu.cn
Hairong Tang,
Aerospace Information Research Institute, Chinese Academy of Sciences,
tanghr@aircas.ac.cn
|
|
Geographical
region
|
Qinghai-Tibet
Plateau
|
|
Year
|
2000-2022
|
|
Temporal
resolution
|
1 day
|
|
Spatial
resolution
|
1 km
|
|
Data format
|
.tif
|
|
|
|
Data size
|
138 GB (after
compression)
|
|
|
|
Data files
|
(1) the optimized
surface temperature data (MOD11A1_QTP_PART, MYD11A1_QTP_PART) for the
cloud-shaded regions of the MOD11A1, MYD11A1 products
(2) the optimized
MOD11A1 for the cloud-shaded regions, MYD11A1 products, i.e., optimized
surface temperature data (MOD11A1_QTP_Temp, MYD11A1_QTP_Temp)
(3) original
MOD11A1 and MYD11A1 products (MOD11A1_QTP_ORIGIN, MOD11A1_QTP_ORIGIN), and
the naming rule of the data in each directory is YYYYYDDD.tif, where YYYYY
stands for the year, and DDD stands for the number of the first day of a
particular year, e.g. 2020001.tif
|
|
Foundations
|
Ministry of
Science and Technology of P. R. China (2019QZKK0206, 31400)
|
|
Data publisher
|
Global Change Research Data Publishing & Repository,
http://www.geodoi.ac.cn
|
|
Address
|
No. 11A, Datun
Road, Chaoyang District, Beijing 100101, China
|
|
Data sharing
policy
|
(1) Data
are openly available and can be free downloaded via the Internet; (2) End
users are encouraged to use Data subject to citation; (3)
Users, who are by definition also value-added service providers, are welcome
to redistribute Data subject to written permission from the GCdataPR Editorial
Office and the issuance of a Data redistribution license; and (4)
If Data
are used to compile new datasets, the ??ten per cent principal?? should be
followed such that Data records utilized should not
surpass 10% of the new dataset contents, while sources should be clearly
noted in suitable places in the new dataset[11]
|
|
Communication and searchable system
|
DOI, CSTR, Crossref, DCI, CSCD, CNKI,
SciEngine, WDS/ISC, GEOSS
|
3 Methods
3.1 Data Source
The
utilized dataset originates from MOD11A1 V6 and
MYD11A1 V6, which
are the daily LST products based on MODIS. These products offer diurnal and
nocturnal LSTs around the globe, including the Qinghai-Tibet Plateau region.
Specifically, the MOD11A1 data are acquired from the Terra satellite, while the
MYD11A1 data are acquired from the Aqua satellite. Due to the differing
satellite overpass times, these sources provide remote sensing data for morning
and afternoon observations.
This paper
focuses on the LST_Day_1km band for the recovery process. This band is a
pivotal component of the MOD11A1 V6 and MYD11A1 V6 products and is designed to
capture daytime LST information. It offers a spatial resolution of 1 km and a
temporal resolution of 1 day, with each scene??s dimensions measuring 1200??1200
pixels. Data within the LST_Day_1km band fall within the range of 7,500?C65,535
with a scaling factor of 0.02. Any invalid values are designated as 0.
3.2 Data Pre-processing
The
Qinghai-Tibet Plateau region is frequently characterized by cloud cover
throughout the year, leading to considerable LST data being persistently
obscured. Directly applying the joint time-domain fast Fourier transform (FFT)
low-rank tensor completion algorithm could mistakenly interpret persistent
cloud cover as low-frequency components, interfering with the intended ground
feature recovery. This often results in the appearance of numerous black
stripes in the restoration output, affecting data usability. To address this
issue, a pre-processing step is essential for the LST data. Spatial and
temporal interpolation is employed to predominantly recover missing values
caused by cloud cover, as illustrated in Figure 1.
The LST data for
multiple temporal instances are initially arranged along the time dimension,
denoted as  , where
  and
and  represent the
spatial dimensions of the data, and
represent the
spatial dimensions of the data, and  indicates the
time series length. Subsequently, the time series
indicates the
time series length. Subsequently, the time series  is divided into
numerous small windows sized at 100??100. The effective values within each
window are averaged to form the downsampled time series
is divided into
numerous small windows sized at 100??100. The effective values within each
window are averaged to form the downsampled time series  . A linear relationship between the original time series X
and the downsampled effective values is determined
pixel by pixel using the least squares method. Finally, utilizing the
coefficients obtained through this solution and the downsampled time series restores the data
for cloud-covered areas and yields the preprocessed LST time series
. A linear relationship between the original time series X
and the downsampled effective values is determined
pixel by pixel using the least squares method. Finally, utilizing the
coefficients obtained through this solution and the downsampled time series restores the data
for cloud-covered areas and yields the preprocessed LST time series  . This data pre-processing removes a significant portion of
the cloud contamination, enabling smoother tensor completion operations in
subsequent steps.
. This data pre-processing removes a significant portion of
the cloud contamination, enabling smoother tensor completion operations in
subsequent steps.

Figure 1 Schematic diagram of the
data pre-processing
Given the extended
length of our time series, employing spatiotemporal interpolation with
cloud-free periods of LSTs enhances the stability and accuracy of the acquired
image information. Downsampling using 100??100 windows ensures local spatial
consistency and prevents abrupt data discontinuities. Applying the least squares
method to establish a linear relationship between the original and downsampled
time series effective values allows for more accurately predicting missing
values, mitigating cumulative errors stemming from an excess of missing points.
3.3 Algorithmic Principle
Due
to the strong spatial and temporal correlations and the continuity in remote
sensing data, the time series of remote sensing images, denoted as X, possess a
low-rank property. Leveraging low-rank tensor completion is aimed at achieving
image restoration. This paper employs distinct decomposition methods to handle
spatial and temporal dimensions. We introduce Fourier transformations to filter
the temporal dimension, adaptively select weights based on the temporal
frequency spectrum attributes, and apply them to the low-rank matrix completion
in the spatial dimension. We then exploit the conjugate symmetry in the
frequency domain to accelerate the computational speed. The proposed approach
emphasizes the low-frequency components brought about by land cover changes in
the temporal dimension while suppressing high-frequency noise induced by
clouds. This process achieves a joint low-rank completion in both the temporal
and spatial dimensions.
3.4 Technological Route
A
roadmap of the dataset production techniques is shown in Figure 2. The pre-processing
part was described in Section 3.2, and the recovery part is described in this
section.
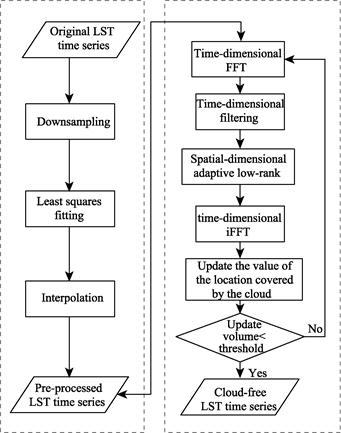
Figure 2 The technical route for
dataset production
3.4.1 Time Dimension FFT
The
Fourier transform projects time domain signals onto a set of orthogonal
trigonometric function bases, suitable for serial data decomposition and
processing. We introduce the Fourier transform in the time dimension of the
tensor to transfer it into the frequency domain for processing as:
 (1)
(1)
where,  denotes the
Fourier-transformed tensor, which we call the space-frequency tensor.
denotes the
Fourier-transformed tensor, which we call the space-frequency tensor.
3.4.2 Time Dimension Filtering
After
the time-dimensional Fourier transform, the time-series surface temperature
data spectrum can be divided into low- and high-frequency components. The
low-frequency component corresponds to slow changes or static conditions, while
the high-frequency component corresponds to significant changes in time, such
as clouds and noise. We apply a Gaussian filter in the
time-dimensional to preserve the main low-frequency components and weaken the
effects of clouds, noise, etc. The Gaussian filter function is  , where
  is the number of
image elements, and
is the number of
image elements, and  is a defined
constant.
is a defined
constant.
3.4.3 Spatial Dimension Adaptive Low-Ranking
To
jointly achieve spatiotemporal and spatial low rank for better selection and
preservation of feature information in images, the tensor is subjected to
low-rank processing with adaptive weights for frequency domain modulation. The
threshold  for the low-rank
processing of each slice is determined for different slices
for the low-rank
processing of each slice is determined for different slices  based on the
importance of the matrix information as:
based on the
importance of the matrix information as:
 (2)
(2)
 (3)
(3)
3.4.4 Time Dimension iFFT
After
the above three steps, we performed the inverse Fourier transform to obtain the
solution in the form  .
.
Updating the
values of the cloud-covered locations until they are less than the threshold
provides the cloud-free LST time series.
4 Data Results and Validation
4.1 Data Composition
The
dataset is divided into two directories based on the satellite,
MOD11A1_QTP_Temp and MYD11A1_QTP_Temp. The naming convention of the data in
each directory is YYYYYDDD.tif, where YYYYY is the year, and DDD is the first
day of a particular year, e.g., 2020001.tif.
4.2 Data Products
This
paper selects the data of 2020001.tif from the MOD11A1_QTP_Temp product as an
illustration in Figure 3. The black part of the image is the region outside the
Tibetan Plateau, represented by a 0 in the data. The gray part is the study
area with a valid value range of 7,500?C65,535.
We qualitatively
analyzed the data near the Nam Co Lake region. Figures 4 and 5 show scatter
plots of surface temperature data for 2000?C2009 and 2010?C2020, respectively.
The blue portion indicates valid retained values in the original product, and
the red portion indicates missing data in the original product that was
recovered using the proposed algorithm. The recovered data match the surface
temperature trends.
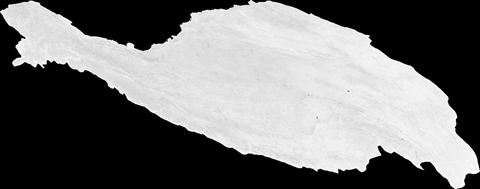
Figure 3 Map of presentation
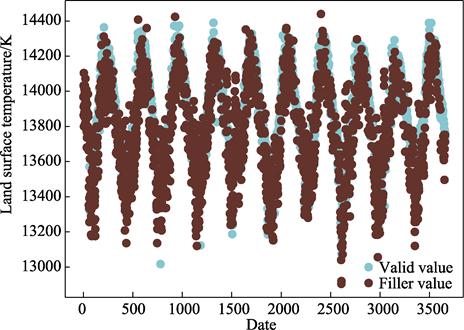
Figure 4 Scatter plot of land
surface temperature data in the Nam Co Lake region (2000?C2009)
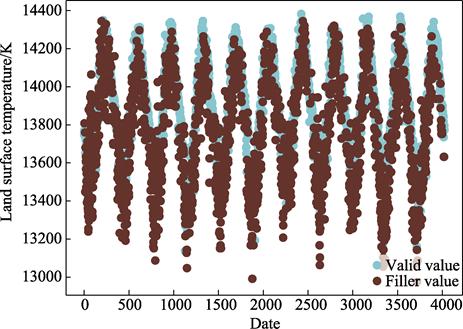
Figure 5 Scatter plot of land
surface temperature data in the Nam Co Lake region (2010?C2020)
Besides, we
plotted a line graph of the annual mean surface temperature in the Nam Co Lake
region in Figure 6 to demonstrate the trend over 20 years. Changes in the
surface temperature are relatively smooth, with a variation of about 1 K
between adjacent years.
4.3 Data Validation
Due
to the lack of real data, we used simulations to verify the recovery accuracy
of the dataset. We took the data from the MOD11A1 V6 product in 2020 as an
example, randomly selected eight cloud-free regions with different dates and
locations, manually added masks for these regions, used 0 values to replace the
surface temperature information in the original product, and used the proposed
method to recover the surface information. Finally, we evaluated the recovered
values of the regions using metrics, as shown in Table 2.
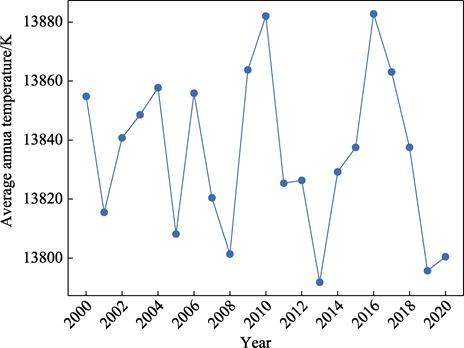
Figure 6 Trends in annual mean
surface temperature in the Nam Co Lake region (2000?C2020)
Table 2 The effectiveness of land surface
temperature recovery in regions with manually added masks (dimensionless)
|
Parameter
|
Region1
|
Region2
|
Region3
|
Region4
|
Region5
|
Region6
|
Region7
|
Region8
|
|
MAE
|
3.013,4
|
3.812,5
|
4.912,9
|
4.333,4
|
4.716,9
|
2.806,4
|
2.112,0
|
3.624,1
|
|
RMSE
|
3.992,6
|
4.553,3
|
6.164,6
|
5.402,0
|
5.659,0
|
3.582,7
|
2.689,3
|
4.731,6
|
|
R
|
0.789,0
|
0.748,9
|
0.641,2
|
0.373,4
|
?C0.810,3
|
0.554,4
|
0.694,2
|
0.408,1
|
We also compared
the proposed product with other existing products, as shown in Table 3. Product
1 is the Landsat time-series surface temperature for the Tibetan Plateau region
in 2020[11,12], and Product 2 is the 1-km seamless surface
temperature dataset for the Chinese region (2002?C2020)[13?C16] .
Table 3 Recovery of land surface temperature in
the Nam Co Lake region by 2020 in the context of existing relevant studies
|
Product
|
20200101
|
20200117
|
20200202
|
20201031
|
20201116
|
20201202
|
20201218
|
|
Product1
|
240.00
|
279.30
|
239.90
|
308.70
|
292.80
|
283.50
|
278.50
|
|
Product2
|
276.80
|
280.32
|
278.92
|
304.64
|
285.36
|
280.08
|
279.66
|
|
Ours
|
268.96
|
275.84
|
278.24
|
296.16
|
284.32
|
276.64
|
274.56
|
The different
times for satellites transits do not allow directly comparing products. This
paper compares the reliability and accuracy of the proposed methodology by
plotting the trends for recovering the relevant surface temperatures in Figure
7. The proposed product shows the same trend as other products in recovering
surface temperatures and better balances temporal resolution with spatial
accuracy.
5 Discussion and Conclusion
This
study developed a daily land surface temperature dataset for the Qinghai-Tibet
Plateau region from 2000 to 2022 using a joint spatiotemporal low-rank
approach, followed by accuracy validation. This dataset holds significant
research and application value, contributing to the advancement of various
fields, such as climate research and ecological environment assessment in the Qinghai-Tibet
Plateau region.
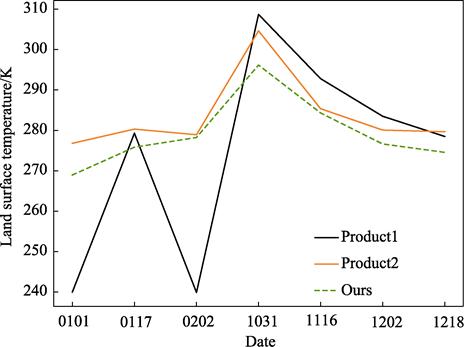
Figure 7 Trends in surface temperature recovery in
the Nam Co Lake region by 2020 based on relevant studies
Author Contributions
Xu, X. P., Zhang, Y., Ji, L. Y., Tang, H. R. made
the overall design for the development of the dataset. Zhang, Y., Ji, L. Y.
contributed to the data processing and analysis. Xu, X. P., Tang, H. R.
designed the models and algorithms. Zhang, Y., Ji, L. Y., and Zhang, Y. C. did
the data validation. Xu, X. P. wrote the data paper. Zhang, Y. C. embellished
the paper.
Conflicts of Interest
The
authors declare no conflicts of interest.
References
[1] Wang, A. H., Zeng, X. B. Development of global
hourly 0.5?? land surface air temperature datasets [J]. Journal of Climate, 2013, 26(19): 7676?C7691.
[2] Mostovoy, G. V., King, R. L., Reddy, K. R., et al. Statistical estimation of daily
maximum and minimum air temperatures from MODIS LST data over the state of
Mississippi [J]. GIScience & Remote Sensing, 2006, 43(1): 78?C110.
[3] Xu, Y. M., Qin, Z. H., Shen, Y. Study on the
estimation of near-surface air temperature from MODIS data by statistical
methods [J]. International Journal of
Remote Sensing, 2012, 33: 7629?C7643.
[4] Ng, M. K-P., Yuan, Q. Q., Yan, L., et al. An adaptive weighted tensor
completion method for the recovery of remote sensing images with missing data
[J]. IEEE Transactions on Geoscience and
Remote Sensing, 2017, 55(6): 3367?C3381.
[5] Ji, T. Y., Yokoya, N., Zhu, X. X., et al. Nonlocal tensor completion for
multitemporal remotely sensed images?? inpainting [J]. IEEE Transactions on Geoscience and Remote Sensing, 2018, 56(6):
3047?C3061.
[6] Chen, Y., He, W., Yokoya, N., et al. Blind cloud and cloud shadow
removal of multitemporal images based on total variation regularized low-rank
sparsity decomposition [J]. ISPRS Journal
of Photogrammetry and Remote Sensing, 2019, 157: 93?C107.
[7] Lin, J., Huang, T. Z., Zhao, X. L., et al. Robust thick cloud removal for
multitemporal remote sensing images using coupled tensor factorization [J]. IEEE Transactions on Geoscience and Remote
Sensing, 2022, 60: 1?C16.
[8] Chen, Z. H., Zhang, P., Zhang, Y., et al. Thick cloud removal in
multi-temporal remote sensing images via frequency spectrum-modulated tensor
completion [J]. Remote Sensing, 2023,
15(5): 1230.
[9] Zhang, Y. L., Li, B. Y., Liu, L. S., et al. Redetermine the region and
boundaries of Tibetan Plateau [J]. Geographical
Research, 2021, 40(6): 1543?C1553.
[10] Xu, X. P.,
Zhang, Y., Ji L.Y., et al. 1-km/Daily
land surface temperature optimized dataset for the Qinghai-Tibet Plateau based
on MODIS data (2000?C2020) [J/DB/OL]. Digital
Journal of Global Change Data Repository, 2023. https://doi.org/10.3974/geodb.2023.10.02.V1.
https://cstr.escience.org.cn/CSTR:
20146.11.2023.10.02.V1.
[11] GCdataPR Editorial Office. GCdataPR data sharing policy
[OL]. https://doi.org/10.3974/dp.policy.2014.05 (Updated 2017).
[12] Zhang, Z., M. Landsat surface temperature products over
the Tibetan Plateau (2020) [Z]. National Tibetan Plateau / Third Pole
Environment Data Center, 2022. DOI: 10.11888/Terre.tpdc.272304.
[13] Wang, M. M., Zhang, Z. J., Hu, T., et al. A practical single-channel algorithm for land surface
temperature retrieval: application to Landsat series data [J]. Journal of Geophysical Research: Atmospheres,
2019, 124: 299?C316.
[14] Cheng, J., Dong, S. Y., Shi, J. C. 1km seamless land
surface temperature dataset of China (2002?C2020) [Z]. National Tibetan
Plateau/Third Pole Environment Data Center, 2021, DOI:
10.11888/Meteoro.tpdc.271657.
[15] Xu, S., Cheng, J. A new land surface temperature fusion
strategy based on cumulative distribution function matching and multiresolution
Kalman filtering [J]. Remote Sensing of
Environment, 2021, 254: 112256.
[16] Zhang, Q., Wang, N. L., Cheng, J., et al. A stepwise downscaling method for generating
high-resolution land surface temperature from AMSR-E data [J]. IEEE Journal of Selected Topics in Applied
Earth Observations and Remote Sensing, 2020, 13: 5669?C5681.
[17] Zhang, Q., Cheng, J. An empirical algorithm for
retrieving land surface temperature From AMSR-E data considering the
comprehensive effects of environmental variables [J]. Earth and Space Science, 2020, 7: e2019EA001006.