Development of a 250-m Grid Dataset for Travel Resilience
Spatial Differentiation within the Sixth Ring Road of Beijing (2020)
Fan, W. Y.1, 2 Huang, J.1, 2 Wang, J. E.1, 2*
1. Institute of Geographic Sciences and Natural Resources
Research & Key Laboratory of Regional Sustainable Development Modeling,
Chinese Academy of Sciences, Beijing 100101, China;
2. College of Resources and Environment, University of
Chinese Academy of Sciences, Beijing 100049, China
Abstract: Travel resilience
refers to the process of restoring residents?? travel to the original state of
balance between supply and demand or establishing a new equilibrium state after
experiencing negative disturbances. It characterizes the interactions between
residents?? travel, disturbances, urban space, and transportation systems in
terms of process, continuity, and dynamics. The key measurement of travel
resilience lies in the ability of transportation demand to recover to
pre-disturbance levels or achieve a stable state during long-term coupling with
a disturbance. Using the K-means clustering method and cell phone signaling
data from Beijing between February and September 2020, the authors calculated a
spatial differentiation dataset of travel resilience within Beijing??s Sixth
Ring Road. The dataset includes (1) cluster factors and resulting data in
points, including the unique identification ID for each 250 m grid (GID),
travel recovery speed (25rate) and magnitude (29rate) under the epidemic
disturbance, clustering results indicating travel toughness (Kmeans_clu), and
(2) kernel density values with 250-m resolution. This dataset was archived in a
previous study. shp and .tif formats and consists of 47 data files with a data
size of 5.32 MB (compressed to one file of 1.01 MB).
Keywords: travel; COVID-19
pandemic; mobile signaling data; resilience; clustering analysis
DOI: https://doi.org/10.3974/geodp.2023.04.07
CSTR: https://cstr.escience.org.cn/CSTR:20146.14.2023.04.07
Dataset Availability Statement:
The dataset supporting this paper was published and is accessible through
the Digital Journal of Global Change Data Repository at: https://doi.org/10.3974/geodb.2023.10.04.V1 or
https://cstr.escience.org.cn/CSTR:20146.11.2023.10.04.V1.
1 Introduction
Resilience
is a critical attribute that reflects the capacity of a system to recover, and
has been widely discussed and used in various disciplines such as ecology,
psychology, economics, and engineering[1?C4]. In geographical
research, the concept of resilience has been applied to analyze the dynamic
adaptive capacity of regions for disaster prevention, mitigation, and
preparedness[5,6], the self-adaptive processes of trade networks
during negative disturbances such as financial crises and economic recessions[7?C9],
the recovery, transformation, and renewal of regional economies under external
shocks[10?C13], and the dynamic equilibrium and anti-interference
capabilities of urban systems[14?C18]. Overall, resilience is an
important indicator of sustainable development in complex systems, representing
the ability to adapt to disturbances and maintain functionality with dynamic
and phased characteristics.
The application of the concept of resilience in the context of
transportation systems helps deepen our understanding of the robustness and
reliability of transportation networks, thereby
promoting the modernization and high-quality development of transportation
systems. However, existing studies on transportation resilience have mainly
focused on the resilience of infrastructure supply networks[19?C22],
with limited discussion on the resilience of transportation demand, that is,
the recovery and adaptation of residents?? travel during disturbances.
Therefore, this study analyzed the changes in residents?? travel within the
Sixth Ring Road of Beijing during the initial period of the COVID-19 pandemic
using continuous mobile signaling data collected over eight months. By
establishing a conceptual framework for travel resilience, proposing
measurement methods, and considering the impact of the pandemic, this study
summarizes the patterns of travel resilience and four resilience models in Beijing. This study contributes to enriching
the understanding of resilience, complementing transportation resilience
theory from the demand side, and providing insights into the sustainable
development of transportation systems.
2 Metadata of the Dataset
The
metadata of the Dataset of Travel resilience spatial differentiation within the
Sixth Ring Road of Beijing city of China (2020)[23] is summarized in
Table 1. This includes the full name, short name, authors, year of the dataset,
temporal resolution, spatial resolution, data format, data size, data files,
data publisher, and data-sharing policy, etc.
3 Methods
This
dataset consists of 250 m grid covering the area within the Sixth Ring Road
of Beijing. The data used in this dataset include the following:
1.
Grid-to-grid travel data based on China Unicom mobile signaling data, sourced
from Wisdom Footprints Company.
2.
Boundary data of the Sixth Ring Road of Beijing, sourced from the Chinese
Academy of Sciences Resource and Environmental Science and Data Center.
3.1 Algorithm
In unsupervised learning
algorithms, K-means clustering is widely applied, is relatively mature, and highly operational. Furthermore,
K-means clustering allows specification of the number of clusters in the clustering result. Therefore, this study
selected the K-means algorithm
Table 1 Metadata
summary of the Dataset of travel resilience spatial differentiation within the
Sixth Ring Road of Beijing city of China (2020)
|
Items
|
Description
|
|
Dataset full name
|
Dataset of travel
resilience spatial differentiation within the Sixth Ring Road of Beijing city
of China (2020)
|
|
Dataset short
name
|
TravelResilienceBeijing2020
|
|
Authors
|
Fan, W. Y.
JFJ-3237-2023, Institute of Geographic Sciences and Natural Resources
Research, fanwenying21@mails.ucas.ac.cn
Huang, J.
CVH-4108-2022, Institute of Geographic Sciences and Natural Resources
Research, huangjie@igsnrr.ac.cn
|
|
|
Wang, J. E.
AAD-5237-2020, Institute of Geographic Sciences and Natural Resources
Research, wangje@igsnrr.ac.cn
|
|
Geographical
region
|
Within the Sixth
Ring Road of Beijing city
|
|
Year
|
2020
|
|
Temporal
resolution
|
Monthly
|
|
Spatial
resolution
|
250 m
|
|
Data format
|
.shp, .tif
|
|
|
|
Data size
|
1.01 MB (after
compression)
|
|
|
|
Data files
|
Travel resilience
pattern 250-m grid vector data
|
|
Foundations
|
National Natural
Science Foundation of China (42121001); Youth Innovation Promotion
Association of Chinese Academy of Sciences (2021049)
|
|
Data publisher
|
Global Change Research Data Publishing & Repository,
http://www.geodoi.ac.cn
|
|
Address
|
No. 11A, Datun
Road, Chaoyang District, Beijing 100101, China
|
|
Data sharing
policy
|
(1) Data
are openly available and can be free downloaded via the Internet; (2) End
users are encouraged to use Data subject to citation; (3)
Users, who are by definition also value-added service providers, are welcome
to redistribute Data subject to written permission from the GCdataPR Editorial
Office and the issuance of a Data redistribution license; and (4)
If Data
are used to compile new datasets, the ??ten per cent principal?? should be
followed such that Data records utilized should not
surpass 10% of the new dataset contents, while sources should be clearly
noted in suitable places in the new dataset[24]
|
|
Communication and
searchable system
|
DOI, CSTR, Crossref, DCI, CSCD,
CNKI, SciEngine, WDS/ISC, GEOSS
|
for
the unsupervised classification of travel resilience zones.
The K-means
clustering algorithm partitions data into a predefined number of clusters (k) by
minimizing the error function using distance as the similarity measure. It
assumes that two objects are more similar if their distances are smaller. Here,
??distance?? does not necessarily refer to the physical distance in the entity
space but rather the distance in the coordinate space, with its actual meaning
determined by the data content.
The primary steps
of the K-means clustering algorithm are as follows:
(1) Randomly select
k initial cluster centers from n sample data points.
(2) Calculate the
distance of each sample from each cluster center and assign the sample to the
cluster with the closest distance.
(3) Once all the
samples were assigned, the centers of the k clusters were recalculated.
(4) The newly
calculated centers were compared with previous centers. If the center of any
cluster has changed, return to step (2); otherwise, proceed to step (5).
(5) The algorithm
terminates and outputs the clustering results.
The core of
executing the K-means clustering algorithm is to minimize the sum of squarederrors
(SSE) for the given dataset  , with respect to the cluster partition
  obtained by
clustering. The formula for calculating the SSE is as follows:
obtained by
clustering. The formula for calculating the SSE is as follows:
 (1)
(1)
where  is the number of
clusters,
is the number of
clusters,  represents the
  -th cluster,
  is a sample and
  is the centroid
of cluster .
is the centroid
of cluster .
3.2 Data Processing
The
data processing is as follows:
(1) Collection of administrative
boundaries and ring road boundary data for Beijing.
(2) The mobile
signaling data are cleaned by removing trips outside the Sixth Ring Road and
constructing an origin?Cdestination (OD) matrix for trips within the Sixth Ring
Road.
(3) Calculate travel recovery indicators,
including ??recovery speed?? and ??change magnitude,??
using MATLAB.
Specifically,
??recovery speed?? is calculated according to the following formula:
 (2)
(2)
where
 represents the
average recovery speed of trips from month
represents the
average recovery speed of trips from month  to month
  , and
, and  represents the
total number of trips in month .
represents the
total number of trips in month .
The change in
magnitude" is calculated using the following formula:
 (3)
(3)
|

Figure 1 Dataset development technology roadmap
|
where
 represents the
overall change in the number of trips from
the start of the disturbance to the period of overall stability. Ps
denotes the total number of trips
in stable month and P0 represents that in the initial month.
represents the
overall change in the number of trips from
the start of the disturbance to the period of overall stability. Ps
denotes the total number of trips
in stable month and P0 represents that in the initial month.
(4) Use travel
recovery indicators to perform k-means clustering on the grid data, resulting
in travel resilience spatial differentiation data.
(5) Conduct a
kernel density analysis of the clustering results to identify spatial patterns
of travel resilience.
4 Data Results and Validation
4.1 Data Composition
The
dataset for the spatial differentiation of travel resilience within the Sixth
Ring Road of Beijing (2020) includes 47 data files: (1) resilient spatial
distribution in four categories, archived in a point feature format (.shp), and
(2) kernel density analysis results stored in. tif format. The attribute table
includes the following: (1) unique identifier (GID) for each 250-m grid; (2)
??Recovery Rate?? (25rate) and ??Magnitude of Change?? (29rate) for travel recovery
under epidemic disruption; (3) spatial pattern of travel resilience, i.e.,
clustering results for grid cells, divided into four categories represented by
the numbers 0?C3, wherein the magnitude of the number is arbitrary and only
serves to differentiate categories (field name: kmeans_clu). The values in the
raster files represent the kernel density within each cluster type for four
raster files.
4.2 Data Products
According
to calculations based on mobile signaling data from February to September 2020,
within the Sixth Ring Road in Beijing, the lowest total travel volume occurred
in February, with 4.339 million trips.
Conversely, the highest total travel volume was observed in September, with
20.008 million trips. The average travel distance ranged from 7.74 km to
8.49 km, and this distance distribution remained relatively stable across
different travel volumes.
Based on the
overall magnitude of change and recovery rate of travel volume, Beijing??s
travel resilience can be categorized into four types:
Type I: Small
change in travel volume and slow recovery rate.
Type II: Small
change in travel volume and fast recovery rate.
Type III: Large
change in travel volume and slow recovery rate.
Type IV: Large
change in travel volume and fast recovery rate.
The dataset
results revealed that Type III was the most prevalent type, accounting for
36.1% of the spatial distribution, whereas Type I was the least common,
representing only 9.6%.
Table
2 The
proportions of the four resilience regions
|
Types
|
Labels
|
Disturbance magnitude
|
Recovery speed
|
Proportions (%)
|
|
Type I
|
0
|
Little
|
Slow
|
9.6
|
|
Type II
|
1
|
Little
|
Quick
|
19.8
|
|
Type III
|
2
|
Large
|
Slow
|
36.1
|
|
Type IV
|
3
|
Large
|
Quick
|
34.5
|
The spatial
distribution of the four resilience areas on the map of the Beijing City Ring
Road, along with kernel density analysis, provides an intuitive view of the
differences and basic characteristics of these four resilience areas (Figure 2)[25].
Type I: Areas with small changes in travel and slow recovery were localized in
the southern and eastern regions between the Fifth and Sixth Ring Roads. These
areas are predominantly green spaces and parks. Type II: Areas with small
changes in travel but fast recovery were mainly clustered in the eastern region
between the fifth- and sixth-ring roads. These areas are characterized by
residential communities with abundant amenities such as schools, shopping
malls, and office buildings. Type III: Areas with large changes in travel and
slow recovery are concentrated within the Fourth Ring Road and extend outward
along the radial transportation lines. Additionally, areas near the Beijing
Capital International Airport were categorized as Type III resilience areas.
Type IV: Areas with large changes in travel but fast recovery are primarily
clustered around large employment centers, such as Zhongguancun, Shangdi, and
the Central Business District (CBD). The distance from the city center did not
significantly affect the distribution of these areas.
The spatial
characteristics of the combination patterns of resilience zones are as follows:
Within the Fourth
Ring Road, the line of the northern of the area connecting the Yuegezhuang
Bridge and Siyuan Bridge primarily comprises the third (large changes, slow
recovery) and fourth resilience zones (large changes, fast recovery). In the
southern part of this region, there is a mixture of the Third Resilience Zone
(large changes, slow recovery), Fourth Resilience Zone (large changes, fast
recovery), and Second Resilience Zone (small changes, fast recovery), with some
localized concentrations of the Second Resilience Zone, which often corresponds
to areas with more parks and green spaces.
In the Tongzhou
area, the second (small changes, fast recovery) and third resilience zones
(large changes, slow recovery) predominated, with very few instances of the
Fourth Resilience Zone (large changes, fast recovery).
In areas where manufacturing factories are
concentrated in the south, the Fourth Resilience Zone (large changes and fast
recovery) is accompanied by the distribution of the Second Resilience Zone
(small changes and fast recovery). By contrast, in areas where the information
industry is concentrated in the north, the Fourth Resilience Zone (large
changes, fast recovery) is accompanied by a Third Resilience Zone (large
changes, slow recovery).
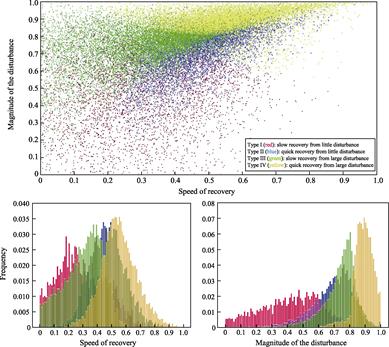
Figure 2 The clustering results for
travel resilience
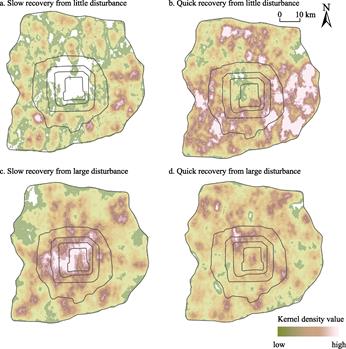
Figure 3
Maps of the kernel density analysis results for the spatial
differentiation of travel resilience in Beijing
The First
Resilience Zone (small changes, slow recovery) was often adjacent to the Second
Resilience Zone (small changes, fast recovery) and was primarily distributed
between the Fifth and Sixth Ring Roads.
5 Discussion and Conclusion
This
study introduces a method for measuring travel resilience and calculates its
characteristic indicators of travel resilience for Beijing based on continuous
8 months of mobile signaling data. It combines unsupervised machine learning
and kernel density analysis to analyze the spatial patterns of travel
resilience, providing insights and references for research related to travel resilience.
Furthermore, based
on the spatial distribution characteristics and differences in travel
resilience, this study discusses the practical significance of the four
resilience zones.
(1) First
Resilience Zone (small changes, slow recovery): this zone is primarily located
outside the Fourth Ring Road and has relatively low travel volumes. After
sudden events, there was little overall change in the travel volume in these
areas. This suggests that people's activities in these areas are less spatially
affected. However, recovery is slow, indicating that the relationship between
people and space is stable, but not tightly connected. The land use functions
in this zone are not highly important to residents' lives, and their functional
influence has limited reach.
(2) Second
Resilience Zone (small changes, fast recovery): predominantly found in the
eastern and southern parts, with fewer occurrences within the Fourth Ring Road
than outside. These areas had lower travel volumes. This resilience zone is
characterized by stable functionality, minimal impact of sudden events, and a
strong and stable connection between people and space. Residents?? lives depend
on the physical spaces in these areas.
(3) Third
Resilience Zone (large changes, slow recovery): concentrated within the Fourth
Ring Road and extending outward along radial transport routes, similar to the
distribution pattern observed in September with high travel volumes. This
resilience zone is significantly affected by sudden events and requires longer
to reach a new stable state. Therefore, it directly reflects the overall
recovery of a city and should be the focus of urban management monitoring.
(4) Fourth
Resilience Zone (large changes, fast recovery): concentrated in areas between
the North Fifth Ring Road and North Third Ring Road, between the East Fourth
Ring Road and East Fifth Ring Road, and outside the Fifth Ring Road. This zone
includes research institutions, residential areas, wholesale markets, and
factories. These areas can be managed efficiently and exhibit significant
changes but with quick recovery. The differences in recovery speed depend on
the management decisions.
The division of resilience zones in this study was based on clustering
results, using recovery speed and change magnitude as indicators. Unsupervised
machine learning methods do not require specific
predefined values for resilience, allowing for multiple interpretations of
results based on a specific urban context. However, there are commonalities,
with resilience zones reflecting different
patterns of interaction between people and spaces in the city, providing a new
perspective for understanding urban dynamics.
Author Contributions
Fan,
W. Y. designed the algorithms, contributed to data processing and analysis, and
drafted the data paper. Huang, J. collected mobile signaling data and reviewed,
guided, edited, and improved the data. Wang, J. E. reviewed and guided the data
processing and paper writing.
Conflicts of Interest
The
authors declare no conflicts of interest.
References
[1]
Holling, C. S. Resilience and
stability of ecological systems [J]. Annual Review of Ecology and
Systematics, 1973,
4: 1?C23.
[2]
Bonanno, G. A. Loss, trauma,
and human resilience: Have we underestimated the human capacity to thrive after
extremely aversive events? [J]. The American Psychologist, 2004, 59(1):
20?C28.
[3]
Olsson, L., Jerneck, A.,
Thoren, H., et al. Why resilience is
unappealing to social science: Theoretical and empirical investigations of the
scientific use of resilience [J]. Science Advances, 2015, 1(4):
e1400217.
[4]
Perrings, C. Resilience and
sustainable development [J]. Environment and Development Economics,
2006, 11(4): 417?C427.
[5]
Zhou, K., Liu, B. Y., Fan, J.
Economic resilience and recovery efficiency in the severely affected area of Ms
8.0 Wenchuan earthquake [J]. Acta Geographica Sinica, 2019, 74(10):
2078?C2091.
[6]
Wei, S. M., Pan, J. H. Network
structure resilience of cities at the prefecture level and above in China [J]. Acta
Geographica Sinica, 2021,
76(6): 1394?C1407.
[7]
Wang,
W. Y., Ren, Z. R., Li, W., et al. Trade barriers, market related variety and export resilience of
cities [J]. Geographical Research, 2021, 40(12): 3287?C3301.
[8]
Zong, H. M., Zhang, J. M., Liu,
H. M. Spatial pattern and influencing factors of China??s foreign trade
resilience under the COVID-19 pandemic [J]. Geographical Research, 2021,
40(12): 3349?C3363.
[9]
Yu, G. J., He, C. F., Zhu, S.
J. Industrial cluster resilience: technological innovation, relational
governance, and market diversification [J]. Geographical Research, 2020,
39(6): 1343?C1356.
[10]
Sun, J. W., Sun, X. Y. Research
progress of regional economic resilience and exploration of its application in
China [J]. Economic Geography,
2017, 37(10): 1?C9.
[11]
Tan,
J. T., Zhao, H. B., Liu, W. X., et al.
Regional economic resilience and influential mechanism
during economic crises in China [J]. Scientia Geographica Sinica, 2020,
40(2): 173?C181.
[12]
Chen, M. Y. An international
literature review of regional economic resilience: theories and practices based
on the evolutionary perspective [J]. Progress in Geography, 2017,
36(11): 1435?C1444.
[13]
Hu, X. H., Dong, K., Yang, Y.
An analytical framework on regional economic resilience from the perspective of
evolutionary strategic coupling [J]. Geographical Research, 2021,
40(12): 3272?C3286.
[14]
Yang,
X. P., Wang, L. K., Li, Y. B., et al.
Review and prospects of resilient city theory [J]. Geography
and Geo-Information Science, 2021, 37(6): 78?C84.
[15]
Huang, X. J., Huang, X.
Resilient city and its planning framework [J]. City Planning Review,
2015, 39(2): 50?C56.
[16]
Qian,
S. H., Xu, G. Q., Shen, Y., et al. An exploration about the path toward a resilient city for Shanghai [J].
Urban Planning Forum, 2017(S1): 109?C118.
[17]
Wang,
H., Ren, Y. L., Lu, S. Q., et al. Urban resilience under the guidance of ecological wisdom to deal
with the threat and occurrence of flood disasters [J]. Acta Ecologica Sinica, 2016, 36(16): 4958?C4960.
[18]
Sun, H. H., Zhen, F. Evaluation
of urban haze disaster resilience from the perspective of residents?? activity: a
case study of the main urban area of Nanjing city [J]. Scientia Geographica
Sinica, 2019, 39(5): 788?C796.
[19]
Chen, Y., Wang, J. E., Jin, F.
J. Robustness of China??s air transport network from 1975 to 2017 [J]. Physica
A: Statistical Mechanics and
Its Applications, 2020, 539: 122876.
[20]
Chester, M., Underwood, B. S.,
Allenby, B., et al. Infrastructure
resilience to navigate increasingly uncertain and complex conditions in the
Anthropocene [J]. NPJ Urban Sustainability, 2021, 1: 4.
[21]
Hayes,
S., Desha, C., Burke, M., et al. Leveraging socio-ecological resilience theory to build climate
resilience in transport infrastructure [J]. Transport Reviews, 2019,
39(5): 677?C699.
[22]
Davoudi, S., Brooks, E.,
Mehmood, A. Evolutionary resilience and strategies for climate adaptation [J]. Planning
Practice and Research,
2013, 28(3): 307?C322.
[23]
Fan, W. Y., Huang, J., Wang, J.
E. Dataset of travel resilience spatial differentiation within the Sixth Ring
Road of Beijing city of China (2020) [J/DB/OL]. Digital Journal of Global Change Data Repository, 2023.
https://doi.org/10.3974/geodb.2023.10.04.V1. https://cstr.escience.org.cn/CSTR:20146.11.2023.10.04.V1.
[24]
GCdataPR Editorial Office.
GCdataPR data sharing policy [OL]. https://doi.org/10.3974/dp.policy.2014.05
(Updated 2017).
[25]
Huang, J., Wang, J. E. Theory,
method, and empirical studies of travel behavior resilience [J]. Acta
Geographica Sinica, 2023, 78(10): 2507?C2519.