MODIS Global Leaf Area Index Product Reproces- sing Dataset (2001?C2021)
Liu, L.1 Zhang, Y. H.2* Hu, Z. W.2 Gao,
X.3 Wang, J. Z.4 Wu, G. F.2
1.
Guangdong Polytechnic of Industry & Commerce, Guangzhou 510510, China;
2. MNR Key
Laboratory for Geo-Environmental Monitoring of Great Bay Area, Shenzhen
University, Shenzhen 518060, China;
3. LREIS,
Institute of Geographic Sciences and Natural Resources Research, Chinese
Academy of Sciences, Beijing 100101, China
4. School
of Artificial Intelligence, Shenzhen Polytechnic, Shenzhen 518055, China
Abstract: Global
leaf area index (LAI) products provide important basic information for global
climate change, carbon cycle, and sustainable development studies. In this
study, based on MODIS LAI products, we designed a method to optimize current
data. The results from the main algorithm with the maximum fraction of absorbed
photosynthetically active radiation in a day were selected as high-quality
results. A spatiotemporal filtering method that considers outliers and vegetation
types was proposed to further modify the LAI data. Finally, a spatiotemporal
continuous LAI dataset with high quality was produced. The data products
revealed the distribution pattern of global LAI and elucidated its spatial and
temporal variation characteristics under climate change from 2001 to 2021.
Comparative analysis and validation of the results based on 280 validation
points from the global LAI validation network showed that the reprocessed
dataset had high product accuracy with a coefficient of determination (R2) of 0.748, a bias of 0.12,
and a root mean square error (RMSE) of 0.907. The dataset has a spatial
resolution of 0.05?? and a temporal resolution of 8 days and is archived in .tif
format consisting of 1,239 files with a data size of 29.9 GB.
Keywords: MODIS; leaf
area index; global change; spatial-temporal
DOI: https://doi.org/10.3974/geodp.2023.03.02
CSTR: https://cstr.escience.org.cn/CSTR:20146.14.2023.03.02
Dataset Availability Statement:
The dataset supporting this paper was published and is accessible through
the Digital Journal of Global Change Data
Repository at: https://doi.org/10.3974/geodb.2023.10.03.V1 or
https://cstr.escience.org.cn/CSTR:20146.11.2023.10.03.V1.
1 Introduction
The
leaf area index (LAI) characterizes the sparseness of vegetation foliage and
was first defined as the total surface area of one-sided foliage per unit
surface area[1]. However, this definition is not applicable to
vegetation with non-flat leaf surfaces such as coniferous vegetation. Chen and
Black defined the LAI as the sum divided by two the surface area of green
leaves per unit surface area[2]. In remote sensing, what is actually
observed is half of the total surface area of the aboveground portion of green
plants per unit area (plant area index, PAI), but it is still customarily
referred to as the LAI[3]. It is a critical variable in processes
such as photosynthesis, respiration, and precipitation interception[2, 3].
As a fundamental attribute of global vegetation, LAI has been listed as an
essential climate variable by the global climate change research community[4].
Several global
LAI products have been produced using satellite remote sensing data, including GLASS[5], GEOV2[6],
and MODIS LAI[7]. Based on LAI products, spatiotemporal
changes in global vegetation have been revealed[8], and global
terrestrial ecosystem productivity products have been produced to support
global carbon cycle studies and SDG assessments[9]. MODIS LAI
products, as benchmark products, are the most widely used in global change
studies. However, ground validation has shown that MODIS LAI products have
larger uncertainties with significant anomalous fluctuations[10, 11].
The optimization of MODIS LAI products has been a concern for the scientific
community. Yuan[12] and Wang
et al.[13]
proposed algorithms for optimizing MODIS LAI products. However, current algorithms
rely on a priori filtering methods, and a priori knowledge is often influenced
by the region and vegetation type, leading to over-optimization or
under-fitting, causing incorrect vegetation changes, and impacting phenology
extraction. The fraction of absorbed photosyn- thetically active radiation
(FAPAR) is a companion variable for the MODIS LAI products[14].
Studies have shown that the inversion results of the LAI corresponding to the
maximum FAPAR have high accuracy[15], providing quality criteria for
further optimization of the MODIS LAI. Therefore, based on the two LAI/FAPAR
results in one day, using the maximum FAPAR synthesis method and further
conducting spatiotemporal filtering considering the vegetation types is an
effective method for improving the data quality of MODIS LAI products. Finally
this dataset utilizes two sets of MODIS LAI products, adopts the maximum FAPAR
synthesis method for product fusion, considers the vegetation type to realize
spatiotemporal filtering, and finally obtains the global LAI product with a
spatial resolution of 0.05?? and a temporal resolution of 8-day from 2001 to 2021.
2 Metadata of the Dataset
The
metadata of the MODIS
global lai product reprocessing dataset (2001?C2021)[16] are summarized in Table 1. This includes details such as the full
name, short name, authors, year of the dataset, temporal resolution, spatial
resolution, data format, data size, data files, data publisher, and
data-sharing policy, etc.
3 Methods
3.1 Data Sources
The production of these data relied on two MODIS LAI datasets, MOD15A2H
and MYD15A2H, along with a land-cover product (MCD12Q1). The MODIS LAI products
have a spatial resolution of 500 m and temporal
resolution of 8 days. The inversion algorithm consists of a main and
backup algorithm. The main algorithm utilized a lookup table
Table 1 Metadata
summary of the MODIS global leaf area index product reprocessing dataset (2001-2021)
|
Items
|
Description
|
|
Dataset full name
|
MODIS global leaf
area index product reprocessing dataset (2001-2021)
|
|
Dataset short
name
|
SZU_ LAI
|
|
Authors
|
Liu, L. IVV-8131-2023, Guangdong Polytechnic of Industry & Commerce, llrain_li@126.com
Zhang, Y. H. GYR-3820-2022,
MNR Key Laboratory for Geo-Environmental Monitoring of Great Bay Area,
Shenzhen University, zyhui@szu.edu.cn
Hu, Z. W. AAX-7567-2021,
MNR Key Laboratory for Geo-Environmental Monitoring of Great Bay Area,
Shenzhen University, zwhoo@szu.edu.cn
Gao, X. CPW-9851-2022, LREIS, Institute of Geographic Sciences and Natural Resources
Research, Chinese Academy of Sciences, gxing@igsnrr.ac.cn
Wang, J. Z. Q-4555-2019,
School of Artificial Intelligence, Shenzhen Polytechnic, jzwang@szpt.edu.cn
Wu, G. F. B-8735-2018,
MNR Key Laboratory for Geo-Environmental Monitoring of Great Bay Area,
Shenzhen University, guofeng.wu@szu.edu.cn
|
|
Geographical
region
|
Global
|
|
Year
|
2001-2021
|
|
Temporal
resolution
|
8-day, month, year
|
|
Spatial
resolution
|
0.05??
|
|
Data format
|
.tif
|
|
|
|
Data size
|
29.9 GB
|
|
|
|
Data files
|
Leaf Area Index
(LAI) dataset file, containing 8-day resolution data, monthly average and
annual average data. MODIS_YYYYDOY_LAI.tif is the 8-day resolution leaf area
index data, YYYY represents the year, DOY represents the Julian day, e.g., MODIS_2003009_LAI.tif
is the leaf area index data of the 9th day of 2003; MODIS_YYYYMM_LAI.tif is
the monthly average leaf area index data, YYYY represents the year, MM
represents the month, e.g., MODIS_200301_LAI.tif is the average leaf area
index data of January 2003 of January 2003; MODIS_YYYYY_LAI.tif is the annual
average leaf area index data, YYYY represents the year, e.g.,
MODIS_2003_LAI.tif is the average leaf area index data of 2003
|
|
Foundations
|
National Natural
Science Foundation of China (42201347); China Postdoctoral Science Foundation
(2022M712163); Guangdong Province (2021A1515110910, 2023A1515011273); Chinese
Academy of Sciences (XDA23090503); Shenzhen (JCYJ20220818101617037,
20220811173316001)
|
|
Data publisher
|
Global Change Research Data Publishing & Repository,
http://www.geodoi.ac.cn
|
|
Address
|
No. 11A, Datun
Road, Chaoyang District, Beijing 100101, China
|
|
Data
sharing policy
|
(1) Data are openly available and can be free downloaded via the
Internet; (2) End users are encouraged to use Data subject to
citation; (3) Users, who are by definition also value-added service
providers, are welcome to redistribute Data subject to written permission
from the GCdataPR Editorial Office and the issuance of a Data redistribution
license; and (4) If Data are used to compile new
datasets, the ??ten per cent principal?? should be followed such that Data
records utilized should not surpass 10% of the new dataset contents, while
sources should be clearly noted in suitable places in the new dataset[17]
|
|
Communication and
searchable system
|
DOI, CSTR, Crossref, DCI, CSCD, CNKI,
SciEngine, WDS/ISC, GEOSS
|
constructed from a three-dimensional (3D)
radiative transfer model to invert the LAI. It uses atmospherically corrected
MODIS reflectance and vegetation type data as inputs. The vegetation type data
served as prior information to constrain the structural parameters of the
vegetation, enabling the construction of different look-up tables. The valid
land-cover types were as follows: (1) grass/cereal crops, (2) shrubs, (3)
broadleaf crops, (4) savanna, (5) evergreen broadleaf forest, (6) deciduous
broadleaf forest, (7) evergreen coniferous forest, and (8) deciduous coniferous
forest. If the main algorithm failed, a backup algorithm was employed. The
backup algorithm utilized the empirical relationship between the LAI and
normalized difference vegetation index (NDVI) of a specific vegetation type to
invert the LAI.
The MODIS LAI product provides quality
control information (QC) that indicates the quality of the LAI inversion. It
includes information regarding the algorithm used for LAI inversion and whether
it is affected by cloud or snow contamination. Images marked as clouds, snow,
shadows, and cirrus were considered invalid and excluded from the dataset.
3.2 Algorithm
(1)
Screening for high-quality LAI
1) Filtering the
main algorithm inversion results: MODIS provides two sets of products: MOD15A2H
and MYD15A2H. The quality layer of the products identifies the main algorithm
inversion results, main algorithm inversion saturation results, use of
alternate algorithms owing to the observation geometry, and other factors that
lead to alternate algorithms. The main algorithm inversion results are thought
to be of higher quality, and those of the two sets of products are first selected
as candidate high-quality inversion values.
2) Filtering LAI
value based on maximum FAPAR: When the LAI was retrieved, the FAPAR was output
simultaneously, and the maximum FAPAR value was selected as the value in the
8-day synthesis process. The FAPAR and LAI synthesis analyses showed that lower
FAPAR inversion values corresponded to lower inversion quality. In summary, we
chose the LAI corresponding to the maximum FAPAR as the optimal inversion
result for the main algorithm.
(2)
Improvement in LAI temporal continuity
Temporal continuity
processing was applied to address anomalous fluctuations in MODIS data. This
study employed a 5-phase time period: LAIt-2, LAIt-1, LAIt,
LAIt+1, and LAIt+2. The following steps outline the
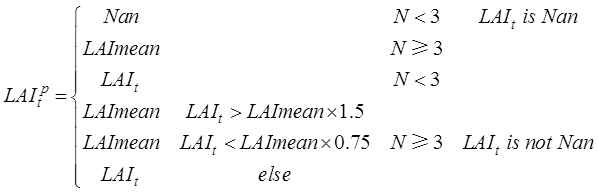
specific process (Equation 1):
1) If LAIt
is an invalid value and the number of valid values in LAIt-2, ??, LAIt+2
is less than three, LAIt remains as the invalid value.
2) If LAIt
is an invalid value and the number of valid values in LAIt-2, LAIt+2
is three or four, then LAIt is replaced by the average of the valid
values.
3) If LAIt
is a valid value and the number of valid values within LAIt-2, ??,
LAIt+2 is three and four, then an abnormally high or low value is
determined as follows.
(a) If the LAIt
is greater than 1.5 times the average of the valid values, it is considered an
abnormally high value and replaced with the average of the valid values.
(b) If LAIt
is less than 0.75 times the average of the valid values, it is considered an
abnormally low value and replaced with the average of the valid values.
(c) In all other
cases, the original value is retained.
4) If LAIt
is a valid value and the number of valid values within LAIt-2, ??,
LAIt+2 is less than three, the original value is retained.
 (1)
(1)
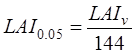
(3) Downscaling methods
To accommodate global-scale studies, the
dataset was downscaled to obtain data at a resolution of 0.05??. Existing
downscaling methods often use statistical methods, such as nearest neighbor
interpolation, and ignore the effects of non-vegetated pixels, such as water
bodies, bare ground, and built-up areas. In this study, we proposed a
downscaling method that considers the land cover type. We counted the number of
vegetation cover pixels (Nv) in 12??12 pixels under the 0.05?? grid and calculated
the vegetation LAI (LAIv) of the total vegetation pixels; then, the LAI under
the 0.05?? grid was calculated (Equation 2):
 (2)
(2)
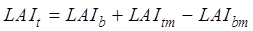
(4) Gap filling
We calculated a multi-year average of
downscaled products from 2001 to 2021 to obtain the annual 8-day baseline LAI
(LAIb) data. Invalid pixels were filled considering the variable
vegetation phenology in different years, assuming that the invalid pixels P and
the corresponding baseline LAI pixel is Pb,
1) If the number of valid
pixels around P is greater than four, the average valid values of 3??3 pixels around P are calculated
as LAItm and the average valid values of 3??3 pixels around Pb
are calculated as LAIbm. The invalid values of the P pixels are then
filled in, as (Equation 3):
 (3)
(3)
2) Otherwise, the inverse value obtained by
the MODIS backup algorithm is filled in.
3.3 Data Collection and Processing
The reprocessed LAI products
from 2001 to 2021 were generated using two MODIS LAI datasets: MOD15A2H and
MYD15A2H (Figure 1). The QA layer and maximum FAPAR synthesis method were
employed to select high-quality results from both sets of products.
Furthermore, using the five periods as sliding windows, the temporal
consistency processing algorithm (Equation 1) was used to
solve the abnormal fluctuations of the temporal sequence, which are common in
products, and to improve the quality of LAI products. Considering the
land-cover types, the high-quality vegetation LAI value averaging method (Equation 2) was used to produce data with a 0.05?? spatial resolution,
which is applicable to global change and earth system science research. Owing
to data gaps caused by clouds, many nan values still exist. Based on the
baseline leaf area data and considering the climatic changes, the nan values
were further interpolated (Equation 3) to improve the
spatial continuity of the product. Finally, a global spatiotemporal continuous
LAI product with a temporal resolution of 8 d and a spatial resolution of 0.05??
was generated for the period 2002?C2022. Monthly and annual average products
were also synthesized.
3.4 Validation
Ground-truth data were used
to validate the dataset. Data validation requires high-quality ground
references to validate the products[18]. The Committee on Earth
Observation Satellites (CEOS) initiated the formation of Land Product
Validation to construct the DIRECT V2.1 database[19]. This database
aggregates global LAI measurements with high- precision measurements conducted
according to the CEOS WGCV LPV LAI recommended method and upscaled to the 3
km??3 km range using high spatial resolution images to reduce the effect of
spatial heterogeneity. The DIRECT V2.1 database, with 176 stations worldwide
(seven vegetation types) and 280 LAI values covering the period 2000 to 2021,
has become the primary database for satellite LAI product validation (Figure
2).
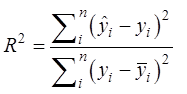
To verify the accuracy of the reprocessed dataset, this study
utilized correlation and error analyses. To check the correlation between the
ground truth data and product values, the coefficient of determination (R2) was calculated.
 (4)
(4)
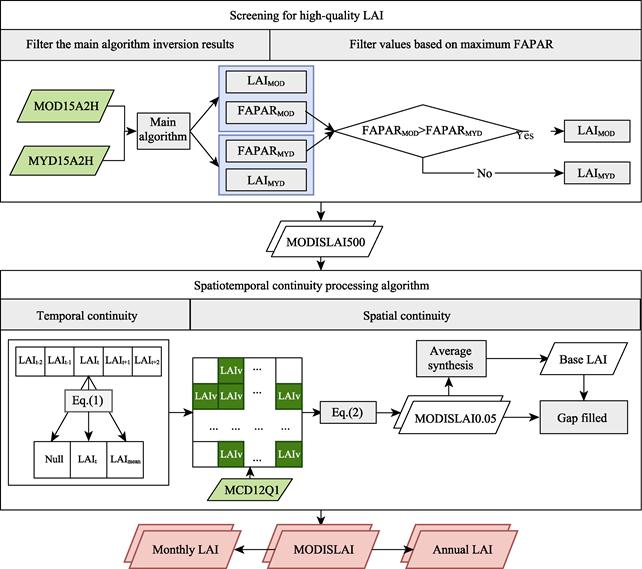
Figure 1 Flowchart of the dataset development
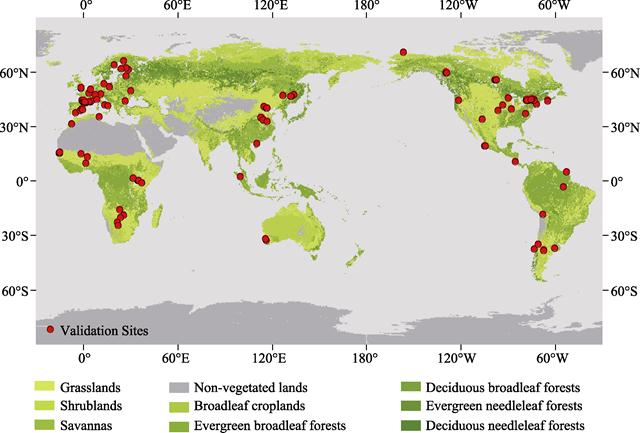
Figure
2 Map of the
distribution of validation sites
where,  represents
the ith sample value, the numerator represents the residuals predicted using
the predicted value (
represents
the ith sample value, the numerator represents the residuals predicted using
the predicted value ( ),
and the denominator represents the residuals obtained by predicting all data
using the sample mean (
),
and the denominator represents the residuals obtained by predicting all data
using the sample mean ( ).
A larger R2 value
indicates that the residuals of the model prediction results are smaller and
the prediction is more effective.
).
A larger R2 value
indicates that the residuals of the model prediction results are smaller and
the prediction is more effective.
The root mean square error (RMSE) and bias (bias) are
calculated for the dataset result error. The RMSE can be used as an important indicator
of the error between the true and predicted values, that is the smaller the
RMSE value and the smaller the absolute value of the bias value, the better the
validation result.
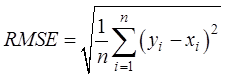 (5)
(5)
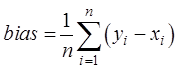 (6)
(6)
where n represents the number of validation sample points, y represents the value to be validated,
and x represents the true value.
4 Data Results and Validation
4.1 Data Composition
The
global long-time series MODIS LAI reprocessing dataset consists of 8-day, monthly,
and annual LAI datasets from 2001 to 2021. The dataset was saved in .tif format
with a scale factor of 0.1.
Table 2 Dataset information
|
Folder name
|
File
names
|
Data description
|
Data
format
|
Number
of data
|
Data
size
|
|
8-Day LAI
|
MODIS_YYYYDOY_LAI
|
LAI data file
for day DOY of year YYYY. The scale factor is 0.1 and the LAI value is the
like element value ´ 0.1
|
.tif
|
966
|
23.3 GB
|
|
Month
|
MODIS_YYYYMM_LAI
|
Mean LAI data
for month MM of year YYYY
|
.tif
|
256
|
6.08 GB
|
|
Year
|
MODIS_YYYY_LAI
|
Annual mean LAI
data of year YYYY
|
.tif
|
21
|
519 MB
|
4.2 Data Analysis
(1)
Spatial pattern
Figure 3 shows
the global distribution of the average LAI for January, April, July, and
October from 2001 to 2021. In January, a significant number of vacant values
were observed owing to ice coverage in the Arctic region. Throughout the year,
the Saharan Desert region in eastern Africa is devoid of LAI data. Conversely,
regions near the equator, such as the Amazon rainforest, Central Africa, and
Southeast Asia, exhibited consistently high LAI values close to seven in all
four months. In July, the Northern Hemisphere, specifically eastern North
America, central Eurasia, East Asia, and India, exhibited elevated LAI values.
(2) Temporal variation
The global LAI has exhibited an increasing trend from 2001 to 2021. Figure
4 illustrates this upward trajectory, with the average global and Northern
Hemisphere LAI consistently increasing over time. Conversely, the LAI in the
Southern Hemisphere remained stable after 2004 but experienced significant fluctuations
from 2016 to 2019.
Figure 5
shows the temporal variation of the mean LAI in the global, Northern, and Southern Hemispheres. The Southern Hemisphere consistently exhibits
higher LAI values throughout the year, ranging from 1.4 to 2.2, which are significantly
greater than the global average (0.6 to 1.7) and that of the Northern Hemisphere
(0.4 to 1.7). In the Southern Hemisphere,
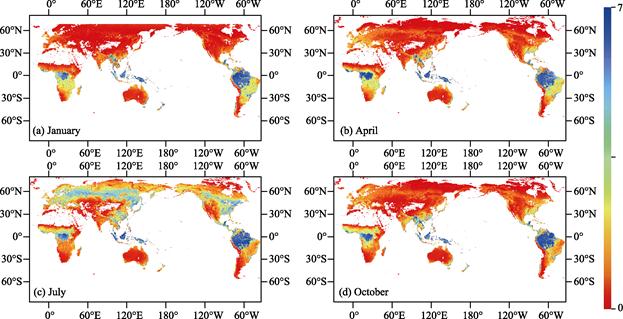
Figure 3 Global mean LAI maps derived from MODIS
(0.05??) in January (a), April (b), July (c) and October (d), respectively (2001-2021)
|
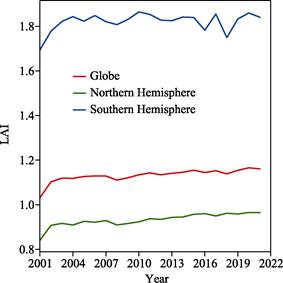
Figure
4 Temporal variation of global annually mean LAI (2001-
2021)
|
the
LAI initially decreased and then increased over the course of the year, with
the highest value of 2.2 occurring in January, and the lowest value of 1.4
occurring in July. Conversely, the Northern Hemisphere followed an opposite
seasonal pattern, with the lowest LAI value (0.4) in January and the highest
LAI value (1.7) in July. Both the global mean LAI and that of the Northern
Hemisphere displayed similar seasonal variations and reached their maximum LAI
values at similar times. However, the minimum global mean LAI value (0.6) was
higher than the minimum LAI value observed for the Northern Hemisphere.
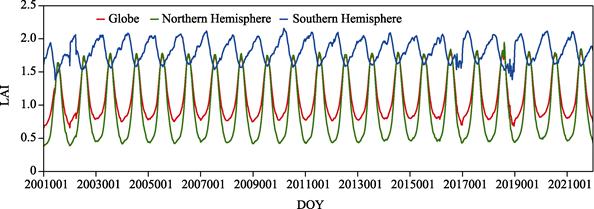
Figure 5 Temporal
variation of global, Northern and Southern
Hemisphere mean LAI (2001-2021)
An analysis was conducted to further investigate the spatial changes in
the global LAI; the findings are presented
in Figure 6. The areas exhibiting an increase in LAI were primarily
concentrated in China, India, and Europe, with the maximum rate of increase
recorded at 0.15 per year. Conversely, a decrease in LAI was observed near the
Great Lakes in North America.
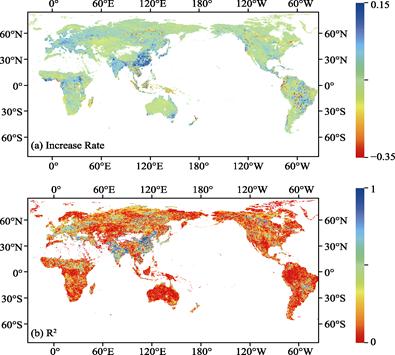
Figure 6 Map of long-term trend of the global LAI from 2001 to
2021
4.3 Data Validation
|
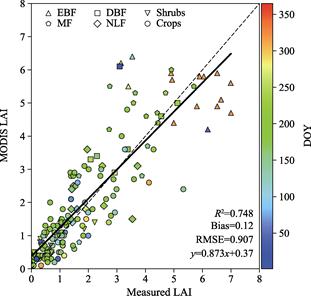
Figure
7 Scatter plot of MODIS product
reprocessing dataset with ground truth LAI
(Notes: EBF,
evergreen broadleaf forest; DBF, deciduous broadleaf forest; Shrubs, Savanna;
MF, mixed forest; NLF, needle-leaf forest; Crops: crops; DOY: julian day)
|
The product was validated using global LAI validation data; a scatter
plot is shown in Figure 7. The product and ground-truth LAI showed good agreement;
the linear fitting results were close to the 1:1 line, and the R2 was 0.748, with a bias of
0.12 and RMSE of 0.907, which was better than the existing product accuracy[3] (R2 = 0.615, bias = 0.13, RMSE
= 1.16). The LAI was underestimated in broad-leaved evergreen forests because
of the saturation effect that exists in remote sensing observations.
5 Discussion and Conclusion
MODIS
LAI products have been extensively utilized in global change studies. However,
inherent algorithmic limitations introduce uncertainty into these products,
leading to errors in global change analyses. This study proposed a synthesis
method based on the maximum FAPAR using the MODIS LAI product. By employing a spatiotemporal filtering technique,
this study effectively reduced outliers and vacant values, resulting in a
global LAI dataset characterized by spatiotemporal continuity and reliable
quality. Validation using ground truth data showed that the optimized product
had high accuracy, with a R2
value of 0.748, bias of 0.119, and RMSE of 0.907, which were better than those
of the existing product accuracy[3] (R2=0.615, bias=0.13, and RMSE=1.16). Using the
reprocessed dataset, this study uncovered the distribution pattern of global
LAI in different seasons, elucidated the spatiotemporal variations of LAI in
the Northern and Southern Hemispheres, and identified the growth regions of the
global LAI over the past two decades. The primary growth regions include
eastern China, India, and Europe.
The contribution
of this study is the provision of a high-precision dataset that can facilitate
further research on global climate change, the carbon cycle, the development of
an ecological civilization, and the pursuit of dual carbon goals, particularly
in China.
Author Contributions
Zhang,
Y. H. and Gao, X. designed the algorithms of dataset. Liu, L., Zhang, Y. H. and
Hu, Z. W. contributed to the data processing and analysis. Wang, J. Z. and
Zhang, Y. H. preformed the data validation. Liu, L. and Zhang, Y. H. wrote the
data paper.
Conflicts of Interest
The
authors declare no conflicts of interest.
References
[1]
Liu,
Y., Liu, R., Chen, J., et al. Current status and perspectives of leaf
area index retrieval from optical remote sensing data [J]. Geo-information
Science, 2013, 15(5): 734-743.
[2]
Chen, J. M., Black, T. A.
Defining leaf area index for non-flat leaves [J]. Plant, Cell & Environment,
1992, 15(4): 421-429.
[3] Fang, H., Baret, F., Plummer, S., et al.
An overview of global leaf area index (LAI): methods, products, validation, and
applications [J]. Reviews of Geophysics, 2019, 57(3): 739-799.
[4] GCOS. The global observing system for
climate implementation needs [R]. 2016.
[5] Xiao, Z., Liang, S., Wang, J., et al.
Use of general regression neural networks for generating the glass leaf area
index product from time-series MODIS surface reflectance [J]. IEEE
Transactions on Geoscience and Remote Sensing, 2014, 52(1): 209-223.
[6] Baret, F., Hagolle, O., Geiger, B., et al.
LAI, fAPAR and fCover CYCLOPES global products derived from VEGETATION [J]. Remote
Sensing of Environment, 2007, 110(3): 275-286.
[7] Knyazikhin, Y., Martonchik, J. V., Myneni,
R. B., et al. Synergistic algorithm for estimating vegetation canopy
leaf area index and fraction of absorbed photosynthetically active radiation
from MODIS and MISR data [J]. Journal of Geophysical Research: Atmospheres,
1998, 103(D24): 32257.
[8] Chen, C., Park, T., Wang, X., et al.
China and India lead in greening of the world through land-use management [J]. Nature Sustainability, 2019, 2(2): 122-129.
[9] Zhang, Y., Hu, Z., Wang, J., et al.
Temporal upscaling of MODIS instantaneous FAPAR improves forest gross primary
productivity (GPP) simulation [J]. International Journal of Applied Earth
Observation and Geoinformation, 2023, 121: 103360.
[10] Fang, H., Zhang, Y., Wei, S., et al. Validation
of global moderate resolution leaf area index (LAI) products over croplands in
northeastern China [J]. Remote Sensing of Environment, 2019, 233(4):
111377.
[11] Ma, P. P., Li, J., Liu, Q. H., et al. 2019.
Multisensor synergistic quantitative leaf area index product of China. Journal
of Remote Sensing, 23(6): 1232-1252.
[12] Yuan, H., Dai, Y., Xiao, Z., et al. Reprocessing
the MODIS leaf area index products for land surface and climate modeling [J]. Remote Sensing of Environment, 2011,
115(5): 1171-1187.
[13] Wang, J., Yan, K., Gao, S., et al. Improving the
quality of MODIS LAI products by exploiting spatiotem- poral correlation
information [J]. IEEE Transactions on Geoscience and Remote Sensing,
2023, 61: 1-19.
[14] Zhang, Y., Fang, H., Wang, Y., et al. Variation
of intra-daily instantaneous FAPAR estimated from the geostationary Himawari-8
AHI data [J]. Agricultural and Forest Meteorology, 2021, 307: 108535.
[15] Pu, J., Yan, K., Gao, S., et al. Improving the
MODIS LAI compositing using prior time-series information [J]. Remote
Sensing of Environment, 2023, 287: 113493.
[16] Liu, L., Zhang, Y. H., Hu,
Z. W., et al. MODIS global leaf area
index product reprocessing dataset (2001-2021) [J/DB/OL]. Digital Journal of Global Change Data Repository,
2023. https://doi.org/10.3974/ geodb.2023.10.03.V1. https://cstr.escience.org.cn/CSTR:20146.11.2023.10.03.V1.
[17] GCdataPR Editorial Office.
GCdataPR data sharing policy[OL]. https://doi.org/10.3974/dp.policy.2014.05
(Updated 2017).
[18] Zeng, Y., Li, J., Liu, Q. Global LAI ground validation
dataset and product validation framework [J]. Advances in Earth Science,
2012, 27(2): 165-174.
[19] Weiss, M., Baret, F., Block, T., et
al. On line validation exercise (OLIVE): a web based service for the
validation of medium resolution land products application to FAPAR products [J].
Remote Sensing, 2014, 6(5): 4190-4216.