Dataset of the Value Added Proportion of High Carbon Load Industries and Decoupling Index in 18 Economies
Zhang, L.1,2,3 Ma, L.1,2,3*
1. Key Laboratory of Regional Sustainable Development Modeling of Chinese Academy of Sciences, Beijing 100101, China;
2. Institute of Geographic Sciences and Natural Resources Research, Chinese Academy of Sciences, Beijing 100101, China;
3. University of Chinese Academy of Sciences, Beijing 100049, China
Abstract: Based on manufacturing value added and carbon emissions data from nine established industrialized countries (Australia, Canada, Denmark, France, Italy, Japan, Sweden, United Kingdom, and United States) and nine newly industrialized countries and areas (China Mainland, China Hong Kong, India, Iran, Malaysia, the Philippines, South Korea, Singapore, and South Africa) from 1965 to 2010, this study calculated the proportion of their high-carbon load sectors among all manufacturing industries, analyzed the decoupling of the relationship between manufacturing development and carbon emissions, and determined the contributions of scale, technology, and restructuring to the carbon emission changes at different stages in each country using the logarithmic mean divisia index (LMDI) method. The emerging industrialized countries and areas were found to be lagging behind the industrialized countries in terms of structure, technology, and scale, but the overall evolutionary trend was similar, indicating that the newly industrialized countries and areas were undertaking industrial transfer from the established industrialized countries. However, the contributions of industrial scale, structure, and technology differed among the different stages of development in the different countries. The dataset includes: (1) data for the value added proportion of high-carbon load manufacturing in 18 countries and regions from 1965 to 2010; and (2) the coupling coefficient between manufacturing value added and carbon emissions in 18 countries and regions from 1965 to 2010. The dataset is archived in .xlsx format with the data size of 29.6 KB.
Keywords: manufacturing; high-carbon load sectors; decoupling index; 18 economies; logarithmic mean divisia index (LMDI)
1 Introduction
As a major cause of global climate change, carbon emissions have become one of the most important academic and political issues in recent decades[1]. An analysis of industrial data and the associated carbon emissions can indicate the main factors influencing carbon emissions at different temporal and spatial scales, providing a good foundation for the development of a low-carbon economy and the establishment of emission reduction policies. Wu et al.[2] used carbon coefficient data from the American Oak Ridge National Laboratory (ORNL), Institute of Resources and Ecology (IREEA) at Nanjing Agricultural University, and Intergovernmental Panel on Climate Change (IPCC) who measured the agricultural carbon emissions of 31 provinces in China from 2000 to 2011. They then constructed and decomposed the Data Envelopment Analysis (DEA)-Malmquist agricultural efficiency index, containing both expected and undesired outputs, and analyzed the provincial differences and trends of the index. Cansino et al.[3] used the World Input-Output Database (WIOD) to calculate carbon emissions for 35 sub-sectors in Spain between 1995 and 2009. Lindmark[4] used the carbon emission coefficient of different fossil fuels from the ORNL and calculated historical carbon emissions data in Sweden from 1870 to 1997. Ren et al.[5] calculated the carbon emissions from 15 manufacturing sectors from 1995 to 2010 using the carbon emission coefficient in the IPCC List Guide (2006) and the China Energy Statistical Yearbook. Lu et al.[6] used the same method to measure and decompose the carbon emissions of China’s construction industry from 1994 to 2002. In contrast, Xu et al.[7] and Sun et al.[8] determined carbon emissions for particular industries within a country based on shorter time scales. In general, these data are based on the World Bank or International Energy Agency (IEA) carbon emissions data. There is a need for an analysis of the coupling of manufacturing structure and carbon emissions at a multi-national scale.
2 Metadata of Dataset
The name, author, geographical region, year, dataset files, data format, data size, data publisher, and data sharing policy of the dataset[9] are given in Table 1.
Table 1 Metadata summary of the value added rate of high carbon-loaded manufacturing sectors and decoupling index dataset in 18 economic bodies (countries and regions)
|
Items
|
Descriptions
|
|
Dataset full name
|
Value added rate of high carbon-loaded manufacturing sectors and decoupling index dataset in 18 economic bodies (countries and regions)
|
|
Dataset short name
|
ValueAddedRateManufact18CR_1965-2010
|
|
Authors
|
Ma, L. P-4918-2018, Institute of Geographic Sciences and Natural Resources Research, Chinese Academy of Sciences, mali@igsnrr.ac.cn
Zhang, L. P-4634-2018, Institute of Geographic Sciences and Natural Resources Research, Chinese Academy of Sciences, zhangl.16s@igsnrr.ac.cn
|
|
Geographical region
|
Australia, Canada, China Mainland, China Hong Kong, Denmark, France, India, Iran, Italy, Japan, Malaysia, the Philippines, South Korea, Singapore, South Africa, Sweden, the U. K., the U. S.
|
|
Year
|
1965-2010 Data format .xlsx Data size 29.6 KB
|
|
Dataset files
|
The manufacturing value added proportion of high carbon load industries and decoupling index data set of 18 economies, 1965-2010 (some economies: 1977-2010)
|
|
Foundation(s)
|
Ministry of Science and Technology of P. R. China (2016YFA0602803);
National Natural Science Foundation of China (41371142)
|
|
Data publisher
|
Global Change Research Data Publishing & Repository, http://www.geodoi.ac.cn
|
|
Address
|
11A, Datun Road, Chaoyang District, Beijing 100101, China
|
|
Data sharing policy
|
Data from the Global Change Research Data Publishing & Repository includes metadata, datasets (data products), and publications (in this case, in the Journal of Global Change Data & Discovery). Data sharing policy includes: (1) Data are openly available and can be free downloaded via the Internet; (2) End users are encouraged to use Data subject to citation; (3) Users, who are by definition also value-added service providers, are welcome to redistribute Data subject to written permission from the GCdataPR Editorial Office and the issuance of a Data redistribution license, and; (4) If Data are used to compile new datasets, the ‘ten percent principal’ should be followed such that Data records utilized should not surpass 10% of the new dataset contents, while sources should be clearly noted in suitable places in the new dataset [10]
|
3 Methods
The structural data of the manufacturing sectors in different countries were from the manufacturing sub-industry database of the United Nations Industrial Development Organization (UNIDO) (using 2010 US dollar values). Six high carbon load sectors were then selected and their share of total manufacturing value added was calculated. Then, a decoupling index of the relationship between the change of carbon emission and manufacturing scale was calculated. Finally the decoupling index was decomposed by the LMDI method. These data cover the period of 1965-2010. The carbon emission data of the nine newly industrialized economies (China Mainland, China Hong Kong, India, Iran, Malaysia, the Philippines, South Korea, Singapore, and South Africa) started from 1977. The total carbon emissions data for manufacturing industries were obtained from the CO2 emissions from the fuel combustion sub-database in the OECD database (www.oecd-ilibrary.org).
3.1 Algorithm
According to the relevant literature regarding the carbon intensity of various industries, the manufacturing sectors with high carbon emissions per output were named as high carbon load sectors. Six sectors were defined as high carbon load sectors: textile industry, coke refined
petroleum products, nuclear fuel, chemical and chemical products, non-metallic minerals, and basic and fabricated metals. The proportions of total manufacturing added value represented by these sectors in different years were calculated.
Based on the decoupling index model of carbon emission and manufacturing value added, the Kaya identities were used to decompose the decoupling index into three aspects: scale effect, technical effect, and structural effect. The proportional contribution of the three effects was then calculated by the LMDI method. It was possible to identify the effects of the scale of manufacturing, the carbon intensity of manufacturing, and the structure of manufacturing on the carbon emissions of manufacturing for different countries and periods.
3.2 Technical Solutions
According to the evolutionary characteristics of international industrial transfer, this study conducted an LMDI analysis and analyzed the decoupling between manufacturing and carbon emissions in three stages: 1965–1985 (newly industrialized countries and regions starting from 1977 due to data limitations), 1985–2000, and 2000–2010.
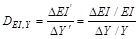
Firstly, the decoupling index of manufacturing output and carbon emissions was calculated for different countries:
 (1)
(1)
where DEI,Y is the elasticity of carbon emissions relative to the value added of the manufacturing industry, i.e., the change in the scale of carbon emissions caused by one percentage change in the manufacturing value added;  is the rate of change in the scale of carbon emissions, i.e., the ratio of the change in the scale of emissions during the evaluation period (∆EI) to the initial emission scale (EI);
  is the change rate of the manufacturing value added, i.e., the ratio of the change in the manufacturing value added during the evaluation period (∆Y) to the initial manufacturing value added (Y).
Secondly, the decoupling index between the output value and carbon emissions was decomposed into three aspects by the Kaya identity: scale effect, technical effect, and structural effect [see equations (2) and (3)]. The LMDI method was used to quantitatively analyze the contribution of these factors [see equations (4)–(6)].
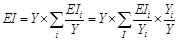 (2)
(2)
Where EI is the carbon emissions; Y is the total value added of the manufacturing industry; EIi is the carbon emissions of sector i within the industrial sector; and Yi is the value added of the sector i. Therefore, the change in the total scale of carbon emissions was affected by the value of value added (Y), carbon intensity ( ), and industrial structure (
 ), and the change in the scale of carbon emissions in the base period (∆EI) can be expressed as:
 (3)
(3)
where EIt is the final carbon emission for the research period; EI0 is the initial carbon emission; ∆EII is the scale factor; ∆EIIE is the carbon emissions coefficient per output, i.e., the technical factor; and ∆EIIS is the industrial structure factor. The proportional contribution of the three effects was calculated using the LMDI method as follows:
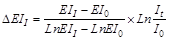 (4)
(4)
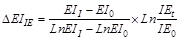 (5)
(5)
 (6)
(6)
4 Data Composition and Results
4.1 Dataset Composition
The dataset includes data for value added proportion of high carbon load industries of 18 economies (countries and regions) from 1965 to 2010, the decoupled manufacturing value added and carbon emissions data, and data decomposed by technology and structural factors. The dataset is stored in an Excel file, with a size of 29.6 KB.
4.2 Results
The detail data included in the dataset are as follows:
(1) The proportion of high carbon load manufacturing in 18 economies (countries and regions) from 1965 to 2010. The 18 economies included nine established industrialized countries (Australia, Canada, Denmark, France, Italy, Japan, Sweden, United Kingdom, and United States) and nine newly industrialized countries and regions (China Mainland, China Hong Kong, India, Iran, Malaysia, the Philippines, South Korea, Singapore, and South Africa).
(2) The degree of decoupling and the proportional contribution of scale, technology, and structural factors for the manufacturing sector carbon emissions of 18 economies (countries and regions) from 1965 to 1985 (newly industrialized countries and regions starting from 1977), 1985 to 2000, and 2000 to 2010 (Tables 2-4).
5 Discussion and Conclusion
Industrial data and the associated carbon emissions can indicate the environmental stress associated with economic development in a country or region, and reveal the mechanisms of the impact of economic development on environmental pollution. Due to the limited amount of supporting data and its means of acquisition, these data tend to focus on shorter time scales or on a specific industry at a country scale. In addition, there is no comparative data enabling assessments between countries, and accounting standards are different. Industrial carbon emissions are greatly affected by secondary industries that have high energy consumption, especially manufacturing sectors with high carbon loads. Therefore, we focused on carbon emissions from the manufacturing sector and calculated the proportion of high carbon load manufacturing in the 18 major economies (countries and regions). We also used them as a measure of structural effects in the manufacturing carbon emissions decomposition model. It should be noted that the carbon emissions data used in this study were based on the producer perspective, which does not reveal the difference in emissions between producers and consumers in different countries. Therefore, future studies need to continuously improve data from the perspective of consumers or the shared responsibility of producers and consumers, and a strengthening of inter-country comparisons is also important.
Table 2 The coupling relationship between manufacturing and CO2 emissions from 1965 to 1985
|
Type of country and region
|
Country and
region
|
Decoupling index DEI, Y
|
Type
|
Scale effect
(%)
|
Technical effect (%)
|
Structural effect (%)
|
|
Established industrialized countries
(1965–1985)
|
Australia
|
0.01
|
Relative decoupling
|
149.27
|
‒144.31
|
‒1.61
|
|
Canada
|
0.05
|
Relative decoupling
|
162.43
|
‒145.15
|
‒10.59
|
|
Denmark
|
‒0.05
|
Absolute decoupling
|
159.92
|
‒183.44
|
‒1.05
|
|
France
|
‒0.08
|
Absolute decoupling
|
161.70
|
‒203.69
|
‒21.63
|
|
Italy
|
‒
|
‒
|
‒
|
‒
|
‒
|
|
Japan
|
0.03
|
Relative decoupling
|
261.86
|
‒228.19
|
‒24.39
|
|
Sweden
|
‒0.11
|
Absolute decoupling
|
138.81
|
‒179.28
|
‒3.28
|
|
United Kingdom
|
‒
|
‒
|
‒
|
‒
|
‒
|
|
United States
|
‒0.06
|
Absolute decoupling
|
148.42
|
‒172.72
|
‒25.68
|
|
Newly industrialized countries and areas
(1977–1985)
|
China Mainland
|
‒
|
‒
|
‒
|
‒
|
‒
|
|
China Hong Kong
|
0.11
|
‒
|
50.13
|
‒98.49
|
‒4.54
|
|
India
|
‒0.43
|
Relative decoupling
|
63.54
|
‒33.97
|
‒4.45
|
|
Iran
|
4.04
|
Absolute decoupling
|
8.18
|
35.81
|
‒3.77
|
|
Malaysia
|
0.35
|
Absolute negative decoupling
|
94.93
|
‒77.61
|
32.56
|
|
the Philippines
|
0.74
|
Relative decoupling
|
22.75
|
28.09
|
1.38
|
|
Korea
|
0.40
|
Relative decoupling
|
97.74
|
‒116.24
|
‒2.61
|
|
Singapore
|
‒0.10
|
Relative decoupling
|
96.58
|
‒76.76
|
‒21.98
|
|
South Africa
|
1.82
|
Absolute decoupling
|
11.39
|
‒22.88
|
‒
|
Table 3 The coupling relationship between manufacturing and CO2 emissions from 1985 to 2000
|
Type of country and region
|
Country and
region
|
Decoupling index DEI, Y
|
Types
|
Scale effect (%)
|
Technical effect (%)
|
Structural effect (%)
|
|
Established industrialized countries
|
Australia
|
‒
|
‒
|
‒
|
‒
|
‒
|
|
Canada
|
0.06
|
Relative decoupling
|
75.97
|
‒69.48
|
‒15.99
|
|
Denmark
|
‒0.15
|
Absolute decoupling
|
77.50
|
‒96.67
|
‒
|
|
France
|
‒0.30
|
Absolute decoupling
|
52.20
|
‒75.26
|
‒5.36
|
|
Italy
|
0.02
|
Relative decoupling
|
106.69
|
‒103.38
|
‒4.19
|
|
Japan
|
0.02
|
Relative decoupling
|
90.79
|
‒87.66
|
‒11.00
|
|
Sweden
|
0.07
|
Relative decoupling
|
60.37
|
‒55.09
|
‒10.90
|
|
United Kingdom
|
‒0.34
|
Absolute decoupling
|
60.20
|
‒93.57
|
‒10.78
|
|
United States
|
‒0.20
|
Absolute decoupling
|
68.34
|
‒90.07
|
8.48
|
|
Newly industrialized countries and areas
|
China Mainland
|
0.18
|
Relative decoupling
|
110.02
|
‒78.74
|
‒11.97
|
|
China Hong Kong
|
1.02
|
Expandable negative
decoupling
|
30.76
|
10.37
|
‒
|
|
India
|
0.33
|
Relative decoupling
|
92.72
|
‒42.84
|
3.61
|
|
Iran
|
0.09
|
Relative decoupling
|
213.03
|
‒170.97
|
11.85
|
|
Malaysia
|
0.11
|
Relative decoupling
|
174.43
|
‒45.60
|
‒16.83
|
|
the Philippines
|
0.80
|
Relative decoupling
|
145.08
|
‒45.12
|
‒40.27
|
|
Korea
|
0.32
|
Relative decoupling
|
184.27
|
‒128.01
|
‒25.54
|
|
Singapore
|
0.21
|
Relative decoupling
|
153.65
|
‒23.51
|
‒7.48
|
|
South Africa
|
3.04
|
Expandable negative
decoupling
|
63.09
|
‒98.86
|
‒25.00
|
Table 4 The coupling relationship between manufacturing and CO2 emissions from 2000 to 2010
|
Type of country and region
|
Country and region
|
Decoupling index DEI, Y
|
Types
|
Scale effect (%)
|
Technical effect (%)
|
Structural effect (%)
|
|
Established industrialized countries
|
Australia
|
‒
|
‒
|
‒
|
‒
|
‒
|
|
Canada
|
‒1.98
|
Absolute decoupling
|
13.53
|
‒47.44
|
42.88
|
|
Denmark
|
‒0.51
|
Absolute decoupling
|
42.48
|
‒74.28
|
‒
|
|
France
|
‒0.87
|
Absolute decoupling
|
28.17
|
‒61.48
|
‒4.23
|
|
Italy
|
‒0.84
|
Absolute decoupling
|
36.98
|
‒84.01
|
‒9.27
|
|
Japan
|
‒7.97
|
Absolute decoupling
|
0.71
|
‒6.58
|
0.76
|
|
Sweden
|
‒0.80
|
Absolute decoupling
|
40.62
|
‒92.17
|
‒
|
|
United Kingdom
|
26.95
|
Absolute decoupling
|
‒1.16
|
‒36.25
|
6.97
|
|
United States
|
‒
|
‒
|
9.06
|
‒29.32
|
17.78
|
|
Newly industrialized countries and areas
|
China Mainland
|
0.26
|
Relative decoupling
|
211.57
|
‒104.73
|
5.61
|
|
China Hong Kong
|
‒3.84
|
Absolute negative decoupling
|
‒68.79
|
96.08
|
‒
|
|
India
|
0.09
|
Relative decoupling
|
146.79
|
‒67.81
|
1.00
|
|
Iran
|
8.42
|
Relative decoupling
|
13.35
|
52.89
|
‒0.60
|
|
Malaysia
|
1.05
|
Relative decoupling
|
64.09
|
‒85.90
|
33.62
|
|
the Philippines
|
‒0.38
|
Absolute decoupling
|
41.23
|
‒24.84
|
26.68
|
|
Korea
|
0.15
|
Relative decoupling
|
76.64
|
‒65.52
|
‒7.81
|
|
Singapore
|
0.13
|
Relative decoupling
|
63.06
|
48.42
|
18.97
|
|
South Africa
|
2.09
|
Expandable negative decoupling
|
68.35
|
‒41.70
|
‒3.30
|
Author contributions
Ma, L. was responsible for the overall design for the development of data sets; Zhang, L. collected and processed the data; Ma, L. designed the model and algorithm; and Zhang, L. undertook the data implementation and wrote the paper.
References
[1] Ma, L., Zhang, L. Spatio-temporal coupling relationship between international manufacturing transfer and CO2 emissions [J]. Resources Science, 2017,39(12): 2408-2419. DOI: 10.18402/resci.2017.12.19.
[2] Wu, X. R., Zhang, J. X., Tian, Y., et al. China’s provincial agricultural carbon emissions: measurement, efficiency change and influencing factors based on DEA-Malmquist index decomposition method and Tobit model application [J]. Resources Science, 2014, 36(1): 129-138.
[3] Cansino, J. M., Sánchez-Braza, A., Rodríguez-Arévalo, M. L. Driving forces of Spain’s CO2, emissions: a LMDI decomposition approach [J]. Renewable & Sustainable Energy Reviews, 2015, 48(C): 749-759.
[4] Lindmark, M. An EKC-pattern in historical perspective: carbon dioxide emissions, technology, fuel prices and growth in Sweden 1870–1997 [J]. Ecological Economics, 2002, 42(1/2): 333-347.
[5] Wang, X., Ren, S., Yuan, B., et al. Using LMDI to analyze the decoupling of carbon dioxide emissions by China’s manufacturing industry [J]. Journal of Central South University, 2015, 9(1): 61-75.
[6] Lu, Y., Peng, C., Li, D. Carbon emissions and policies in China’s building and construction industry: evidence from 1994 to 2012 [J]. Building & Environment, 2016, 95: 94-103.
[7] Xu, J., Zhang, M., Zhou, M., et al. An empirical study on the dynamic effect of regional industrial carbon transfer in China [J]. Ecological Indicators, 2017, 73: 1-10.
[8] Sun, L., Wang, Q., Zhou, P., et al. Effects of carbon emission transfer on economic spillover and carbon emission reduction in China [J]. Journal of Cleaner Production, 2016, 112: 1432-1442.
[9] Ma, L., Zhang, L. Value added rate of high carbon-loaded manufacturing sectors and decoupling index dataset in 18 economic bodies (countries and regions) [DB/OL]. Global Change Research Data Publishing & Repository, 2018. DOI: 10.3974/geodb.2018.05.03.V1.
[10] GCdataPR Editorial Office. GCdataPR data sharing policy [OL]. DOI: 10.3974/dp.policy.2014.05 (Updated 2017).