Integrated Remote Sensing and Machine Learning Dataset of
Soil Total Nitrogen in Taiyuan City (2020)
Shao, X.1,2 Yang, T.1*
1. The CAS Engineering
Laboratory for Yellow River Delta Modern Agriculture, Institute of Geographic
Sciences and Natural Resources Research, Chinese Academy of Sciences, Beijing
100101, China;
2. Faculty of Geography, Yunnan Normal University,
Kunming 650500, China
Abstract: Total soil nitrogen (TN) content is a
key indicator reflecting soil nutrient status and ecological functions. Based
on the Google Earth Engine (GEE) cloud computing platform, we integrated
multi-source remote sensing data and selected key environmental
variables??including MODIS-derived NDVI, Sentinel-2 near-infrared reflectance
(Band 8), surface soil moisture, precipitation, land surface temperature, and
digital elevation model (DEM)??as input features. 3 machine learning algorithms
were employed for TN content prediction: Random Forest (RF), Classification and
Regression Tree (CART), and Gradient Boosting Regression Tree (GBRT). Using
these models, we generated a 2020 soil total nitrogen dataset for Taiyuan City,
China. The SoilGrids global soil nitrogen dataset, provided by the
International Soil Reference and Information Centre (ISRIC), was used as the
reference data. Model performance was evaluated using root mean square error
(RMSE) and coefficient of determination (R²) through cross-validation.
The average RMSE values for RF, CART, and GBRT across different soil depths
were 0.16 g/kg, 0.21 g/kg, and 0.33 g/kg, respectively, with corresponding
average R² values of 0.62, 0.64, and 0.85. The validation results
indicate that the dataset exhibits high accuracy and reliability, providing
robust scientific support for regional soil nutrient assessment, agricultural
decision-making, and ecological-environmental management. The dataset includes
soil total nitrogen content at 6 soil depths (0?C5 cm, 5?C15 cm, 15?C30 cm, 30?C60
cm, 60?C100 cm, and 100?C200 cm) for Taiyuan City in 2020, with a spatial
resolution of 30 m. The dataset is
archived in .tif format, and consists of 18 data files with data size of 1.52
GB (compressed to 1 file with 219 MB).
Keywords: GEE; soil total nitrogen; multi-source
remote sensing data; machine learning models
DOI: https://doi.org/10.3974/geodp.2025.03.08
Dataset Availability Statement:
The dataset supporting this
paper was published and is accessible through the Digital
Journal of Global Change Data Repository at:
https://doi.org/10.3974/geodb.2025.04.01.V1.
1 Introduction
Soil
serves as the foundation for most terrestrial life, exhibiting unique
complexity and dynamic characteristics. Its nutrient composition plays a
critical role in maintaining ecological balance and promoting natural
development[1]. Soil total nitrogen content is a vital indicator for
assessing soil nitrogen storage and an essential mineral element for plant
growth. It significantly influences soil fertility and vegetation productivity,
directly determining crop yield and quality[2?C4].
Traditional soil
TN monitoring methods primarily rely on field sampling and chemical analysis.
While these approaches achieve high precision, they face limitations in sample
quantity, temporal cost, and spatial representativeness, making them inadequate
for large-scale, high-resolution dynamic monitoring[5,6]. With the
advancement of remote sensing technologies[7?C9], the integration of
machine learning models presents a novel approach for constructing
regional-scale soil TN content datasets. By synthesizing multi- source remote
sensing data and employing nonlinear regression algorithms such as random
forest and gradient boosting regression trees, spatial inversion of soil TN
content becomes feasible[5,10]. These methodologies not only enhance
the efficiency and accuracy of soil nitrogen monitoring but also provide
scientific foundations for soil management and agricultural decision-making.
The utilization of
the Google Earth Engine platform substantially improves computational and
temporal efficiency in remote sensing image processing[11], creating
opportunities for rapid analysis of massive remote sensing datasets[12].
Building upon this framework, this study leverages the GEE cloud computing
platform to integrate multi-source remote sensing data with mainstream machine
learning algorithms, thereby developing a spatially distributed soil TN content
dataset for Taiyuan City in 2020. The dataset encompasses 6 soil layers
spanning a depth of 0?C200 cm, with a spatial resolution of 30 m,
providing foundational support for high-quality cropland resource surveys and
regional agricultural information management.
2 Metadata of the Dataset
The
metadata for the A multi-source remote sensing and machine learning integrated
dataset of multi-layer soil total nitrogen content in Taiyuan, China (2020)[13]
is summarized in Table 1. It includes the dataset full name, short name,
authors, year of the dataset, temporal resolution, spatial resolution, data
format, data size, data files, etc.
3 Methods
3.1 Data Sources
(1) NDVI: AVHRR long-term
NDVI dataset, 16-day composite, with a spatial resolution of approximately 5.1
km[15]; (2) Near-infrared reflectance: Sentinel-2 Level-2A product,
Band 8, with a spatial resolution of 10 m[16]; (3) Surface soil
moisture: OpenLandMap soil moisture at 33 kPa (Band 10), with a spatial
resolution of approximately 250 m[17]; (4) Precipitation: CHIRPS
dataset, 0.05?? spatial resolution (approximately 5.6 km)[18]; (5)
Land surface temperature: MODIS MOD11A1 dataset, daytime
LST_Day_1 km band, with a spatial resolution of 1 km[19];
(6) Digital elevation model (DEM): SRTM DEM dataset, with a
Table
1 Metadata summary of the A multi-source
remote sensing and machine learning integrated dataset of multi-layer soil
total nitrogen content in Taiyuan, China (2020)
|
Items
|
Description
|
|
Dataset full name
|
A multi-source remote sensing and machine learning
integrated dataset of multi-layer soil total nitrogen content in Taiyuan,
China (2020)
|
|
Dataset short name
|
TY_SoilN2020
|
|
Authors
|
Shao, X. Faculty of Geography, Yunnan
Normal University, 2323130115@ynnu.edu.cn
|
|
|
Yang, T., Institute of Geographic Sciences and
Natural Resources Research, Chinese Academy of Sciences, yangt@igsnrr.ac.cn
|
|
Geographical region
|
Taiyuan City, China
|
|
Year
|
2020
|
|
Temporal resolution
|
Year
|
|
Spatial resolution
|
30 m
|
|
Data format
|
.tif
|
|
|
|
Data size
|
1.52 GB (219 MB after compression)
|
|
|
|
Data files
|
The soil total nitrogen content for
Taiyuan City in 2020
|
|
Foundation
|
Ministry of Science and Technology of P.
R. China (2023YFD1701804)
|
|
Computing environment
|
GEE, ArcGIS
|
|
Data publisher
|
Global Change
Research Data Publishing & Repository, http://www.geodoi.ac.cn
|
|
Address
|
No. 11A, Datun Road, Chaoyang District,
Beijing 100101, China
|
|
Data sharing policy
|
(1) Data are openly available and
can be free downloaded via the Internet; (2) End users are encouraged to use Data
subject to citation; (3) Users, who are by definition also value-added
service providers, are welcome to redistribute Data subject to
written permission from the GCdataPR Editorial Office and the issuance of a Data
redistribution license; and (4) If Data are used to compile new
datasets, the ??ten percent principal?? should be followed such that Data
records utilized should not surpass 10% of the new dataset contents, while
sources should be clearly noted in suitable places in the new dataset[14]
|
|
Communication and
searchable system
|
DOI, CSTR, Crossref, DCI, CSCD,
CNKI, SciEngine, WDS, GEOSS, PubScholar, CKRSC
|
spatial resolution
of 30 m[20]; (7) Surface soil nitrogen content: SoilGrids global
soil dataset[21].
3.2 Algorithm
3.2.1 Random Forest Regression
Random
Forest (RF) is an ensemble learning method that enhances prediction accuracy by
constructing multiple decision trees and aggregating their outputs[22,23].
The core idea of RF is to use a ??voting?? mechanism by training on multiple
randomly sampled subsets, thereby reducing the risk of overfitting associated
with a single decision tree. In this study, the RF model was trained on
integrated multi-source remote sensing data to automatically learn the complex
relationships between various environmental factors and soil nitrogen content,
ultimately outputting the predicted values of soil nitrogen concentration.
3.2.2 Classification and Regression Tree
The
Classification and Regression Tree (CART) is a non-parametric statistical
method that uses a binary tree structure to split nodes based on specific
rules. To enhance prediction accuracy, pruning is applied during the
tree-growing process by evaluating subtrees and selecting the final tree that minimizes
the average misclassification cost[24,25]. Due to its fast implementation,
simplicity, and classification accuracy, CART has been widely applied in remote
sensing image classification.
3.2.3 Gradient Boosted Regression Tree
Gradient
Boosted Regression Tree (GBRT) is a boosting algorithm based on decision trees
that improves overall model performance by iteratively constructing weak
learners and combining their predictions[26]. GBRT optimizes model
parameters by minimizing a loss function and incrementally adjusting the
prediction results to enhance accuracy.
3.3 Technical Route
Based
on the collection of multi-source data for the year 2020, a series of
preprocessing steps were conducted, including data cleaning, format conversion,
and spatial resolution harmonization. Subsequently, relevant features were
extracted from the preprocessed data, and 3 machine learning models??RF, CART,
and GBRT were employed to build prediction models. The selected environmental
factors were used as training inputs. Finally, soil total nitrogen content
datasets were generated at multiple depth intervals (Figure 1).
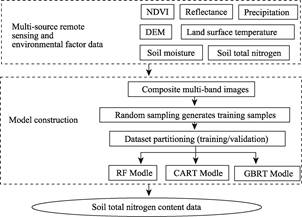
Figure 1 Flowchart of the dataset development
4 Data Results and Validation
4.1 Dataset Composition
The
dataset is archived in .tif format and consists of 18 data files, corresponding
to the outputs of 3 machine learning models: RF, CART, and GBRT for the year
2020 of Taiyuan City. Each model covers 6 soil depth layers: 0?C5 cm, 5?C15 cm,
15?C30 cm, 30?C60 cm, 60?C100 cm, and 100?C200 cm, representing the total
nitrogen content in the soil. The spatial resolution of the dataset is 30 m.
4.2 Data Results
Figure
2 illustrates the spatial distribution of TN content at multiple depths in
Taiyuan City in 2020. Overall, TN content shows a decreasing trend with
increasing soil depth. High values are predominantly observed in the surface
layer (0?C5 cm), while in the deep soil layer (100?C200 cm), TN content is
generally low, typically below 0.5 g/kg, reflecting the typical pattern of
organic matter input and nutrient accumulation at the surface.
Spatially, areas
with higher TN content are primarily located in the northern hilly region of
Yangqu, the Gujiao mining area, and the mountainous regions of western Lvliang.
These areas are characterized by complex topography, better vegetation
coverage, or minimal human disturbance, which contribute to higher accumulation
of litter and plant residues?? key sources of organic matter and nitrogen.
Notably, in the Gujiao mining area, although coal mining has caused localized
land degradation, restored vegetation zones exhibit relatively high fertility
input. In contrast, areas with low TN content are concentrated in the southern
Taiyuan Basin and the Fenhe River Alluvial Plain. These regions are
characterized by intensive agricultural activities, where high cultivation
intensity and substantial nitrogen loss are prevalent. Additionally, the
nitrogen-poor nature of the alluvial parent material and frequent anthropogenic
disturbance contribute to the overall low TN levels in these areas.
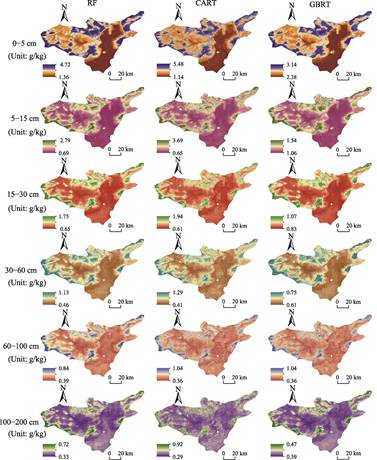
Figure 2 Spatial distribution maps of multi-layers
soil total nitrogen content in Taiyuan City (2020)
4.3 Data Validation
To
validate the accuracy and reliability of the TN dataset, this study employed
the global soil TN data provided by the SoilGrids project of the International
Soil Reference and Information Centre (ISRIC) as the benchmark.
Cross-validation was conducted, and 2 statistical indicators??Root Mean Square
Error (RMSE) and Coefficient of Determination (R2)??were used
to systematically evaluate and compare the performance of different models
across various soil depths. Detailed results are presented in Table 2.
In general, the models exhibited better
predictive performance in shallow soils (0?C60 cm) than in deeper layers (60?C200
cm), as reflected by higher R2 values. For instance, in the
0?C60 cm depth interval, all models achieved R² values exceeding 0.73,
indicating a good fit to the spatial variation of TN content at this depth. In
contrast, the lowest R² dropped to 0.32 in the 100?C200 cm layer,
indicating a significantly increased prediction error in deeper soils,
Table
2 Accuracy assessment statistics of the performance of
different models
|
Soil depth (cm)
|
RF
|
CART
|
GBRT
|
|
RMSE (g/kg)
|
R2
|
RMSE (g/kg)
|
R2
|
RMSE (g/kg)
|
R2
|
|
0?C5
|
0.40
|
0.75
|
0.52
|
0.75
|
0.85
|
0.91
|
|
5?C15
|
0.21
|
0.79
|
0.28
|
0.80
|
0.50
|
0.91
|
|
15?C30
|
0.12
|
0.73
|
0.15
|
0.78
|
0.26
|
0.90
|
|
30?C60
|
0.08
|
0.75
|
0.10
|
0.77
|
0.16
|
0.89
|
|
60?C100
|
0.08
|
0.39
|
0.10
|
0.38
|
0.11
|
0.76
|
|
100?C200
|
0.07
|
0.32
|
0.09
|
0.35
|
0.10
|
0.73
|
likely
due to enhanced soil heterogeneity.
Regarding model
performance, the 3 machine learning algorithms??RF, CART, and GBRT??showed
distinct predictive capabilities across depths and regions. RF demonstrated
overall stability, with superior performance in the 0?C60 cm range (R2=0.73?C0.79),
reflecting its robustness to outliers and strong ability to capture complex
feature interactions. However, its performance declined markedly in the deep
layer (100?C200 cm, R2=0.32), indicating limited
generalizability. CART showed signs of overestimation in some regions of the
surface layer (0?C5 cm), where R2 reached 0.75, but RMSE was
as high as 0.52 g/kg, suggesting a risk of overfitting. This may be attributed
to CART??s high sensitivity to specific combinations of input variables and its
vulnerability to uneven sample distributions or extreme values. GBRT
consistently achieved the highest R2 values across all
depths, with powerful performance in the surface layer (R2=0.91).
However, the corresponding RMSE reached 0.85 g/kg, indicating
??over-responsiveness?? to highly variable regions and a tendency to overestimate
local TN peaks.
Moreover,
differences in variable response mechanisms among models also significantly
influenced their predictive performance. CART is more sensitive to
high-frequency disturbance variables (e.g., NDVI and land surface temperature),
making it prone to extreme value bias. RF tolerates local outliers well but may
underestimate local maxima. GBRT, which builds prediction functions through
residual-based iterative boosting, excels at capturing complex nonlinear
patterns but is sensitive to model parameterization and relies more heavily on
terrain-related variables (e.g., DEM), especially in areas with considerable
topographic variation.
In conclusion,
the 3 models demonstrate varying applicability across different soil depths and
geographic regions, underscoring the importance of selecting suitable models
based on regional characteristics and specific prediction targets. The soil TN
dataset constructed in this study achieved high prediction accuracy in the 0?C60
cm layer (R2>0.70, RMSE< 0.5 g/kg), demonstrating
strong scientific applicability and potential for practical use.
5 Discussion and Conclusion
This
study, based on the Google Earth Engine (GEE) platform, integrated 6 categories
of remote sensing data to construct a high-resolution spatial distribution
dataset of soil total nitrogen (TN) content in Taiyuan City. Using a regression
modeling approach driven by multi-source remote sensing covariates, the dataset
achieved a spatial resolution of 30 m. It significantly improved the
representation of soil nitrogen content in complex zones such as agricultural
field boundaries (e.g., paddy fields in the Fenhe Plain) and reclaimed mining
areas (e.g., the Gujiao mining area). Compared to the global SoilGrids dataset,
the results of this study more accurately depict the spatial gradient of soil
TN at the regional scale, especially in heterogeneous landscapes characterized
by complex land-use structures and strong anthropogenic disturbances. This
validates the feasibility and necessity of regional- scale multi-source data
fusion modeling.
At the soil
profile scale, the TN content in Taiyuan exhibits a pronounced surface- aggregation
pattern, with the 0?C30 cm layer being significantly enriched, primarily due to
surface organic matter input, intensive human activities, and coupled physical-biological
processes. In contrast, the TN content decreases progressively with depth, a
trend jointly driven by the attenuation of organic input, differentiation of
microbial activity, leaching and clay barrier effects, and the depth
limitations imposed by root systems and anthropogenic disturbances. This
vertical stratification provides theoretical support for controlling non-point
source nitrogen pollution and for precise nitrogen application in cultivated
areas.
Nevertheless,
the dataset has certain limitations. The modeling framework is constrained by
single-year observations and the predominance of surface-layer remote sensing
covariates, making it difficult to fully capture the physicochemical properties
(e.g., pH, cation exchange capacity (CEC), clay content) and interannual
dynamics of deeper soil layers. Future work should integrate in situ
sensor networks, nitrogen cycling process models, and multi- temporal remote
sensing data to establish a spatiotemporally continuous soil nitrogen
monitoring system encompassing both surface and subsurface layers.
Additionally, the incorporation of physically constrained deep learning models
is recommended to enhance generalization and transferability in heterogeneous
geomorphic regions such as mining areas and alluvial plains.
Author Contributions
Yang, T. designed the
algorithms of dataset. Shao, X. collected and processed the multi- source
remote sensing data and wrote the data paper.
Conflicts of Interest
The
authors declare no conflicts of interest.
References
[1]
Pang, Y. G., Zhang, M. H.,
Jiang, M., et al. Spatial heterogeneity and comprehensive quality
assessment of cultivated soil physicochemical properties and microbial
characteristics in Gaoyao District, Zhaoqing City, Guangdong Province [J]. Journal
of South China Agricultural University, 2025, 46(2): 151?C163.
[2]
Chapin, F. S., Matson, P. A.,
Mooney, H. A. Principles of Terrestrial Ecosystem Ecology [M]. Berlin: Springer, 2011.
[3]
Htwe, N. M. P. S., Ruangrak, E.
A review of sensing, uptake, and environmental factors influencing nitrate
accumulation in crops [J]. Journal of Plant Nutrition, 2021, 44(3):1?C12.
[4]
Liu, L. Q., Wei, G. Y., Zhou,
P. Prediction mapping of soil total nitrogen based on optimized machine
learning models using GF-5 imagery [J]. Smart Agriculture, 2024, 6(5):
61?C73.
[5]
Song, X., Zhang, M., Zhou, H.
Y., et al. Estimation of soil total nitrogen in Taihu Lake region based
on optimized soil spectral parameters [J]. Journal of Agricultural Resources
and Environment, 2020, 37(1): 43?C50.
https://doi.org/10.13254/j.jare.2018.0365.
[6]
Zhang, H. L., Xie, C. Y., Tian,
P., et al. Measurement of soil organic matter and total nitrogen using
visible/near-infrared spectroscopy and data-driven machine learning methods [J].
Spectroscopy and Spectral Analysis, 2023, 43(7): 2226?C2231.
[7]
Zhao, C. J. Advances in
agricultural remote sensing research and applications [J]. Transactions of
the Chinese Society for Agricultural Machinery, 2014, 45(12): 277?C293.
[8]
Nie, P. C., Qian, C., Qin, R.
M., et al. Current status and trends of integrated aerial-space-ground
information perception and fusion technologies [J]. Journal of Intelligent
Agricultural Equipment, 2023, 4(2): 1?C11.
[9]
Zhang, S., Zhang, J. H., Bai,
Y., et al. Evaluation and improvement of the daily Boreal Ecosystem
Productivity Simulator in simulating gross primary productivity at 41 flux
sites across Europe [J]. Ecological Modelling, 2018, 368: 205?C232.
https://doi.org/10.1016/j.ecolmodel.2017.11.023.
[10]
Yang, Z., Pan, X., Yuan, J., et
al. Satellite-based monitoring dataset of cyanobacteria blooms in Lake
Taihu (2019) based on random forest algorithm [J]. Journal of Global Change
Data & Discovery, 2023, 7(3): 321?C326.
https://doi.org/10.3974/geodp.2023.03.11.
[11]
Pan, X. Research on remote
sensing image intelligent classification methods of land cover types based on
the Google Earth Engine cloud platform [D]. Hohhot: Inner Mongolia Agricultural
University, 2021.
[12]
Development and applications of
cloud computing platforms for remote sensing in Earth sciences [OL].
https://d.wanfangdata.com.cn/Periodical/ygxb202101014 (accessed on 13 April
2025).
[13]
Shao, X., Yang, T. A multi-source
remote sensing and machine learning integrated dataset of multi-layer soil total
nitrogen content in Taiyuan, China (2020) [J/DB/OL]. Digital Journal of
Global Change Data Repository, 2025.
https://doi.org/10.3974/geodb.2025.04.01.V1.
[14]
GCdataPR Editorial Office.
GCdataPR data sharing policy [OL]. https://doi.org/10.3974/dp.policy.2014.05
(Updated 2017).
[15]
NOAA National Climatic Data
Center. NOAA Climate Data Record (CDR) of AVHRR NDVI, Version 5 [DB/OL]. 2020.
https://developers.google.com/earth-engine/datasets/catalog/NOAA_CDR_AVHRR_NDVI_
V5.
[16]
European Space Agency.
Sentinel-2 [OL]. https://scihub.copernicus.eu/dhus/#/home.
[17]
Hengl, T., Gupta, S.
OpenLandMap soil moisture at 33 kPa [DB/OL]. 2017.
https://developers.google.com/ earth-engine/datasets/catalog/OpenLandMap_SOL_SOL_WATERCONTENT-33KPA_USDA-4B1C_M_v01.
[18]
Funk, C., Peterson, P.,
Landsfeld, M., et al. CHIRPS daily precipitation data [DB/OL]. 2015.
https://developers.google.com/earth-engine/datasets/catalog/UCSB_CHG_CHIRPS_DAILY.
[19]
NASA. MODIS terra land surface temperature
and emissivity daily L3 global 1 km SIN grid V006 (MOD11A1) [DB/OL]. 2020.
https://developers.google.com/earth-engine/datasets/catalog/MODIS_006_ MOD11A1.
[20]
USGS. SRTMGL1 global 30 m DEM
(Version 003) [DB/OL]. 2000. https://developers.google.com/earth- engine/datasets/catalog/USGS_SRTMGL1_003.
[21]
ISRIC??World Soil Information.
SoilGrids: global gridded soil information (Nitrogen) [DB/OL]. 2020.
https://developers.google.com/earth-engine/datasets/catalog/projects_soilgrids-isric_nitrogen_mean.
[22]
Prasad, A. M., Iverson, L. R.,
Liaw, A. Newer classification and regression tree techniques:
bagging and random forests for ecological regression [J]. Ecosystems, 2006, 9(2): 181?C199.
[23]
Breiman, L. Random forests [J].
Machine Learning, 2001, 45(1): 5?C32.
[24]
Wang, D. P., Wang, Z. L., Li,
D. Y., et al. Classification of desertification land using CART based on
integrated non-spectral information [J]. Journal of Remote Sensing, 2007, 11(4): 487?C492.
[25]
Breiman, L., Friedman, J. H.,
Olshen, R. A., et al. Classification and Regression Trees [M]. Belmont:
Wadsworth International Group, 1984.
[26]
Friedman, J. H. Greedy function
approximation: a gradient boosting machine [J]. Annals of Statistics,
2001, 29(5): 1189?C1232.