Analysis of Ozone Pollution Characteristics and
Impact Factors in Haikou City (2016-2020)
Cai, J. Z.1 Wang, S. H.2 Hu, J. X.3*
1. Ecological Environmental Protection
Administrative Law Enforcement Detachment of Haikou Comprehensive Administrative Law Enforcement Bureau,
Hainan, Haikou 570000, China;
2. Haikou Municipal Ecology and Environment Bureau, Hainan,
Haikou 570000, China;
3. China National Environmental Monitoring Centre, Beijing 100012,
China
Abstract: To study the
characteristics of ozone pollution changes in tropical island cities and their
relationship with meteorological factors, daily and hourly air quality
automatic monitoring data and meteorological observations in Haikou city from
2016 to 2020 were selected for analysis. The results show that the peak ozone
concentration period of Haikou city is significantly different from that of
inland cities, mainly in the autumn and winter seasons (from October to
December). Regional climate differences are the main reason for the time
distribution. The diurnal variation presents an obvious single-peak feature,
with a nadir at 8:00 and a peak at 14:00-16:00.
In recent years, the range of ozone pollution in urban areas has gradually
expanded, and its degree has worsen; ozone concentration is positively
correlated with CO concentration and wind speed, and negatively correlated with
humidity. The main meteorological factors that affect the change of ozone
concentration in Haikou city in autumn and winter are not air pressure and
temperature.
Keywords: Haikou city; variation
characteristic; precursor; correlation analysis; meteorological factor
DOI: https://doi.org/10.3974/geodp.2022.03.16
CSTR: https://cstr.escience.org.cn/CSTR:20146.14.2022.03.16
Dataset Availability Statement:
The dataset
supporting this paper was published and is accessible through the Digital Journal of Global Change Data
Repository at:https://doi.org/10.3974/geodb.2022.05.04.V1 or
https://cstr.escience.org.cn/CSTR:20146.11.2022.05.04.V1.
1 Introduction
In recent years, O3 has become one of the most critical
pollutants affecting urban air quality in China, and O3 pollution in
cities and regions is on the rise[1]. According to the 2019 China Ecological Environment
Bulletin, in 337 cities at prefectural level and above in China, the
average annual concentrations of PM2.5,
PM10, O3, SO2, NO2, and CO
were 36 ??g/m3, 63 ??g/m3,
148 ??g/m3, 11 ??g/m3, 27 ??g/m3 and 1.4 mg/m3,
respectively. Compared with 2018, O3
concentration has increased, and the proportion of days exceeding the standard
is also on the rise. O3
pollution has become increasingly prominent[2]. At present, with the
rapid economic development and the continuous expansion of the urban scale, O3 pollution has become an important
environmental problem that urgently needs to be solved in the process of urban
development in China and is one of the hot research topics in the field of
atmospheric chemistry and environmental science. It is generally believed that
the changing trend of O3
pollution is subject to the joint action of the emission of precursor
substances, meteorological conditions, and chemical reactions and that there is
a significant correlation between the change of O3
concentration and meteorological conditions, with obvious seasonal variation
characteristics[3,4]. However, domestic analysis and research on O3 pollution are mainly concentrated
in some key cities and economically developed areas. In recent years, the
economic development and urban expansion of Hainan province have led to a
worsening air quality of Hainan Island, and the situation of O3 pollution has become increasingly
severe[5,6]. Haikou is a tropical island city with unique natural
conditions, its O3 pollution
characteristics and meteorological impact have certain typicality. Therefore,
based on the concentration data of O3, CO, and NO2 from
four state-controlled monitoring sites in Haikou
city during the 13th Five-Year Plan (2016-2020),
this paper analyzes the overall characteristics of O3 pollution and
the potential relationship between O3
and precursor substances. In addition, the monthly and daily variation
characteristics of O3
concentration at the state-controlled monitoring stations were analyzed.
Through studying the relationship between O3
and meteorological factors, the weather types that are prone to trigger O3 pollution were discussed,
providing a reference for O3
pollution warning and prevention in Haikou city.
2 Metadata of the Dataset
The metadata of Dataset of ozone pollution characteristics
and impact factors (2016-2020)[7] dataset is summarized in
Table 1. It includes the dataset??s full name, short name, authors, year of the
dataset, data format, data size, data files, data publisher, data sharing
policy, etc.
3 Methods
3.1 Primary
Data
The O3, CO, NO2, and corresponding
meteorological data (air pressure, air temperature, humidity, and wind speed)
from 2016 to 2020 used in this research are respectively from 4
state-controlled automatic air quality monitoring stations in Haikou
(distribution of stations is shown in Figure 1) and information center of
Hainan Meteorological Bureau. Four state-controlled sites respectively: Haida
site, Xiuying site, Haishi site, and Longhua site, the state-controlled
stations are representative, comparable, and holistic, and can reflect the
status of Haikou city air quality more accurately.
3.2
Algorism Principle
The evaluation of monitoring results refers to Environmental Air Quality Standard (GB 3095—2012)
and Technical Specification for
Environmental Air Quality Evaluation (TRIAL) (HJ 633—2012). The overall
pollution characteristics of O3 in Haikou city from 2016 to 2020 are statistically
analyzed based on the average O3-8h-90PER of 4 stations. CO-95PER and NO2
are used to analyze the relationship between O3 concentration and
precursors. O3-8h-90PER
and O3-1h of state-controlled sites are used to
study the monthly and daily changes of O3 pollution, respectively.
In addition, Spielman correlation coefficient method and Pearson correlation
coefficient method are used for correlation analysis of the relationship
between O3 and precursors and meteorological factors. Correlation
coefficient 0.1<∣r∣?? 0.3 is a
weak correlation, 0.3<∣r∣?? 0.5 is a moderate correlation, and∣r∣>0.5 is a
strong correlation.
Table 1 Metadata summary of the Dataset of ozone
pollution characteristics and impact factors (2016-2020)
|
Items
|
Description
|
|
Dataset
full name
|
Dataset
of ozone pollution characteristics and impact factors (2016-2020)
|
|
Dataset
short name
|
O3_Haikou2016-202
|
|
Authors
|
Cai,
J. Z., Ecological Environmental Protection Administrative Law Enforcement
Detachment of Haikou Comprehensive Administrative Law Enforcement Bureau,
caijz@haikou.gov.cn
Wan,
S. H., Haikou Bureau of Ecology and Environment, wangshaohui@haikou.gov.cn
Hu, J.
X., China Environmental Monitoring Station, hujx@cnemc.cn
|
|
Geographical
region
|
Haikou
city
|
|
Year
|
2016-2020
|
|
Data
format
|
.shp,
.xlsx
|
|
|
|
Data
size
|
33.9
KB
|
|
|
|
Data
files
|
It
consists of 9 data files. (1) geo-location of the sites; (2) monthly
concentration data of O3, CO, and NO2; (3) monthly and
annual O3 concentration at four monitoring sites; (4) daily
variation data of O3 concentration at four monitoring sites; (5) O3
concentration, air pressure, air temperature, humidity and wind speed data at
four monitoring sites.
|
|
Foundation
|
Haikou
Ecological and Environmental Bureau (HXSJ-CG-2021102)
|
|
Data
publisher
|
Global Change Research Data Publishing &
Repository, http://www.geodoi.ac.cn
|
|
Address
|
No.
11A, Datun Road, Chaoyang District, Beijing 100101, China
|
|
Data
sharing policy
|
Data from
the Global Change Research Data Publishing & Repository includes metadata, datasets
(in the Digital Journal of Global Change Data Repository), and
publications (in the Journal of Global Change Data & Discovery). Data sharing policy
include: (1) Data are openly available and can be freely downloaded via
the Internet; (2) End users are encouraged to use Data subject to
citation; (3) Users, who are by definition also value-added service
providers, are welcome to redistribute Data subject to written permission
from the GCdataPR Editorial Office and the issuance of a Data redistribution
license; and (4) If Data are used to compile new
datasets, the ??ten percent principal?? should be followed such that Data
records utilized should not surpass 10% of the new dataset contents, while
sources should be clearly noted in suitable places in the new dataset[8]
|
|
Communication and searchable system
|
DOI, CSTR, Crossref, DCI, CSCD,
CNKI, SciEngine, WDS/ISC, GEOSS
|
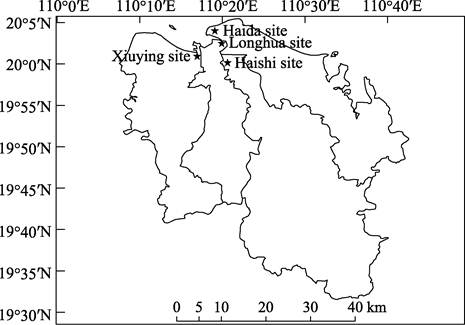
Figure 1 Four air quality monitoring stations in Haikou
city
4 Data Results and Validation
4.1
Data Composition
The dataset includes (1) geo-location of the sites; (2)
monthly concentration data of O3, CO, and NO2 in Haikou
from 2016 to 2020; (3) monthly and annual O3 concentration at four
monitoring sites from 2016 to 2020; (4) daily variation data of O3 concentration
at four monitoring sites from 2016 to 2020; (5) O3 concentration,
air pressure, air temperature, humidity, and wind speed data at four monitoring
sites. The dataset is archived in .shp and .xlsx data formats; it consists of 9
data files.
4.2
Data Products
4.2.1 Overall
Characteristics of O3 Pollution
Figure 2 shows the monthly changes of O3-8h-90PER average concentration, CO-95PER, and NO2 average
concentration from 2016 to 2020. It can be seen from Figure 2, that the
concentration peaks of O3 in each year appear from September to
December, which is 136, 163, 183, 178, and 156 ??g/m3,
respectively. The overall trend of O3 pollution increased year by
year from 2016 to 2019 and decreased in 2020. In addition, the peak of O3
concentration from 2017 to 2019 exceeded the secondary limit concentration
stipulated in the standard, which preliminarily indicated that O3
pollution in Haikou city was more severe in autumn and winter than in summer.
On the one hand, this phenomenon is related to the fact that Haikou is rainy in
summer, low solar radiation, and wet deposition are not conducive to O3 generation[9].
On the other hand, Hainan province may be affected by exogenous transmission,
as it is affected by surface cold high pressure control in autumn and winter,
the weather situation is stable, and the low-level northerly wind field is
controlled, . Under the joint action of local emission and exogenous transport,
O3 concentration increases[10]. In addition, as a tropical monsoon climate with moderate solar
radiation intensity and good photochemical reaction, Haikou city boasts the
relatively high temperature in autumn and is conducive to the O3
generation and accumulation. After December, with the intrusion of cold air
from northeast, the O3 concentration decreases, so O3
concentration reaches the peak from September to December. Compared with other
years, the average daily concentration of O3 in 2016 had the
smallest variation range, and its concentration was mainly distributed between
84 and 136 ??g/m3. The
concentration of O3 in 2017 had the largest variation range, and its
concentration was mainly distributed between 60 and 163 ??g/m3. Meanwhile, the concentration of O3
in 2016 and 2020 were below the secondary limit. The O3
concentration were generally low.
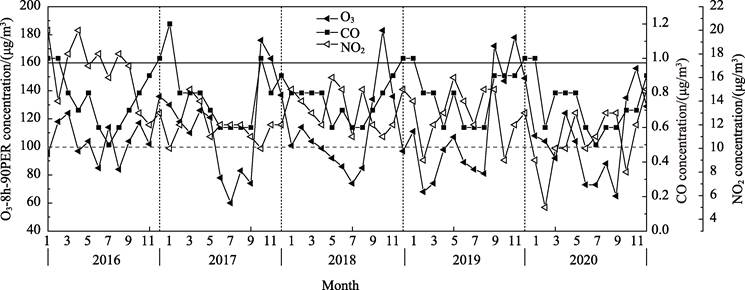
Figure 2 Monthly
variations of O3-8h and CO and NO2 from 2016 to 2020 (grey
dashed line: the primary limit of 100 ??g/m3, black line: the
secondary limit of 160 ??g/m3)
Figure 2 shows the correlation coefficient
between O3-8h and the concentration of CO and NO2. It could
be seen that the correlation coefficient between O3 and CO was 0.552, indicating a strong positive
correlation and that between O3 and NO2 was -0.14, indicating a
weak negative correlation (Table 2). From the view of the monthly average
concentration
|
Table 2 The
correlation coefficient between O3-8h concentration and precursor
concentration in 2016-2020
|
|
Category
|
Correlation index
|
p value
|
|
O3-CO
|
0.552
|
p<0.01
|
|
O3-NO2
|
-0.14
|
p>0.05
|
distribution of CO and O3, CO and O3
showed positive phase changes in most periods from 2016 to 2020. In 2016, both
CO and O3 had their highest concentration values in December. In
2017- 2020, when O3 concentration increased sharply
in October and November, the concentration of CO in the corresponding period
also showed an obvious increase. From the perspective of O3
photochemical formation process, CO is constantly oxidized, so in most cases,
CO and O3 are negatively correlated[11], while Haikou is
positively correlated, which is speculated to be related to the pollution
degree of air mass[12]. In addition, with the rapid growth of vehicles
in Haikou city, a great deal of automobile exhaust emissions make the amount of
CO increase, causing pollution to the air environment. The variation trend of O3
concentration is affected by many factors such as precursor concentration,
meteorological conditions, and chemical reactions. In terms of the monthly mean
concentration distribution of NO2 and O3, they showed
negative phase change in all months except February and March in 2016, negative
phase change in most periods from 2017 to 2020, and positive phase change in a
short period in summer. In Hainan province, because of high summer temperature
and sufficient sunshine duration, photochemical reactions occur under the influence
of strong solar radiation, so O3 concentration usually reaches the
annual maximum value[13]. However, summer in Hainan province is the
primary flood season with abundant rainfall. The erosion of rain and high
relative humidity both inhibit the photochemical reaction to some extent and
weaken the influence of NO2 and O3, so O3
concentration does not reach the maximum in summer[14,15]. In
addition, when the concentration of CO and NO2 reached a relatively
stable plateau, O3 concentration still fluctuated, which reflected
the complexity of factors influencing O3 concentration change in
Haikou city. The precursor could not fully represent the occurrence of O3
pollution, so it was necessary to further analyze the temporal variation
characteristics of O3 concentration and the influence of
meteorological factors.
The monthly mean
concentration of O3-8h-90PER for
the Haida site, Xiuying site, Haishi site, and Longhua site during 2016-2020 were
statistically analyzed, and the outline diagram of the O3
concentration of each station was drawn with the maximum, minimum, and average
values as characteristic values (Figure 3). In our study, the average values of
the maximum O3 concentration at the
Haida site, Xiuying site, Haishi site, and Longhua site were 105, 85, 94, 109,
92 ??g/m3, and the average
values of the minimum O3 concentration were 53, 36, 31, 36, 31??g/m3, respectively. The O3
concentration were 74, 62, 55, 64, and 60 ??g/m3
by average analysis of the average values of each site. As can be seen from the
above O3 concentration data,
compared with developed areas such as Guangdong and Chengdu province, the O3
pollution level in Haikou city had not reached a significantly high pollution
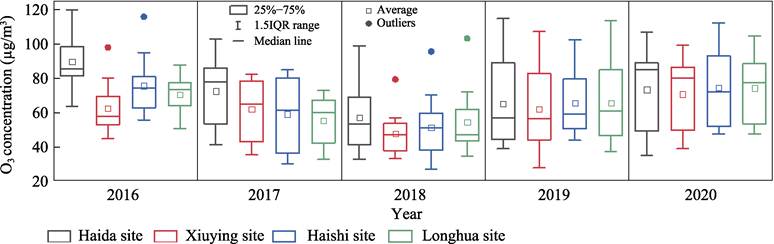
Figure 3 2016-2020 annual average O3
concentration of four urban testing sites
level[15,16,17]. According to the analysis of the O3
concentration of the four sites, the Haida site was in the high-value area in
2016, while the Xiuying site was in the low-value area. From 2017 to 2020, the
high-value area and the low-value area were no longer noticeable, indicating
that the area scope of O3 pollution in the urban area of Haikou was
expanding.
4.2.2 Time-varying
Characteristics of O3 Concentration
4.2.2.1 Monthly Variation Characteristics of Point Position
Figure 4 shows the monthly variation of the mean
concentration of O3-8h-90PER
at state-controlled monitoring sites from 2016 to 2020. According to the spring
(March to May), summer (June to August), autumn (September to November), and winter
(December to the next February) classification. It could be seen that the
seasonal variation of O3 was apparent.
The peak value of O3
concentration at the four sites occurred frequently in October- December
(autumn and winter), in which the average maximum value of O3 in 2016 and 2017 appeared in
December, the average maximum value of O3
in 2018 appeared in October, and the average maximum value of O3 in 2019 and 2020 appeared in
November. This is consistent with the time range of the peak O3 concentration in Haikou city from
2016 to 2020. This is different from cities with severe air pollution in China.
For example, O3 concentration in Guangdong and Shanghai in summer is
higher than that in autumn and winter[15,16,18,19]. The high concentration of O3 in
Haikou city in autumn and winter was mainly due to the northeast wind in
winter, which was easily affected by inland pollution transport. Besides, the
temperature in autumn was not low, and the photochemical reaction conditions
were good, which was conducive to the generation of O3[5].
In addition, Haikou city
has frequent typhoons in October, and the pollutants are not easy to diffuse
under the action of external downdraft. Further analysis found that in July
2016 and May 2017—each site??s O3 concentration was on a decline
trend, August 4, 2020—a downward trend, refer to the corresponding climate data
showed that during the period while the temperature was higher, the Haikou city
was mainly influenced by the southwest monsoon, clean air from the ocean of air
dilute the atmosphere in Haikou city. The regional climate difference was the
main reason why the time distribution of O3 in Haikou was different
from that in inland cities. It can also be seen from Figure 4, that O3
in January-February 2016 was in a rising stage, while all other years were in a
declining stage. O3 concentration in January-March 2019 was lower
than that in other years, indicating that it was necessary to deal with O3
spring pollution in advance.
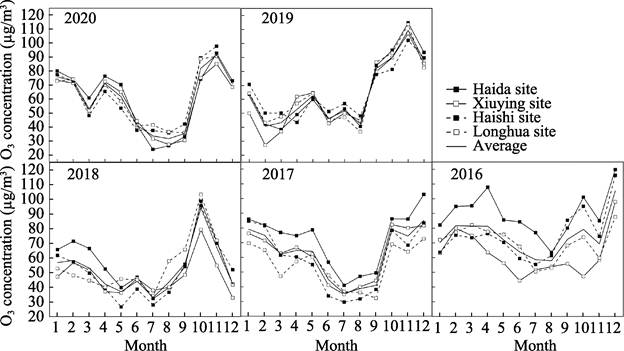
Figure 4 Monthly
variations of O3 average concentration at national monitoring sites
from 2016 to 2020
In addition, O3
from August to October 2016 to 2020 presented a trend of aggravation, with a
significantly higher growth rate than in other months, further highlighting the
severity of the pollution situation in autumn, indicating that this period was
the key period for O3 pollution prevention and control.
4.2.2.2 Diurnal Variation Characteristics of Point
Position
Figure 5 shows the diurnal variation of O3-1h mean concentration at the
state-controlled monitoring sites from 2016 to 2020. It could be seen that the
variation characteristics of O3 concentration at the four stations were
single-peak type, and the maximum O3 concentration from 14:00 to 16:00 throughout the day,
which was similar to the diurnal variation pattern of O3
concentration in other cities in China[20,21]. This variation was
due to the daily budget mechanism of O3 and was related to the
photochemical reaction rate and atmospheric diffusion capacity. The
concentration of O3 from 00:00 to 8:00 showed a trend of continuous
decline and decreased to the lowest value at 8:00, with a trough value. This is
because the anthropogenic activities weakened during this period, the emissions
of precursor substances decreased, the night temperature was low, and the
photochemical reaction was almost zero. O3
is mainly consumed, and its budget is negative, so it remains in the range of
low concentration value. The concentration of O3 from 8:00 to 16:00
showed a trend of continuous rise and reached the peak concentration in a day.
This is because the solar radiation intensity keeps increasing after sunrise,
and the temperature gradually rises. In addition, the concentration of O3
precursor produced by transportation sources, industrial sources, and
biological sources increases, and the photochemical reaction rate increases.
After 16:00, O3 concentration gradually returned to the low range;
this is mainly due to the solar radiation after 16:00 started to wane, vertical
mixing, horizontal divergence strengthened and weakened photochemical reaction,
and NO peak emissions during rush hour consumes O3, the accumulation
of the O3 return to give way to consumption function, with balance
negative. Then a concentration decreases continuously, and the cycle continues[17,22].
In addition, the overall level of O3 daily concentration in 2019 was
higher than that in other years, which may be related to the strengthening of
urban emissions and meteorological conditions.
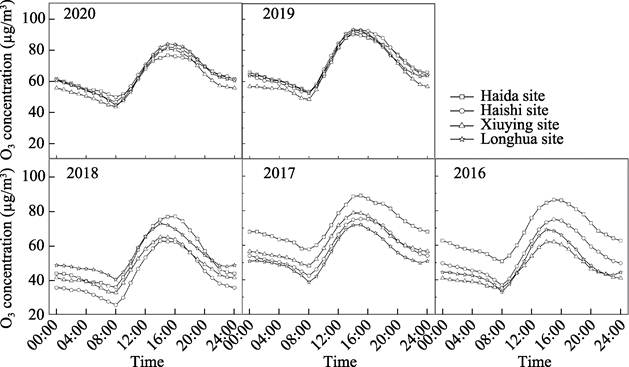
Figure 5 Daily variations of O3 average
concentration at national monitoring sites from 2016 to 2020
4.2.3 Influence
of Meteorological Factors on Typical O3 Pollution Days
Meteorological factors can affect the formation,
transmission, settlement, and dissipation of O3. Based on the
analysis of the above results, it could be known that the high-incidence period
of O3 pollution in Haikou city was autumn and winter (September to
December). To better study the relationship between O3 concentration
and meteorological factors, the O3-8h concentration data and
meteorological factor data of the same period from September to December 2016
to 2020 from four state-controlled monitoring stations were selected for
analysis, and the correlation coefficients between O3-8h and various
meteorological factors were calculated (Table 3). The characteristics of
meteorological factors that easily trigger O3 pollution weather in
Haikou city were obtained.
Table 3 Correlation coefficient between O3
and various meteorological factors
|
|
O3-pressure
|
O3-temperature
|
O3-humidity
|
O3-wind speed
|
|
Monitoring site
|
Correlation index
|
p value
|
Correlation index
|
p value
|
Correlation index
|
p value
|
Correlation index
|
p value
|
|
Haida site
|
0.398
|
p>0.05
|
0.417
|
p>0.05
|
-0.539
|
p<0.05
|
0.630
|
p<0.01
|
|
Haishi site
|
0.216
|
p>0.05
|
0.374
|
p>0.05
|
-0.170
|
p>0.05
|
0.327
|
p>0.05
|
|
Longhua site
|
0.244
|
p>0.05
|
0.032
|
p>0.05
|
-0.425
|
p>0.05
|
0.454
|
p<0.05
|
|
Xiuying site
|
0.553
|
p<0.01
|
0.193
|
p>0.05
|
-0.622
|
p<0.01
|
0.297
|
p>0.05
|
4.2.3.1
Influence
of Air Pressure and Temperature on O3 Pollution
Figure 6 shows the changes of ozone and air pressure, and
temperature at national monitoring sites. It can be seen that O3 concentration in Haikou is positively correlated with air
pressure and temperature. Quantitative analysis of the relationship between
them (Table 2) showed that the correlation coefficient between O3
concentration and air pressure is positive. However, only the positive
correlation at the Xiuying site passed the significance test (p<
0.01), and the correlation between O3 concentration and air pressure
was weak at other three stations. The correlation coefficient between O3
concentration and the air temperature was positive, but the correlation
coefficient between O3 concentration and air temperature at four
stations did not pass the significance test (p>0.05). Haikou city is
located at the tropical edge of low latitude and has a tropical maritime
monsoon climate. It is cool in autumn, and the temperature is lowerthan that in
spring and summer. In winter, due to the southward extension of the continental
cold air mass, there often invades cold airflow, which indicates that the main
meteorological factors affecting the change of O3 concentration in
Haikou city from September to December are not atmospheric pressure and
temperature.

Figure 6 Changes of ozone and air pressure and temperature
at national monitoring sites
4.2.3.2 Influence of Humidity and
Wind Speed on O3 Pollution
Figure 7 shows the change of O3 concentration, humidity, and wind speed at the
state- controlled monitoring site. It could be seen that O3 concentration was negatively correlated with
humidity and positively correlated with wind speed. Quantitative analysis of
the relationship between O3 concentration, humidity, and wind speed (Table 2) manifested
that the correlation coefficient between O3 and humidity at all monitoring stations was
negative. There was a significant negative correlation between O3 concentration and humidity at the Haida site??p<0.05??, while there was a strong negative correlation between O3 concentration and humidity at the Xiuying site??p<0.01??.The correlation coefficients between O3 and wind speed at all monitoring stations were
positive. There was a significant positive correlation between O3 concentration and wind speed at the Longhua
site??p<0.05??and a strong
positive correlation between O3 concentration and wind speed at the Haida
site??p<0.01). It indicated that from September to December,
the change of O3 concentration in Haikou city was more likely to be
negatively affected by humidity and positively affected by wind speed.

Figure 7 Changes of ozone and wind speed and humidity at
national monitoring sites
Haikou
is prone to heavy rain in autumn and sometimes cloudy in winter, so the O3
concentration and humidity trend in Haikou is opposite from September to
December. Wind speed can reflect pollutant transport efficiency and removal
efficiency[23]. The increase of wind speed has dual effects on O3
concentration, which occurs simultaneously. Firstly, the air mass transport
power increases, the height of the atmospheric boundary layer increases and the
vertical momentum transport is enhanced, all that are conducive to the
transmission of O3 from the upper region to the ground. When
accumulation remains dominant in local areas, the concentration of O3
will increase. Secondly, the horizontal diffusion effect is enhanced. When it
is dominant, the increase of wind speed accelerates O3 dilution[24].
When the wind speed decreases, its scavenging effect on O3 is
limited, and the cumulative effect is dominant, increasing the concentration of
O3[25]. It can be seen from Figure 8 the wind speed
monitored by the four state-controlled sites from September to December 2016-2020 ranges from
0.1 to 3.8 m·s–1. The wind
speed was low, and the vertical downward transport effect of O3 was
stronger than the horizontal diffusion effect, which was conducive to the
accumulation of O3. Therefore, there is a positive correlation
between O3 concentration and wind speed in Haikou from September to
December. On the basis of strengthening the existing pollution prevention and
control in Haikou city, strengthening joint prevention and control with
upper-level regions is the key to effectively control O3 secondary
pollution.
To
sum up, in autumn and winter (September to December) when O3
pollution occurs frequently, the influence of meteorological factors on O3
concentration is in the following order—humidity > wind speed > air
pressure > temperature. It indicated that humidity and wind speed were the
main meteorological factors affecting O3 pollution in Haikou city in
autumn and winter. On the whole, low humidity and low wind speed were prone to
O3 pollution. The change of O3 concentration was affected
by many factors, such as precursors, atmospheric fine particles, and
meteorological factors, and the changing process was a complex and
comprehensive interaction process. Therefore, the influence of meteorological
factors on O3 concentration was inevitably affected by other
non-meteorological factors and the interaction between meteorological factors.
Consequently, in the study of O3 pollution characteristics and
meteorological impact, to improve the accuracy of O3 pollution
prevention and control in Haikou city, we must consider the role of various
possible factors, adjust pollution prevention and control strategies timely, and
strengthen the cooperative control of multiple regions.
5 Discussion and Conclusion
(1) From 2016 to
2020, the peak occurrence period of O3 concentration in Haikou city
is significantly different from other inland cities, mainly appearing in autumn
and winter, from October to December. Regional climate difference is the main
reason for the different time distribution of O3 in Haikou from that
in inland cities.
(2)
The diurnal variation of O3 concentration presents a prominent single-peak
characteristic, with a trough value at 8:00 and a peak value from 14:00 to
16:00. According to the characteristic value of O3 concentration, the scope of O3
pollution in urban areas has
gradually expanded and worsened in recent years.
(3)
O3
concentration is positively correlated with CO concentration and wind speed,
negatively correlated with humidity. Air pressure and temperature are not the
main meteorological factors affecting O3 concentration change in Haikou city in autumn
and winter .
(4)
In line with the feature of O3 pollution in Haikou city, a series of measures have been
taken, such as stimulating the purchase of new energy vehicles, encouraging the
district government and relevant departments to establish a responsibility
system, industrial enterprises to implement a staggered rush
hour production plan and motor vehicle peak shifting travel, improving
pollution prevention and control measures of the third service catering
enterprises , strengthening the environmental monitoring and supervising
capacity, promoting joint prevention and control with upper-level regions. O3 pollution in Haikou city is expected to be
improved.
Author Contributions
Cai, J. Z. designed the algorithms of the dataset. Wang, S. H. contributed to the
data collecting and processing. Hu, J. X. wrote the data paper.
Conflicts of Interest
The
authors declare no conflicts of interest.
References
[1] Wang,
T., Xue, L. K., Brimblecombe, P., et al.
Ozone pollution in China: a review of concentrations, meteorological influences,
chemical precursors, and effects [J]. Science of the Total Environment,
2017, 575: 1582–1596.
[2] Ministry
of Ecology and Environment. 2019 China??s Ecological and Environmental Status
Bulletin [EB/OL]. (2020-06-02) [2021-5-7].
http://www.mee.gov.cn/hjzl/sthjzk/zghjzkgb/202006/P020200602509464172096.pdf.
[3] Yang,
L., Luo, H., Yuan, Z., et al.
Quantitative impacts of meteorology and precursor emission changes on the long-term
trend of ambient ozone over the pearl river delta, China, and implications for ozone
control strategy [J]. Atmospheric Chemistry and Physics, 2019, 19:
12901–12916.
[4] Jacob,
D. J., Winner, D. A. Effect of climate change on air quality [J]. Atmospheric
Environment, 2009, 43(1): 51–63.
[5] Xu, W.
S., Xing, Q., Meng, X. X., et al.
Characteristics of ozone pollution in Haikou city [J]. China Environmental
Monitoring, 2017, 33(4): 186–193.
[6] Fu, C.
B., Dan, L., Tong, J. H., et al.
Variation characteristics of ozone concentration in Haikou urban area during
2013–2018 [J]. China Environmental
Monitoring, 2020, 36(5): 38–46.
[7] Cai, J.
Z., Wang, S. H., Hu, J. X., et al.
Dataset of ozone pollution characteristics and impact factors (2016–2020)
[J/DB/OL]. Digital Journal of Global
Change Data Repository, 2022. https://doi.org/10. 3974/geodb.2022.05.04.V1.
https://cstr.escience.org.cn/CSTR:20146.11.2022.05.04.V1.
[8] GCdataPR
Editorial Office. GCdataPR data sharing policy [OL]. https://doi.org/10.3974/dp.policy.2014.05
(Updated 2017).
[9] Awang,
N. R., Ramli, N. A., Yahaya, A. S., et al.
Multivariate methods to predict ground-level ozone during the daytime, nighttime,
and critical conversion time in urban areas [J]. Atmospheric Pollution
Research, 2015, 6(5): 726–734.
[10] Fu, C.
B., Chen, Y. L., Dan, L., et al.
Temporal and spatial variation of atmospheric NO2 in Hainan island
in recent 10 Years and analysis of pollutant
sources [J]. Environmental Science, 2015, 37(9): 18–24.
[11] Cao,
T. W., Wu, K., Kang, P., et al.
Characteristics and influencing factors of ozone pollution in Chengdu-Chongqing
urban agglomeration [J]. Chinese Journal of Environmental Science, 2017,
38(4): 1275–1284.
[12] Yang,
Y. X., Chen, N. H., Hu, B. Y., et al.
Characteristics and influencing factors of ozone pollution in clean islands on the west coast of Taiwan strait [J]. Environmental
Chemistry, 2020, 39(7): 1733–1743.
[13] Fu, C.
B., Xu, W. S., Dan, L., et al.
Effects of precursors and meteorological factors on ozone pollution in Hainan province
[J]. Environmental Science and Technology, 2020, 43(7): 45–50.
[14] Dong,
H., Cheng, L., Wang, H. Y., et al.
Analysis of ozone pollution characteristics and meteorological influencing factors in Anhui province [J]. China
Environmental Monitoring, 2021, 37(1): 58–68.
[15] Xu,
K., Liu, Z. H., He, M. Q., et al.
Meteorological characteristics of near-surface ozone pollution in Chengdu city
in summer [J]. China Environmental Monitoring, 2018, 34(5): 41–50.
[16]
Shen, J., Huang, X. B., Wang, Y., et al. Characteristics and sources of
ozone pollution in Guangdong province [J]. Chinese Journal of Environmental
Science, 2017, 37(12): 4449–4457.
[17]
Wu, K., Kang, P., Wang, Z. S., et al. Analysis of ozone pollution characteristics and
meteorological causes in Chengdu city [J]. Journal of Environmental Science,
2017, 37(11): 4241–4252.
[18]
Liu, Z., Zhu, Y. F., Guo, W. K., et al. Ozone and secondary organic
aerosol generation potential of VOCs emission from fossil fuel combustion
sources in Lanzhou city [J]. Environmental science, 2019, 40(5): 2069–2077.
[19]
Zhao, C. H., Geng, F. H, Ma, C. Y., et al. Study on aerosol characteristics
of photochemical pollution in Shanghai area [J]. China Environmental Science,
2015, 35(2): 356–363.
[20]
Pan. B. F., Cheng, L. J., Wang, J. G., et al. Characteristics and source
analysis of ozone pollution in Beijing-Tianjin-Hebei region [J]. China
Environmental Monitoring, 2016, 32(5): 17–23.
[21]
Yu, S. J., Yin, S. S., Zhang, R. Q., et al. Analysis of ozone pollution
characteristics and meteorological factors in Zhengzhou city [J]. China
Environmental Monitoring, 2017, 33(4): 140–149.
[22] Song,
X. Y., Gao, L. Z., Luo, D., et al.
Analysis of ozone pollution characteristics and meteorological impact in Yunnan
province [J]. China Environmental Monitoring, 2020, 36(4): 16–28.
[23] Yan.
R. S., Chen, M. D., Gao, Q. X., et al.
Distribution characteristics and influencing factors of typical ozone pollution
in Beijing in summer [J]. Environmental Science Research, 2013(1): 47–53.
[24] Xie,
W. J., Wang, S. F., He, L. Y., et al.
Characteristics of ozone pollution and its relationship with meteorological
elements in Guigang city during 2015–2019 [J]. Meteorological Research and
Application, 2021, 42(1): 58–62.
[25] Li, S.
J., Li, H., Chen, M., et al. Influence
of meteorological factors on ozone and its precursors in the atmosphere of
Southwest urban area of Xi??an [J]. Journal of Meteorology and Environment,
2018, 34(4): 59–67.