Raster Dataset of Extreme Temperature in the Coastal Area of China
Wang, X. L.1,2 Hou, X. Y.1,2*
1. Yantai Institute of Coastal Zone Research, Chinese Academy of Sciences, Yantai 264003, China;
2. Key Laboratory of Coastal Environmental Processes and Ecological Remediation, Chinese Academy of Sciences, Yantai 264003, China
Abstract: With large population density, rapid urbanization process and high-speed economic development, the coastal area of China is prone to vulnerable to climate change because of the frequently nature disasters and fragile eco-environment. Based on daily maximum and minimum temperature of 156 meteorological station records from 1961 to 2014, 16 extreme temperature indices including cool days (TX10p), cool nights (TN10p), warm days (TX90p), warm nights (TN90p), frost days (FD0), ice days (ID0), summer days (SU25), tropical nights (TR20), maximum value of daily maximum temperature (TXx), maximum value of daily minimum temperature (TNx), minimum value of daily maximum temperature (TXn), minimum value of daily minimum temperature (TNn), warm spell duration index (WSDI), cold spell duration index (CSDI), growing season length (GSL) and diurnal temperature range (DTR) were calculated by RClimDex model, respectively. And Inverse Distance Weight interpolation method was employed to produce the extreme temperature raster dataset, which includes two types of raster data, the first of which refers to the multi-year average, and the other is the inter-annual magnitude in 16 extreme temperature indices in the coastal area of China during 1961–2014. With an 8.934 km spatial resolution, the dataset is archived in .tif format, including 32 sets of data files, with the data size of 12.5 MB (compressed to 1 .zip file, 2.15 MB). Related research results of this dataset were published in the Acta Ecologica Sinica, 2017, Volume 37, Issue 21.
Keywords: coastal area of China; extreme temperature; multi-year average; inter-annual magnitude; 1961–2014; Acta Ecologica Sinica
1 Introduction
Within the context of global warming, extreme temperature events such as heatwaves and cryogenic freezing have occurred frequently in the coastal area of China, which have caused serious impacts on regional ecological environment protection, socio-economic sustainable development as well as people’s properties and lives[1-4]. Based on daily maximum and minimum temperature dataset of 156 meteorological station records from 1961 to 2014 in the coastal area of China, time series of 16 extreme temperature indices (Table 1) were performed by the software RClimDex[5], and then the multi-year average and inter-annual magnitude[6] in all extreme temperature indices were worked out on the meteorological site scale during the considering period. Furthermore, raster dataset of multi-year average and inter-annual magnitude in extreme temperature indices in the coastal area of China from 1961 to 2014[7] were produced using Inverse Distance Weight interpolation method in ArcGIS software. Raster dataset of extreme temperature is expected to raise awareness of the temporal and spatial patterns of extreme temperature events in the coastal area of China.
Table 1 Definitions of extreme temperature indices
|
Indicator name
|
ID
|
Definitions
|
Unit
|
|
Cool days
|
TX10p
|
Days when daily maximum temperature <0.1 fractiles
|
d
|
|
Cool nights
|
TN10p
|
Days when daily minimum temperature <0.1 fractiles
|
d
|
|
Warm days
|
TX90p
|
Days when daily maximum temperature >0.9 fractiles
|
d
|
|
Warm nights
|
TN90p
|
Days when daily minimum temperature >0.9 fractiles
|
d
|
|
Frost days
|
FD0
|
Annual days when daily minimum temperature <0 oC
|
d
|
|
Ice days
|
ID0
|
Annual days when daily maximum temperature <0 oC
|
d
|
|
Summer days
|
U25
|
Annual days when daily maximum temperature >25 oC
|
d
|
|
Tropical nights
|
TR20
|
Annual days when daily minimum temperature >20 oC
|
d
|
|
Max Tmax
|
TXx
|
Monthly maximum value of daily maximum temperature
|
oC
|
|
Max Tmin
|
TNx
|
Monthly maximum value of daily minimum temperature
|
oC
|
|
Min Tmax
|
TXn
|
Monthly minimum value of daily maximum temperature
|
oC
|
|
Min Tmin
|
TNn
|
Monthly minimum value of daily minimum temperature
|
oC
|
|
Warm spell duration index
|
WSDI
|
Annual days with at least 6 consecutive days when daily maximum temperature >0.9 fractiles
|
d
|
|
Cold spell duration index
|
CSDI
|
Annual days with at least 6 consecutive days when daily minimum temperature <0.1 fractiles
|
d
|
|
Growing season length
|
GSL
|
Annual days between first span of at least 6 days with daily mean temperature >5 oC after winter and first span after 1st July of 6 days with daily mean temperature <5 oC
|
d
|
|
Diurnal temperature range
|
DTR
|
Monthly mean difference between daily maximum temperature and daily minimum temperature
|
oC
|
2 Metadata of Dataset
The metadata of “Extreme temperature grid dataset in coastal area of China”[7] is summarized in Table 2, which includes the dataset full name, short name, authors, geographical region, data period, data format, data files, data size, foundation, data publisher, and data sharing policy, etc.
3 Methods
The meteorological records, including daily maximum and minimum temperature of 244 meteorological stations in the coastal area of China, provided by the National Meteorological Information Center, China Meteorological Administration (http://data.cma.cn/), was used to produce the raster dataset of extreme temperature. Based on the meteorological records, daily temperature data series were built using Matlab programming language, and then were through quality control by homogeneity assessment using the double-mass curve method[9]. Be founded on the principle of that the historical records were continuous and the duration was longer than 50 years, 156 meteorological stations (Figure 1) with daily maximum and minimum temperature from 1961 to 2014 were finally selected in the coastal area of China.
Table 2 Metadata summary of “Extreme temperature grid dataset in coastal area of China”
|
Items
|
Description
|
|
Dataset full name
|
Extreme temperature grid dataset in coastal area of China
|
|
Dataset short name
|
ExtremeTem_CoastalAreaChina
|
|
Authors
|
Wang, X. L. Y-7126-2018, Yantai Institute of Coastal Zone Research, Chinese Academy of Sciences, xlwang@yic.ac.cn
|
|
Hou, X. Y. L-6506-2016, Yantai Institute of Coastal Zone Research, Chinese Academy of Sciences, xyhou@yic.ac.cn
|
|
Geographical region
|
According to the division boundary of Chinese provincial administrative, the 14 provinces, municipalities and autonomous regions located in the eastern coast are identified (data is absent in Taiwan, the South China Sea islands and waters; and Beijing is included for ensuring the spatial integrity), including Liaoning, Hebei, Beijing, Tianjin, Shandong, Jiangsu, Shanghai, Zhejiang, Fujian, Guangdong, Hongkong, Macao, Guangxi, and Hainan.
|
|
Year
|
1961–2014 Data format .tif
|
|
Data size
|
12.5 MB Data files 32 .tif data files
|
|
Foundations
|
Chinese Academy of Sciences (XDA19060205, XDA11020205); National Nature Science Foundation of China (31461143032)
|
|
Data publisher
|
Global Change Research Data Publishing and Repository, http://www.geodoi.ac.cn
|
|
Address
|
No.11A, Datun Road, Chaoyang District, Beijing 100101, China
|
|
Data sharing policy
|
Data from the Global Change Research Data Publishing & Repository includes metadata, datasets (data products), and publications (in this case, in the Journal of Global Change Data & Discovery). Data sharing policy includes: (1) Data are openly available and can be freely downloaded from the Internet; (2) End users are encouraged to use Data subject to citation; (3) Users, who are by definition also value-added service providers, are welcome to redistribute Data subject to written permission from the GCdataPR Editorial Office and the issuance of a Data redistribution license; and (4) If Data are used to compile new datasets, the ‘ten percent principal’ should be followed such that Data records utilized should not surpass 10% of the new dataset contents, while sources should be clearly noted in suitable places in the new dataset[8]
|
Importing the meteorological data into RClimDex in the R software station by station, 16 extreme temperature indices were calculated out after data verification and parameter settings. And then time series of 16 extreme temperature indices at each meteorological station in the coastal area of China from 1961 to 2014 were all constructed by application of Matlab programming.
Multi-year average and inter-annual magnitude in extreme temperature index were calculated out using the arithmetic mean method and linear trend method on the meteorological station scale during 1961–2014, respectively. And a linear equation was employed to represent the historical trend of the extreme temperature index, namely:
 (1)
(1)
where Y represents the extreme temperature index, t is the time, a refers to the linear trend term, b is the constant term, and  represents the change of the extreme temperature index during every 10 a, namely inter-annual rate of change, in unit of oC/10a or d/10 a. Vector data in .shp format in terms of multi-year average and inter-annual magnitude of 16 extreme temperature indices at 156 meteorological stations in the coastal area of China were produced by ArcGIS software, and then raster data in .tif format was generated by extending the site data of each extreme temperature index at meteorological scale to continuous space using Inverse Distance Weight method.
4 Results
Take diurnal temperature range as an example, the spatial patterns of multi-year average and inter-annual magnitude presented in Figure 2 are analyzed in detail from 1961 to 2014.
The multi-year average and inter- annual magnitude of DTR varied from 4.28 °C to 14.06 °C and −0.71 °C /10a to 0.33 °C/10a through the coastal area of China, respectively. Spatially, the multi- year average of DTR exhibited a pattern of “south-low and north-high” while the inter-annual magnitude of DTR was characterized by “south-high and north-
low” generally.
|
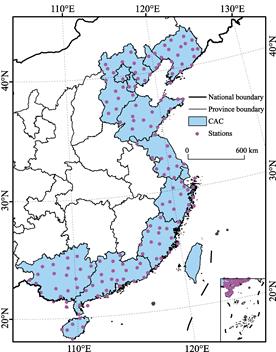
Figure 1 Distribution of 156 meteorological
stations in the coastal area of China (CAC)
|
For all extreme temperature indices[10], a similar spatial pattern of multi-year average was found in cool days, cool nights, warm days, warm nights, maximum value of daily maximum temperature, maximum value of daily minimum temperature, warm spell duration index, and cold spell duration index, and a generally gradient descent of multi-year average was observed in summer days, tropical nights, minimum value of daily maximum temperature, minimum value of daily minimum temperature and growing season length while a gradual increasing tendency in frost days, ice days and diurnal temperature range from south to north in the coastal area of China during 1961 to 2014.
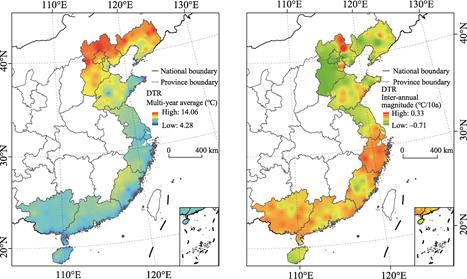
Figure 2 Distribution of multi-year average and inter-annual magnitude in diurnal temperature range (DTR) from 1961 to 2014 in the coastal area of China
Regarding to inter-annual magnitude, an upward trend in warm days, warm nights, summer days, tropical nights, maximum value of daily maximum temperature, maximum value of daily minimum temperature, minimum value of daily maximum temperature, minimum value of daily minimum temperature, warm spell duration index and growing season length, while a downward trend in cool days, cool nights, frost days, ice days cold spell duration index as well as diurnal temperature range were found in the coastal area of China from 1961 to 2014 generally. What’s more, the decadal trend rates of the night extremes such as cool nights and warm nights were obviously higher than those of the day extremes like cool days and warm nights.
5 Conclusion
Meteorological observations from surface stations are one of the data sources used to assess the climate change characteristics in historical periods. However, there are some limitations on the production of high spatiotemporal resolution dataset of meteorological elements and their extremes due to the differences of station construction time, station relocation, and sharable policies. In this study, the length of historical records exceeded more than 50 years, and the extreme temperature indices are diversified, which is sufficient for comprehensive evaluations on the spatial-temporal characters of the extreme temperature events in the coastal area of China.
Author Contributions
General idea and technical framework of this dataset production was proposed by Hou, X. Y. Wang, X. L. is responsible for downloading and pre-processing of meteorological data, calculating of extreme temperature indices and producing this dataset.
References
[1] Chen, T. G., Shi, X. J., Yu, K. F. Extreme air temperature events of February in South China area in the past 100 years [J]. Tropical Geography, 2008, 28(3): 199–202.
[2] Dong, S. C., Tan, S., Yang, W. Z., et al. Impacts of climate change on urban agglomerations in coastal region of China [J]. Advances in Climate Change Research, 2010, 6(4): 284–289.
[3] Jiao, N. Z., Chen, D. K., Luo, Y. M., et al. Climate change and anthropogenic impacts on marine ecosystems and countermeasures in China [J]. Advances in Climate Change Research, 2015, 6(2): 118–125.
[4] Wang, M. X., Yan, J. P., Li, S. S. Spatial-temporal variation and the tendency of droughts and floods on the southeast coast of China over 54 years [J]. Resources Science, 2014, 36(11): 2307–2315.
[5] Zhang, X. B., Yang, F. RClimDex (1.0), User Manual [Z]. Climate Research Branch, Environment Canada, 2004.
[6] Wang, Q., Zhang, M. J., Wang, S. J., et al. Extreme temperature events in Yangtze River Basin during 1962–2011 [J]. Acta Geographica Sinica, 2013, 68(5): 611–625.
[7] Wang, X. L., Hou, X. Y. Extreme temperature grid dataset in coastal area of China [DB/OL]. Global Change Research Data Publishing & Repository, 2018. DOI: 10.3974/geodb.2018.08.12.V1.
[8] GCdataPR Editorial Office. GCdataPR data sharing policy [OL]. DOI: 10.3974/dp.policy.2014.05 (Updated 2017).
[9] Mu, X. M., Zhang, X. Q., Gao, P., et al. Theory of Double Curves and Its applications in Hydrology and Meteorology [J]. Journal of China Hydrology, 2010, 30(4): 47–51.
[10] Wang, X. L., Hou, X. Y. Analysis of spatiotemporal variations and regional differences in extreme temperature events in the coastal area of China during 1961-2014 [J]. Acta Ecologica Sinica, 2017, 37(21): 7098–7113.