CAI Diwen ZHANG Yingqian LUO Wenhui LIANG Jiahong AI Zeying DONG Zhaoji SHANG Zhihai*
School of Geographical Sciences, Lingnan Normal
University, Zhanjiang 524048, China
Abstract: In view of the potential threat of grassland
degradation to ecological security and food security in arid and semi-arid
regions of Northwest China, it is important to objectively quantify and
evaluate the degree of grassland degradation to protect and sustainably utilize
grassland resources. Using remote sensing and climatic data, the authors
established an objective method to assess grassland degradation, taking
climatic production potential as the natural baseline. This yielded a 500-m CPPmax
dataset of arid and semi-arid region in Northwest China (2001–2023). Based on
this, they further developed datasets of grassland degradation degree for the
entire 2001–2023 period and for 5-year intervals within it. All three datasets
share a spatial resolution of 500 m. By
introducing objective natural baselines, these datasets effectively address critical
challenges in current grassland degradation assessment, including inconsistent
baseline definitions and difficulty in cross-study comparisons. The datasets are
archived in .tif, .xlsx, .txt data formats, and consists of 160 data files with
data size of 549.3 MB (compressed into 3 files with 249.9 MB).
Keywords: grassland
degradation; climatic production potential; natural baseline; arid and
semi-arid region of Northwest China
DOI: https://doi.org/10.3974/geodp.2026.04.11
Dataset Availability Statement:
The dataset supporting
this paper was published and is accessible through the Digital Journal of
Global ChangeData Repository at:
https://doi.org/10.3974/geodb.2025.11.03.V1,
https://doi.org/10.3974/geodb.2025.11.04.V1, https://doi.org/10.3974/geodb.2025.11.05.V1.
1 Introduction
The vast grassland resources
in the arid and semi-arid region of Northwest China are not only important
bases for animal husbandry, but also provide important means of production for
the local people. The health status of the grassland resources has a profound
influence on the sustainable development and ecological security of the region,
and has important ecological benefits and economic values. Over the past two
decades, the government has implemented a series of ecological projects,
including the Grain for Green Program, Grassland Restoration Program, and
Grassland Ecological Protection Subsidy and Incentive Program, which have
initially curbed the continuous deterioration of grassland ecosystems[1].
However, with consideration of climate change, the grassland in the region is
still facing severe degradation pressure due to infrastructure construction,
expansion of agricultural land area, overgrazing, unreasonable utilization of
groundwater resources, and the inherent fragility of the grassland ecosystem[2,3].
Therefore, it is necessary to strengthen the research on the construction of
the evaluation system of grassland health and grassland degradation to evaluate
the status of grassland degradation and protection. The current assessment
metrics for grassland degradation lack uniformity, with varying comparison
baselines and research scales, making it difficult to conduct cross-study
comparisons of quantified degradation levels[4–6]. Therefore, it is
practically significant to determine the objective and unified reference
baseline for the grassland degradation assessment, and it is also crucial to
formulate the overall plan of grassland resource protection and sustainable
utilization.
In current research on quantifying grassland
degradation, 3 reference baselines, i.e., natural, historical, and target, are
predominantly employed[3,7–10]. The target baseline is greatly
influenced by subjective factors, such as the specific standards set for fenced
conservation areas or nature reserves, which are usually limited to a local
scope and are difficult to compare cross-regionally. Although the historical
baseline is relatively objective, the selection of reference years involves a
degree of arbitrariness, and the results are susceptible to environmental
fluctuations. Natural baseline has a certain theoretical basis, and the
statistical method is rigorous, which can effectively separate the interference
of human activities, so it has high objectivity. Climatic Production Potential
(CPP) denotes the maximum net primary productivity (NPP) of vegetation,
determined by environmental factors such as light, temperature, water, and
nutrients in the absence of human interference[11,12]. It
dynamically couples with climate change and aligns spatially with the evaluated
region. This baseline combines dynamic adaptability and objectivity, making the
maximum CPP over a period ideal for a natural reference baseline[4,6].
To quantify grassland degradation in arid and
semi-arid regions of Northwest China, this study integrates regional
remote-sensing and climate data and employs multiple classical empirical models
for estimating CPP, including the Miami model[13], the Thornthwaite
Memorial model[11], and a Composite model[14]. On this
basis, a grassland degradation dataset was developed using CPP as the natural
reference baseline. It is intended that this framework will address key
challenges in existing grassland degradation assessments, such as inconsistent
comparison baselines and limited cross-regional comparability of evaluation
results, thereby providing robust data support for regional grassland
degradation assessment and the sustainable management of grassland resources.
2 Metadata of the Dataset
The metadata of 500-m CPPmax dataset of arid and semi-arid
region in Northwest China (2001–2023)[15], 500-m/annual GDI dataset
in the arid and semi-arid region of Northwest China (2001–2023)[16], and 500-m raster and 5-year step dataset
of classified grassland degradation in the arid and semi-arid region of
Northwest China (2001–2023) [17] is summarized in Table 1. It
includes the dataset’s names, authors, geographical region, spatial-temporal
resolution, dataset composition, data publisher, and data sharing policies, etc.
Table 1 Metadata
summary of grassland productivity and degradation datasets in the arid and
semi-arid region of Northwest China
|
Items
|
Description
|
|
Dataset full name
|
500-m CPPmax
dataset of arid and semi-arid region in Northwest China (2001–2023)
|
|
Dataset short
name
|
NW_CPPmax
|
|
Authors
|
Cai, D. W.,
Lingnan Normal University, caidw@lingnan.edu.cn
Zhang, Y. Q.,
Lingnan Normal University, 1135862445@qq.com
Luo, W. H.,
Lingnan Normal University, 798138577@qq.com
Liang, J. H.,
Lingnan Normal University, liang.jiahong@foxmail.com
Ai, Z. Y.,
Lingnan Normal University, 3252154181@qq.com
Dong, Z. J.,
Lingnan Normal University, dzj3266851472@163.com
Shang, Z. H.,
Lingnan Normal University, shangzhihai@126.com
|
|
Geographical
region
|
Arid and
semi-arid region in Northwest China
|
|
Year
|
2001–2023
|
|
Spatial
resolution
|
500 m
|
|
Data format
|
.tif, .txt
|
|
Data size
|
16.4 MB (after
compression)
|
|
Data files
|
The maximum value
of the climatic production potential of the grassland in arid and semi-arid
regions of Northwest China in 2001–2023
|
|
Dataset full name
|
500-m/annual GDI
dataset in the arid and semi-arid region of Northwest China (2001–2023)
|
|
Dataset short
name
|
NW_GDI
|
|
Authors
|
Cai, D. W.,
Lingnan Normal University, caidw@lingnan.edu.cn
Zhang, Y. Q.,
Lingnan Normal University, 1135862445@qq.com
Luo, W. H.,
Lingnan Normal University, 798138577@qq.com
Liang, J. H.,
Lingnan Normal University, liang.jiahong@foxmail.com
Ai, Z. Y., Lingnan
Normal University, 3252154181@qq.com
Dong, Z. J.,
Lingnan Normal University, dzj3266851472@163.com
Shang, Z. H.,
Lingnan Normal University, shangzhihai@126.com
|
|
Geographical
region
|
Arid and
semi-arid region in Northwest China
|
|
Year
|
2001–2023
|
|
Temporal
resolution
|
Year
|
|
Spatial
resolution
|
500 m
|
|
Data format
|
.tif, .xlsx
|
|
Data size
|
228 MB (after
compression)
|
|
Data files
|
Spatial data of
annual grassland degradation degree during the 2001–2023; inter-annual variation data of regional
average grassland degradation degree
|
|
Dataset full name
|
500-m raster and
5-year step dataset of classified grassland degradation in arid and semi-arid
region of Northwest China (2001–2023)
|
|
Dataset short
name
|
NW_Recls_GDI
|
|
Authors
|
Cai, D. W.,
Lingnan Normal University, caidw@lingnan.edu.cn
Zhang, Y. Q., Lingnan
Normal University, 1135862445@qq.com
Luo, W. H., Lingnan
Normal University, 798138577@qq.com
Liang, J. H.,
Lingnan Normal University, liang.jiahong@foxmail.com
Ai, Z. Y.,
Lingnan Normal University, 3252154181@qq.com
Dong, Z. J.,
Lingnan Normal University, dzj3266851472@163.com
Shang, Z. H.,
Lingnan Normal University, shangzhihai@126.com
|
(To be continued on the next page)
(Continued)
|
Items
|
Description
|
|
Geographical
region
|
Arid and
semi-arid region in Northwest China
|
|
Year
|
2001–2023
|
|
Temporal
resolution
|
5-year
|
|
Spatial
resolution
|
500 m
|
|
Data format
|
.tif, .txt
|
|
Data size
|
5.55 MB (after
compression)
|
|
Data files
|
Classification
results of the entire time period (2001–2023) and the average classification results of
grassland degradation degree every 5 years (2001–2005, 2006–2010, 2011–2015, 2016–2020, and 2021–2023)
|
|
Foundation
|
National Natural
Science Foundation of China (42301003); Lingnan Normal University (ZL22032)
|
|
Data computing environment
|
Python 3.12,
ArcGIS 10.8
|
|
Data publisher
|
Global Change
Research Data Publishing & Repository, http://www.geodoi.ac.cn
|
|
Address
|
No. 11 A, Datun
Road, Chaoyang District, Beijing 100101, China
|
|
Data sharing
policy
|
(1) Data are
openly available and can be free downloaded via the Internet; (2) End users
are encouraged to use Data subject to citation; (3) Users, who are by
definition also value-added service providers, are welcome to redistribute Data
subject to written permission from the GCdataPR Editorial Office and the
issuance of a Data redistribution license; and (4) If Data are
used to compile new datasets, the “ten percent principle” should be followed
such that Data records utilized should not surpass 10% of the new
dataset contents, while sources should be clearly noted in suitable places in
the new dataset[18]
|
|
Communication and searchable system
|
DOI, CSTR,
Crossref, DCI, CSCD, CNKI, SciEngine, WDS, GEOSS, PubScholar, CKRSC, OARL
|
3 Methods
3.1 Data Sources
The development of these datasets requires 3 kinds of
data: remote sensing, climate, and basic geography.
The MODIS (Moderate-resolution Imaging Spectroradiometer)
dataset, including the net primary
productivity (NPP) dataset (MOD17A3HGF V6.1) and land cover dataset (MCD12Q1)
with a spatial resolution of 500 m from 2001 to 2023, has been employed. The
MOD17A3HGF dataset provides annual total estimates based on 8-day net photosynthetic
productivity, calculated from light energy utilization and photosynthetically
active radiation. The MCD12Q1 dataset provides 5 land cover/use classification
systems. In this study, the University of Maryland (UMD) land cover
classification scheme was adopted to identify grassland types, which is
consistent with the classification system used for deriving NPP data in the
MOD17A3 dataset[19]. To avoid the interference of land cover/use
change on the analysis of grassland degradation and ensure the comparability of
the results in different periods, only the stable grassland pixels (i.e., no
land cover change) in the whole study period are selected for analysis.
The climate dataset utilized China’s 1-km resolution monthly
precipitation dataset[20] and monthly average temperature dataset[21],
covering the period from 1901 to 2024. It was generated by applying the Delta
downscaling algorithm to integrate the global 0.5°
climate
dataset released by the Climatic Research Unit (CRU) of the UK National Centre
for Atmospheric Science and the global high-resolution climate dataset released
by WorldClim. The dataset was systematically validated using observational data
from 496 meteorological stations in China, with credible results[22].
The solar radiation data are sourced from the ERA5-land dataset developed by
the European Centre for Medium-Range Weather Forecasts (ECMWF)[23],
containing hourly surface meteorological data from 1979 to the present, with a
spatial resolution of 0.1°. This study extracted the
data covering 2001–2023 for these datasets’ development, and interpolated the
spatial resolution of climate data, aligning with the MODIS dataset grid by
using a bilinear algorithm.
Furthermore, the extent of the arid and semi-arid regions of
Northwest China was vectorized from the regionalization map of physical
geography depicted by ZHAO Songqiao[24] using ArcGIS software. The
administrative boundary data of the study area were downloaded from the
National Basic Geographic Information Center of the Ministry of Natural
Resources in the GeoJSON format. It
was rigorously converted to the Shapefile format for analysis using projection
tools, and the boundaries remained unaltered during the conversion process.
Finally, the administrative boundaries were spatially overlaid with the physical
geography regions to delineate the study area.
3.2 Algorithm
3.2.1 Estimation of Climatic Production Potential
Three empirical models, i.e., the Miami model,
Thornthwaite Memorial model, and the Composite model had been used to estimate
CPP during the development of these datasets. The Miami model estimates the CPP
based on temperature and precipitation data, which was initially developed
using global observational data; it has been widely adopted in large-scale and
even global climate production potential studies[13]. The
Thornthwaite Memorial model, while accounting for temperature and
precipitation, further incorporates vegetation evapotranspiration to estimate
CPP, integrating the effects of light, temperature, water, and heat on
vegetation productivity[11]. The Composite model incorporates actual
evapotranspiration closely linked to vegetation photosynthesis, synthesizes
interactions among climate factors including temperature, precipitation, and
solar radiation, and incorporates vegetation samples from arid/semi-arid
grasslands and deserts, thereby achieving superior simulation performance for
CPP in arid regions[14]. The calculated results of these models are
all expressed as dry matter (DM). To ensure dimensional consistency with the
MODIS dataset, the vegetation carbon content parameter was used for conversion.
Furthermore, in accordance with Liebig's minimum factor law, the final
grassland CPP value is determined by selecting the minimum among the 3 model
estimates, as shown in Equation 1:
CPP=min (Yt, Yp, Ye,
Yr) × Cf (1)
where CPP represents
climate production potential (gC·m–2·a–1); min(·) indicates the minimum value; Yt
and Yp are the climate productivity estimated by the Miami
model based on annual mean temperature and annual precipitation (gDM·m–2·a–1),
respectively; Ye is the climate productivity estimated by the
Thornthwaite Memorial model (gDM·m–2·a–1); Yr is the climate productivity
estimated by the Composite model (gDM·m–2·a–1); Cf
represents the vegetation carbon content parameter (gC·gDM–1),
and the carbon content in leaves of typical grassland vegetation in China is
0.402,0[25]. For detailed parameters of the estimation models, refer
to relevant literature[4,11–14,25].
3.2.2 Quantification of Grassland Degradation
In accordance with the Grading criteria for natural grassland degradation,
desertification, and salinization (GB 19377—2003)[26],
the degradation degree of grasslands is determined by the grass yield loss
rate, which is quantified based on the difference between the actual NPP and
the natural baseline, the higher grass yield loss rate, and the more severe
degradation. The Equation is:
 (2)
(2)
CPPmax=max (CPPi) i=1, 2, ..., n
(3)
|
Figure
1 Flowchart of the dataset development
|
where
GDIi represents the grassland degradation index (%) in the ith
year, with values ranging from [0%, 100%], where higher values indicate more
severe degradation. NPPi denotes the actual NPP in the region
for the ith year (gC·m–2·a–1). CPPmax is the maximum CPP value
(gC·m–2·a–1) in the
region, serving as the natural baseline, calculated as the maximum CPP value
for each year within the n-year period using Equation 3. NPPmin
is the ultimate degradation NPP value (gC·m–2·a–1) adapted to the climatic zone, acting as the ultimate
baseline. In arid and semi-arid areas, grasslands may degrade to a complete
loss of productivity, so NPPmin can be assumed as 0.
Therefore, based on the results from Equation 2 and national standards, the
grassland degradation degree is classified according to the GDI value
range: 0% to 10% indicates undegraded, 10% to 20% indicates slightly degraded,
20% to 50% indicates moderately degraded, and 50% to 100% indicates severely
degraded.
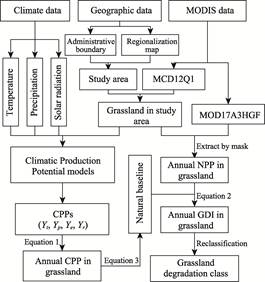
In summary, the development process of these
datasets is illustrated in Figure 1.
4 Data Results
4.1 Dataset Composition
These datasets consist of the 500-m CPPmax
dataset of arid and semi-arid region in Northwest China (2001–2023),
500-m/annual GDI dataset in the arid and semi-arid region of Northwest China
(2001–2023), and 500-m raster and 5-year step dataset of classified grassland
degradation in the arid and semi-arid region of Northwest China (2001–2023).
The classification dataset is the result of categorizing multi-year average GDI
values, with the classification based on the provisions regarding the rate of
grass yield loss in GB 19377—2003 to classify grassland degradation levels[26].
The spatial resolution of the datasets is 500 m.
4.2 Data Results
Analysis
4.2.1 Spatial Distribution of Grassland Natural Baseline
From a spatial distribution perspective
(Figure 2), the natural baseline values of grassland productivity in the arid
and semi-arid regions of Northwest China during 2001–2023 showed significant
spatial differentiation, exhibiting a basic pattern of higher productivity on
both eastern and western sides and lower productivity in the middle, with
distinct latitudinal zonality. The regional natural baseline values of
grassland productivity ranged between 0–363.5 gC·m–2·a–1, with high-value areas (>200 gC·m–2·a–1) appearing in the eastern part of
the study area, specifically in the northeastern part of Hulunbuir City, the
central part of Xing’an League and Chifeng City, and the southern part of
Xilingol League, showing a belt-like distribution from northeast to southwest.
Additionally, the natural baseline values were relatively high in the
mountainous grasslands of the western Karamay and Tacheng regions in northern
Xinjiang. Low-value areas (<50 gC·m–2·a–1) were found in the southern fringe of the
Tarim Basin, with a more scattered distribution. This distribution pattern of
grassland productivity natural baselines is primarily influenced by moisture
distribution conditions, with relatively better moisture conditions on both
eastern and western sides due to summer monsoon precipitation and westerly
precipitation, respectively. Moisture decreases from the eastern and western
sides toward the middle, resulting in a corresponding gradient in grassland
productivity.
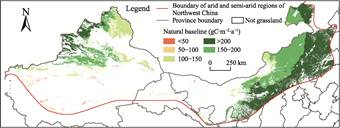
Figure 2 Spatial distribution map of natural
baseline values for grassland (2001–2023)
4.2.2 Spatial-Temporal Characteristics of Grassland
Degradation
Statistical analysis of the
spatial distribution of degraded grasslands (Figure 3a, Table 2) indicates that during 2001–2023, undegraded grasslands dominated the region
(54.4%), primarily distributed across the Hulunbuir and Xilingol plateaus in
the east, and mountainous grasslands in western Xinjiang. Degraded grasslands
covered 373,000 km2 (45.6% of total area), with moderately degraded
(28.7%) concentrated around the Horqin Sandy Land and from the Ordos to Ulanqab
Plateaus. Severely degraded grassland accounted for only 5.8%, mainly in the
western Junggar Basin. A slightly degraded grassland (11.1%) was found in the
transitional zones between moderately degraded and undegraded areas.
Changes in degraded grassland areas (Table 2) reveal
an overall improvement in regional grassland degradation. During 2001–2010, grassland
degradation was particularly severe, with over 50% of grassland areas
experiencing moderate to severe degradation. The area of degraded grassland
slightly increased during this period. Spatial distribution patterns in eastern
regions showed a progression from central to eastern and lateral areas, with
light, moderate, and severe degradation occurring sequentially (Figure 3b, c).
The western basin edges exhibited more severe degradation, while mountainous
areas showed milder degradation. After 2011, the proportion of undegraded
grassland increased significantly, with a single-stage maximum rise of nearly
14%. The area of undegraded grassland reached its peak between 2016 and 2020 at
526,000 km2. Both the area and severity of degraded grassland
decreased substantially (Figure 3d–f), with proportions of light and moderate degradation
declining. The area of slightly degraded grassland in 2021–2023 reached the
lowest level in the last 23 years. Border zones between different grassland
degradation levels became primary areas for grade transitions. In regions east
of the Helan Mountains, grassland degradation gradually improved after 2001,
with reduced degraded areas and enhanced vegetation, due to widespread
implementation of ecological programs like grazing exclusion, rotational
grazing, and desertification control. However, after 2021, the proportion of
severely degraded grassland increased, and the western regions experienced a
sharp deterioration, primarily due to the transition from moderate to severe
degradation (Figure 3f).
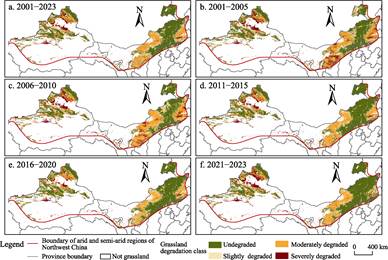
Figure 3 Spatial distribution maps of grassland
degradation degree in different periods
Table 2 Statistics of grassland degradation area
and its proportion in different periods
|
Periods
|
Undegraded
|
Slightly degraded
|
Moderately degraded
|
Severely degraded
|
|
Area
(104 km2)
|
Percent
(%)
|
Area
(104 km2)
|
Percent
(%)
|
Area
(104 km2)
|
Percent
(%)
|
Area
(104 km2)
|
Percent
(%)
|
|
2001–2023
|
44.5
|
54.4
|
9.1
|
11.1
|
23.5
|
28.7
|
4.7
|
5.8
|
|
2001–2005
|
37.4
|
45.7
|
9.7
|
11.9
|
26.4
|
32.3
|
8.2
|
10.1
|
|
2006–2010
|
37.6
|
46.1
|
9.3
|
11.4
|
27.3
|
33.5
|
7.4
|
9.1
|
|
2011–2015
|
49.1
|
60.1
|
7.6
|
9.3
|
20.6
|
25.2
|
4.3
|
5.3
|
|
2016–2020
|
52.6
|
64.4
|
8.7
|
10.7
|
16.9
|
20.7
|
3.4
|
4.2
|
|
2021–2023
|
51.8
|
63.3
|
6.7
|
8.3
|
17.6
|
21.6
|
5.6
|
6.8
|
The annual average GDI trend (Figure 4)
shows the highest value in 2001, followed by a consistent downward trend with a
rate of –0.514% per year (P<0.01), indicating
sustained improvement in grassland productivity and overall ecological recovery
in the study area. Between 2001 and 2010, the grassland degradation index
experienced a significant decline. From 2011 to 2020, it showed a weak, fluctuating
downward trend, but after 2020, the GDI began to rise again.
|
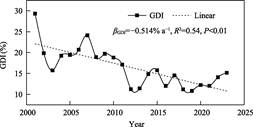
Figure 4 Interannual variation of grassland
degradation index (GDI) in arid and semi-arid regions of Northwest China
|
4.3 Dataset Validation
In 2012, the monitoring data from the Xinjiang Survey Team of the
National Bureau of Statistics revealed that 85% of natural grasslands in
Xinjiang have experienced varying degrees of degradation, with severely
degraded areas accounting for approximately 40%[27], which closely
matches the 36.5% of severely degraded area recorded in 2007–2012 in these
datasets, demonstrating that the quantified grassland degradation degree
derived from the dataset’s methodology closely aligns with actual conditions.
5 Conclusion
Addressing
the severe grassland degradation in the arid and semi-arid regions of Northwest
China, the authors utilize remote sensing and meteorological data to establish
a quantitative evaluation framework based on Climate Productive Potential (CPP)
as a natural baseline. Covering the period from 2001 to 2023. The
dataset comprises regional productivity baselines, annual quantitative
degradation degrees, and long-term degradation classifications. By adopting a
natural baseline as an objective reference, this approach offers distinct
advantages in scientific rigor, dynamism, and comparability, effectively
resolving long- standing issues such as inconsistent evaluation standards and
the lack of interoperability between cross-studies. While this methodology
provides a novel reference for grassland assessment and supports national
ecological civilization and global climate adaptation strategies, its
fundamental departure from traditional monitoring techniques necessitates
long-term observational validation. However, direct comparisons with existing
research remain a challenge; thus, subsequent research efforts should focus on
addressing this critical issue.
Author Contributions
Cai, D. W. and Shang, Z. H. conducted the
overall design of the dataset development. Cai, D. W. and Zhang, Y. Q.
collected and processed the relevant data. Liang, J. H. and Dong, Z.
J. developed the models and algorithms. Ai, Z.
Y. and Luo, W. H. verified the data. Cai, D. W., Zhang, Y. Q. and Luo, W. H. wrote
the data paper.
Conflicts of Interest
The
authors declare no conflicts of interest.
References
[1]
Dong, S. K., Zhang, Y. H., Wang,
G. C. Assessment of grassland health and degradation: concepts, principles, and
methods [J]. Pratacultural Science, 2023, 40(12): 2971–2981.
[2] Zhao, Y. B., Chang, C. C.,
Zhou, X. L., et al. Land use significantly improved grassland
degradation and desertification states in China over the last two decades [J]. Journal
of Environmental Management, 2024, 349: 119419.
[3] Lang, Y. Q., Yang, X. H., Cai,
H. Y. Assessing the degradation of grassland ecosystems based on the advanced
local net production scaling method—the case of Inner Mongolia, China [J]. Land
Degradation & Development, 2020, 32(2): 559–572.
[4] Cai, D. W., Liu, W. H., Tan, Y.
Y., et al. Spatial-temporal characteristics of grassland degradation in
Xinjiang from 2001 to 2023 based on climate production potential baseline [J]. Journal
of Desert Research, 2025, 45(5): 134–144.
[5] Liu, S. L., Wang, T., Kang, W. P., et al.
Several challenges in monitoring and assessing desertification [J]. Environmental
Earth Sciences, 2014, 73(11): 7561–7570.
[6] Gui,
D. W., Liu, Q., Martínez-Valderrama, J., et al. Desertification
baseline: a bottleneck for addressing desertification [J]. Earth-Science
Reviews, 2024, 257: 104892.
[7] Sims, N. C., England, J. R.,
Newnham, G. J., et al. Developing
good practice guidance for estimating land degradation in the context of the
United Nations Sustainable Development Goals [J]. Environmental Science &
Policy, 2019, 92: 349–355.
[8] Zhang, Y. Z., Wang, Z. Q.,
Yang, Y., et al. Research on the quantitative evaluation of grassland
degradation and spatial and temporal distribution on the Mongolia Plateau [J]. Pratacultural
Science, 2018, 12(2): 233–243.
[9] Wu, H., An, R., Li, X. X., et
al. Remote sensing monitoring of grassland degradation based on NPP change
in the Maduo County of the source region of Yellow River [J]. Pratacultural
Science, 2011, 28(4): 536–542.
[10] Zhang,
N., Li, Z. Y., Feng, Y. M., et al. Development and application of a
vegetation degradation classification approach for the temperate grasslands of Northern
China [J]. Ecological Indicators, 2023, 154: 110857.
[11] Grosso,
S. D., Parton, W., Stohlgren, T., et al. Global potential net primary
production predicted from vegetation class, precipitation, and temperature [J].
Ecology, 2008, 89(8): 2117–2126.
[12] Li, J., Zhou, F. Y., Jiao, L., et al.
Variation of main climatic elements and climate production potential in Hexi
Corridor during 1960–2022 [J]. Journal of Desert Research, 2024(6): 14–25.
[13] Lieth, H., Box, E. Evapotranspiration and
primary productivity: C.W. Thornthwaite Memorial Model [J]. Publications in
Climatology, 1972, 25(2): 37–46.
[14] Zhou, G. S., Zhang, X. S. Study on NPP of
natural vegetation in China under global climate change [J]. Acta
Phytoecologica Sinica, 1996, 20(1): 11–19.
[15] Cai, D. W., Zhang, Y. Q., Luo, W. H., et
al. 500-m CPPmax dataset of arid and semi-arid region in Northwest China
(2001–2023)
[J/DB/OL]. Digital Journal of Global Change Data Repository, 2025.
https://doi.org/10. 3974/geodb.2025.11.03.V1.
[16] Cai, D. W., Zhang, Y. Q., Luo, W. H., et
al. 500-m/annual GDI dataset in the arid and semi-arid region of Northwest
China (2001–2023) [J/DB/OL]. Digital Journal of Global Change Data Repository,
2025. https://doi.org/10.3974/geodb.2025.11.04.V1.
[17] Cai, D. W., Zhang, Y. Q., Luo, W. H., et
al. 500-m raster and 5-year step dataset of classified grassland
degradation in arid and semi-arid region of Northwest China (2001–2023) [J/DB/OL]. Digital
Journal of Global Change Data Repository, 2025.
https://doi.org/10.3974/geodb.2025.11.05.V1.
[18] GCdataPR Editorial Office. GCdataPR data
sharing policy [OL]. https://doi.org/10.3974/dp.policy.2014.05 (Updated 2017).
[19] Heinsch, F. A., Reeves, M., Votava, P., et
al. User’s Guide GPP and NPP (MOD17A2/A3) Products NASA MODIS Land
Algorithm [M]. 2003.
https://modis-land.gsfc.nasa.gov/pdf/MOD17UsersGuide2015v3.pdf.
[20] Peng, S. Z. 1-km monthly precipitation
dataset for China (1901–2024) [DB/OL]. National Tibetan Plateau / Third Pole Environment
Data Center, 2020. DOI: 10.5281/zenodo.3114194.
[21] Peng, S. Z. 1-km monthly mean temperature
dataset for China (1901–2024) [DB/OL]. National Tibetan Plateau / Third Pole Environment
Data Center, 2019. DOI: 10.11888/Meteoro.tpdc.270961.
[22] Peng, S. Z., Ding, Y. X., Liu, W. Z., et
al. 1 km monthly temperature and precipitation dataset for China from 1901
to 2017 [J]. Earth System Science Data, 2019, 11(4): 1931–1946.
[23] Copernicus Climate Change Service (C3S).
ERA5-Land hourly data from 1950 to present [DB/OL]. Copernicus Climate Change
Service (C3S) Climate Data Store (CDS), 2019. DOI: 10.24381/cds.e2161bac.
[24] Zhao, S. Q. A new scheme for
comprehensive physical regionalization in China [J]. Acta Geographica Sinica,
1983, 38(1): 1–10.
[25] Yu, C., Xu, L., He, N. P., et al.
Optimization of vegetation carbon content parameters and their application in
carbon storage estimation in China [J]. Science of the Total Environment,
2024, 955: 176912.
[26] Ministry of Agriculture and Rural
Affairs. Grading index of degradation, desertification and salinization of natural
grassland (GB 19377—2003) [S/OL]. (2003-11-10) [2026-03-06].
https://openstd.samr.gov.cn/bzgk/ std/newGbInfo?hcno=5F1960D0692A36C09136E04E6DE60B4E.
[27] Xinjiang Survey Team of the National
Bureau of Statistics. Causes of grassland degradation
in Xinjiang and problems in grassland management and use [EB/OL]. (2012-08-29)
[2026-03-06]. http://xjzd.stats.gov.cn/ xwfb/xxfx/201208/t20120829_3954.html.