Dataset Development of Non-Ice-Strengthened Vessel
Operational Risks in the Navigable Waters of the Northern Liaodong Bay
(2021–2022)
GUO Zekun1,2,3 QIAN Sihan1,2,3* FAN Jiemin1
1. Naval Architecture and
Shipping College, Guangdong Ocean University, Zhanjiang 524088, China;
2. Guangdong Provincial Key Laboratory of Intelligent
Equipment for South China Sea Marine Ranching, Guangdong Ocean University,
Zhanjiang 524088, China;
3. Shenzhen Institute of
Guangdong Ocean University, Shenzhen 518120, China
Abstract: To quantitatively assess the navigation
risks for no-ice-class vessels in the northern Liaodong Bay during winter, this
research developed a spatiotemporal Risk Index Outcome (RIO) dataset based on
the Polar Operational Limit Assessment Risk Indexing System (POLARIS). The data
sources include: GF-4 satellite visible and near-infrared remote sensing
imagery acquired during the 2021–2022 winter season under clear-sky conditions
over Liaodong Bay (used for sea ice thickness inversion), along with polygon
vector data for 12 navigable waters soured from the China Pilot A101. The
dataset comprises 2 components: (1) Boundaries of the 12 navigable waters
defining the statistical scope (.shp format); (2) Daily average RIO tables for
these waters across 44 clear-sky days (.xlsx format), totaling 528 data points.
The total compressed size is 36.2 KB. This dataset provides quantitative
baseline data to ensure vessel operational safety, plan winter navigation
routes, and support maritime regulatory decision-making.
Keywords: POLARIS; navigable waters; no-ice class vessels; operational risks; northern
Liaodong Bay
DOI: https://doi.org/10.3974/geodp.2026.01.13
Dataset Availability Statement:
The dataset supporting this paper was published and
is accessible through the Digital
Journal of Global Change Data Repository at:
https://doi.org/10.3974/geodb.2025.04.04.V1.
1 Introduction
Sea ice disasters, one of the five major marine hazards,
primarily occur in polar and high-latitude regions, but also impact
mid-latitudes seasonal sea ice regions[1]. The Bohai Sea is a
typical seasonal ice region, where winter sea ice is primarily influenced by
cold waves[2]. Among the various waters of the Bohai Sea, Liaodong
Bay experiences the most severe sea ice conditions, with extreme ice regime years
seeing the entire bay covered in ice[3]. Located in the northern
hinterland of Liaodong Bay, YingKou Port serves as the closest seaports to the
three northeastern provinces and the four eastern leagues of Inner Mongolia. It
consistently ranks among the top northern ports in grain transshipment volume,
with an annual average throughput exceeding 30 million tons[4]. The
freezing season in Liaodong Bay coincides with the peak period for transporting
grain from north to south. Severe ice conditions significantly restrict vessel
operations, becoming a critical environmental factor that affects maritime
traffic safety and operational efficiency. Different levels of ice formation
pose significant threats to vessel navigation safety, especially for
conventional vessels without ice‑strengthened vessels[5]. Therefore,
systematically assessing the operational risks of no-ice-class vessels in the
ice regions waters of Liaodong Bay is essential for ensuring vessel safety,
planning winter navigation route, and supporting maritime regulatory
decision-making.
Currently, the International Maritime Organization (IMO)
recommends the Polar Operational Limit Assessment Risk Indexing System
(POLARIS) for assessing navigation risks in polar waters[6]. This
method comprehensively consider sea ice conditions and ice class of vessel,
effectively quantifying navigation risks and supporting vessel operations and
decision-making by owners. The POLARIS methodology is primarily applied in
polar waters and utilizes sea ice conditions data provided by the National Snow
and Ice Data Center (NSIDC). It conducts weekly analyses of polar sea ice
conditions using Synthetic Aperture Radar (SAR) and generates corresponding GIS
shapefile data.
In non-polar ice regions, the application of risk
quantification using the POLARIS methodology remains insufficient. Currently,
China has not yet established a continuous remote sensing observation dataset
for sea ice, and the generation and analysis of relevant sea ice data also lag
behind. While remote sensing data (such as SAR) offers distinct advantages in
terms of broad coverage and ice condition acquisition, its application in
non-polar waters is still limited. Notably, mature datasets for converting remote
sensing data into GIS shapefiles and spatially join them with navigable waters
for risk assessment are lacking.
In
recent years, China’s Gaofen series satellites,
particularly the Gaofen-4 (GF-4) satellite, with its high temporal resolution
and visible-near infrared observation capabilities, has provided crucial data
for the dynamic monitoring of coastal sea ice. At the same time, the 2016
edition of the China Sailing Directions Bohai Sea and Yellow Sea clearly
delineates the spatial scope of the primary navigable waters in northern
Liaodong Bay, providing a foundation for dividing navigational spatial units.
This study addresses data scarcity by integrating remote sensing observations
with GIS data of navigable water areas. It establishes a standardized,
reproducible dataset for non-polar vessel operational risks in ice-covered
waters, offering more precise support for risk assessments in non-polar ice
zones. This enhancement broadens the applicability of the POLARIS methodology,
allowing for a more comprehensive evaluation of navigation risks in ice-covered
waters and offering robust data support for vessel operational decisions.
The core contributions of this dataset include: (1) Data
fusion. Spatially linking GF-4 satellite-derived sea ice thickness products
with official shipping lane vector data ensures high alignment between risk
assessment units and actual shipping operations; (2) Method standardization.
Strictly adhering to the IMO recommended POLARIS methodology framework for
calculations, quantifying navigation risks through Risk Index Outcomes (RIO) to
advance the development and refinement of the POLARIS methodology; (3) Product
serialization. Establishing daily scale risk index time series for the 2021–2022
winter season, covering 44 clear-sky days and 12 critical navigable waters.
This systematically characterizes the spatiotemporal evolution of operational
risks for no-ice-class vessels in the northern Liaodong Bay.
This paper serves as the data paper for the dataset,
systematically detailing its composition, development methodology, and results.
The release of this dataset aims to fill the gap in quantitative data on
navigation risks of no-ice-class vessels in the ice-covered waters of Liaodong
Bay. It provides foundational data support for maritime regulation and
decision-making in ice regions, vessel auxiliary decision-making, and research
on vessel navigability in ice regions under climate change conditions.
2 Metadata of the Dataset
The metadata of the Dataset of non-ice-strengthened vessel
operational risks in the navigable waters of the northern Liaodong Bay during
the winter based on POLARIS methodology (2021–2022)[7] is summarized
in Table 1. It includes the dataset full name, short name, authors, year of the
dataset, temporal resolution, spatial resolution, data format, data size, data
files, data publisher, and data sharing policy, etc.
3 Methods
The development of this dataset strictly adheres to the IMO
recommended POLARIS methodology, yielding daily scale RIO for no-ice-class
vessels navigating the northern Liaodong Bay. During development, a
standardized risk assessment framework was established by integrating sea ice
thickness data derived GF-4 satellite remote sensing, official spatial vector
data of navigation channels, and meteorological observations data. This ensures
the scientific rigor, consistency, and reproducibility of the data products.
The sources, descriptions, and key parameters of all input data required for
dataset construction are detailed in Table 2. All raw data underwent quality
control and preprocessing to meet the computational requirements of the POLARIS
methodology.
3.1 Algorithm
The POLARIS methodology is based on the integrated
consideration of sea ice concentration, ice type, ice thickness, and ice-class
vessel. It quantifies the operational risk imposed by various ice conditions
using Risk Index Values (RIVs) and subsequently evaluates vessel operational
limits in ice‑covered waters through the RIO[12].
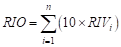
(1) RIO calculation
For independently operating vessels, the RIO is calculated
as the weighted sum of the RIVs for each sea ice types with the waters,
multiplied by their corresponding sea ice concentration. Using the
high-resolution of the GF-4 imagery, pixel classified as sea ice are assumed to
represent complete sea ice covered, ie., a sea ice concentration of 10/10.
Based on this assumption, the RIO calculation only requires to multiplying the
RIVs by 10. The Equation is as follows[13]:
 (1)
(1)
Where  denotes the risk
index value corresponding to sea ice type i, with a range of –8 to 3.
denotes the risk
index value corresponding to sea ice type i, with a range of –8 to 3.
Table
1 Metadata summary of
the Dataset of non-ice-strengthened vessel
operational risks in the navigable waters of the northern Liaodong Bay during
the winter based on POLARIS methodology (2021–2022)
|
Items
|
Description
|
|
Dataset
full name
|
Dataset
of non-ice-strengthened vessel operational risks in the navigable waters of
the northern Liaodong Bay during the winter based on POLARIS methodology
(2021–2022)
|
|
Dataset
short name
|
NIS_Vessel_RIO_LiaodongBay2021-2022
|
|
Authors
|
Ma, L.,
Naval Architecture and Shipping College, Guangdong Ocean University,
malong@gdou.edu.cn
Fan, J.
M., Naval Architecture and Shipping College, Guangdong Ocean University,
fanjiemin@stu.gdou.edu.cn
Qian,
S. H., Naval Architecture and Shipping College, Guangdong Ocean University,
qiansihan@stu.gdou.edu.cn
Xu, J.,
Naval Architecture and Shipping College, Guangdong Ocean University,
jinxu@gdou.edu.cn
Cao, L.,
Naval Architecture and Shipping College, Guangdong Ocean University,
caoliang@gdou.edu.cn
Xu, S.,
Naval Architecture and Shipping College, Guangdong Ocean University,
xs20221053@163.com
Li, X.
W., Key Laboratory of Philosophy and Social Science in Hainan Province of
Hainan Vocational University of Science and Technology,
xiaowenli_capt@126.com
|
|
Geographical
region
|
Northern
Liaodong Bay
|
|
Year
|
2021–2022
|
|
Temporal
resolution
|
Day
|
|
Spatial
resolution
|
50 m
|
|
Data
format
|
.xlsx, .shp
|
|
|
|
Data
size
|
78.7 KB
|
|
|
|
Data
files
|
Polygonal vector data for 12 navigable water areas in northern
Liaodong Bay; RIO values for 12 navigable water areas in northern Liaodong
Bay during 44 clear days in the 2021–2022 winter season
|
|
Foundations
|
Guangdong
Ocean University (060302132106, 080508132401, 202421); Natural Science
Foundation of Guangdong Province (2022A1515011603, 2023A1515011212,
2025A1515010886); Department of Education of Guangdong Province
(2022ZDZX3005); Natural Science Foundation of Shenzhen
(JCYJ20220530162200001)
|
|
Data
publisher
|
Global Change Research Data Publishing &
Repository, http://www.geodoi.ac.cn
|
|
Address
|
No.
11A, Datun Road, Chaoyang District, Beijing 100101, China
|
|
Data
sharing policy
|
(1) Data are openly available
and can be free downloaded via the Internet; (2) End users are encouraged to
use Data
subject to citation; (3) Users, who are by definition also value-added
service providers, are welcome to redistribute Data subject to written permission from the
GCdataPR Editorial Office and the issuance of a Data redistribution license; and (4) If Data are used to compile
new datasets, the “ten percent principal” should be followed such that Data records utilized
should not surpass 10% of the new dataset contents, while sources should be
clearly noted in suitable places in the new dataset[8]
|
|
Communication and searchable system
|
DOI, CSTR, Crossref, DCI, CSCD, CNKI, SciEngine, WDS, GEOSS,
PubScholar, CKRSC
|
Table 2 Data sources and
parameter descriptions for the dataset
|
Data
categories
|
Data
description
|
Source
|
Key parameter
specifications
|
|
Satellite
remote sensing imagery
|
GF-4
Satellite Visible and Near-Infrared Band Imagery
|
Natural
Resources Satellite Remote Sensing Cloud Service Platform[9]
|
Spatial resolution: 50 m;
Band: 0.45–0.90 µm used for sea ice thickness inversion. Covers 44 clear-sky
days within the ice season from December 17, 2021 to March 4, 2022, in the northern
Liaodong Bay region
|
|
Navigation
channel vector data
|
Polygonal
boundaries of 12 navigable water (passages and anchorages) in northern
Liaodong Bay
|
China
Sailing Directions Bohai Sea and Yellow Sea (China Navigation Books
Publishing House, 2016)[10]
|
Data format: vector polygons;
Geographic coordinate system: WGS 84. Defined spatial statistical units for
risk assessment, including key waters of ports such as Huludao, Jinzhou, Panjin, and Yingkou
|
|
Supplementary meteorological
data
|
Daily
average temperature
|
Yingkou
Meteorological Station (National Meteorological Science Data Center)[11]
|
Time period: December 17, 2021
to March 4, 2022, used to analyze the relationship between sea ice growth and
decay processes and RIO variations
|
|
Table 3 Mapping of stage of development to RIVs
for no-ice-class vessels
|
|
Stage
of development
|
Ice
thickness (cm)
|
RIVs
|
|
Ice
free
|
/
|
3
|
|
New
ice
|
<10
|
1
|
|
Gray
ice
|
10–15
|
0
|
|
Gray-white
ice
|
15–30
|
-1
|
|
Thin
first year ice (stage 1)
|
30–50
|
-2
|
|
Thin
first year ice (stage 2)
|
50–70
|
-3
|
|
Medium
first year ice
|
70–100
|
-5
|
|
Thick
first year ice
|
>100
|
-6
|
(2) Determination of Risk Index Values
The RIVs are defined by both the ice-class vessel and the
prevailing sea ice type[14]. As this dataset focuses on no-ice- class
vessels, the corresponding RIVs for different sea ice types are presented in
Table 3[6].
3.2 Technical Route
|
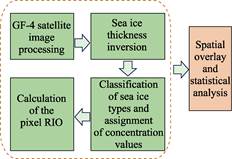
Figure 1 Flowchart of the dataset development
|
From raw data to the generation
of the final dataset, several processing steps are required (Figure 1). First,
GF-4 satellite imagery undergoes radiometric calibration and geometric
correction. The pixel reflectance is then converted into continuous sea ice
thickness raster data using an optical remote sensing empirical model.
Subsequently, the sea ice thickness raster data is discretized into sea ice
types in compliance with the POLARIS standard, based on sea ice thickness
thresholds. Given the high spatial resolution (50 m) of the GF-4 imagery, all
pixels identified as sea ice are uniformly assigned a sea ice concentration of
10/10 (full coverage). Next, corresponding RIVs for each pixel are determined
based on its sea ice type, and RIO values are calculated as RIO=RIV×10 on a
pixel-by-pixel basis. This generates daily RIO spatial distribution maps,
covering the entire study area (44 maps in total). Finally, the vector polygon
boundaries of the 12 navigable waters are spatially joined with the daily RIO
grids. The average RIO value across all pixels within each polygon is then
calculated to represent the RIO values for that navigable waters on the
corresponding day. By integrating vector boundary information with daily-scale
time-series statistics, a structured and comprehensive dataset is ultimately
created.
4 Data Results
4.1 Dataset Composition
The Dataset of non-ice-strengthened vessel operational
risks in the navigable waters of the northern Liaodong Bay during the winter based on POLARIS methodology (2021–2022)
comprises the following 2 components, collectively forming a comprehensive
spatiotemporal risk assessment product:
(1)
Spatial boundary data. This includes vector boundary files for 12 critical
navigable waters (designated 1–12) in the northern Liaodong Bay, formatted as
.shp. These files define the fundamental spatial units for risk assessment and
statistical analysis.
(2)
RIO data. The core dataset file is a .xlsx spreadsheets containing the daily
average RIO values for the 12 critical navigable waters during 44 clear-sky
days in the 2021–2022 winter season. The spreadsheet organizes data by date in
rows and navigable waters in columns, resulting in a total of 44 days×12
regions=528 valid RIO data points.
4.2 Data Products
Figure 2 depicts the geographic
distribution of 12 critical navigable waters (including channels and
anchorages) in the northern Liaodong Bay, while Table 4 details the geographic
boundaries of these areas. Figure 3 shows the spatial distribution of RIO values
calculated using the POLARIS methodology, exemplified by data from January 21,
2022. Integrating Figures 2 and 3 reveals that more than half of the RIO values
for navigation waters are below 0, indicating elevated navigation risk in the
northern Liaodong Bay during late January.
|
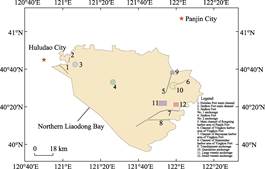
Figure 2 Map of the navigable
waters in northern Liaodong Bay
|
To quantify the winter navigation risk in the northern
Liaodong Bay, data from the 44 clear-sky days were integrated to further
analyze the time-series characteristics of RIO for each water (Table 5). This
includes the advantage RIO for each navigable waters across the 44 observation
days, the percentage of days corresponding to different RIO levels, and the
start and end dates of high-risk periods (RIO< −10). The advantage RIO
characterizes the relative risk level of each navigable waters throughout the
study period. When RIO ≥ 0, vessels can operate normally; when RIO< 0,
vessels cannot navigate, with lower values indicating higher risk. The
percentages of days corresponding to different RIO levels reflect the frequency
and duration characteristics of risk occurrence.
Table 4 Geographic boundaries of navigable waters
in Northern Liaodong Bay
|
No.
|
Navigable waters
|
Geographic boundaries
|
|
1
|
Huludao
main channel
|
From
Huludao No. 1 light buoy (40°37′30″N, 121°02′55″E) to No. 16 light buoy
|
|
2
|
Jinzhou
Port main channel
|
From
Jinzhou Port No. 1 light buoy (40°43′29″N, 121°03′12″E) to No. 7 light buoy
|
|
3
|
Jinzhou
Port No. 1 anchorage
|
Centered
at 40°42′24″N, 121°06′30″E, radius 1 NM
|
|
4
|
Jinzhou
Port No. 2 anchorage
|
Centered
at 40°33′00″N, 121°26′30″E, radius 1 NM
|
|
5
|
Main channel of Rongxing harbor area of Panjin
Port
|
From
Panjin Port No. 1 light buoy (40°26′26″N, 121°53′35″E) to No. 35 light buoy
|
|
6
|
Channel of Yingkou harbor area of Yingkou Port
|
From
Yingkou harbor area No. 1 light buoy (40°31′54″N, 122°01′00″E) to No. 11
light buoy
|
|
7
|
Channel of Bayuquan harbor area of Yingkou Port
|
From
Bayuquan harbor area No. 1 light buoy (40°13′22″N, 121°45′30″E) to No. 36
light buoy
|
|
8
|
Channel of Xianrendao harbor area of Yingkou Port
|
From
Xianrendao harbor area No. 1 light buoy (40°09′19″N, 121°38′59″E) to No. 40
light buoy
|
|
9
|
Transhipment
anchorage
|
Anchorage
connected by the following 4 points: 40°37′17″N 121°57′09″E, 40°37′17″N 121°59′08″E,
40°38′34″N 121°59′08″E, 40°39′01″N 121°57′09″E
|
|
10
|
Quarantine
anchorage
|
Centered
at Yingkou light buoy (40°31′06″N, 121°58′58″E),
radius 1.8 NM. A 3/4 circle formed by rotating 270° anticlockwise from Yingkou light buoy to No. 1 light buoy as the starting
edge
|
|
11
|
Large
vessels anchorage
|
Anchorage
connected by the following 4 points: 40°22′55″N 121°55′03″E, 40°22′55″N 122°50′51″E,
40°20′31″N 121°50′51″E, 40°20′31″N 122°55′03″E
|
|
12
|
Small
vessels anchorage
|
Anchorage
connected by the following 4 points: 40°20′01″N 121°58′51″E, 40°20′01″N 122°01′21″E,
40°22′01″N 122°01′21″E, 40°22′01″N 121°58′51″E
|
The operational risks
for no-ice-class vessels in the northern Liaodong Bay exhibit distinct
spatiotemporal distribution patterns based on the Table 5. Spatially, the
navigable waters show significant regional risk disparities, with higher risks
in the west and lower risk in the east. High-risk waters (3, 4, 5, 7, 9, 10,
11) feature lower or even negative average
|
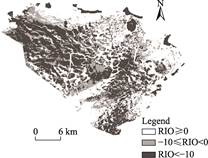
Figure 3 Spatial distribution map of RIO
(January 21, 2022)
|
RIO values, and the proportion of days with RIO < 0 remains
above 55%, indicating that these water face continuous and elevated navigation
risks throughout the winter. Among these, high-risk Water 5 (main channel of
Rongxing harbor area of Yingkou Port) and Water 10 (quarantine anchorage)
exhibit the most pronounced risk, with negative average RIO values. In
contrast, Water 1 (Huludao main channel) and Water 2 (Jinzhou Port main
channel) show the highest average RIO values and experience the earliest
conclusion of high-risk periods, indicating relatively favorable navigation
conditions. Water 4 (Jinzhou Port No. 2 anchorage) presents a special case,
with its high-risk period spanning almost
the entire observation period. This aligns with the area’s environmental
characteristics—its proximity to the estuary and lower salinity, which favor
sustained sea ice formation. Temporally, navigation risks in these waters
dynamically shifted with the progression of winter. The heavy ice period
(RIO<-10) for all waters primarily occurred between January and February,
aligning with local sea ice formation and decay patterns. However, the onset
and conclusion of high-risk periods varied across different waters, reflecting
localized process peculiarities. Water 8 of southern experienced a later start
to its risk period, while navigational risks generally began earlier in
northern nearshore waters.
5 Discussion and Conclusion
|
Table 5 Summary of RIO
statistics for navigable waters in northern Liaodong Bay (winter 2021–2022)
|
|
Navigable waters
|
Mean
RIO
|
RIO
≥0
|
-10≤
RIO<0
|
RIO <-10
|
High-risk period RIO<-10)
start and end dates
|
|
1
|
9.68
|
77
|
14
|
9
|
Dec. 31–Feb. 2
|
|
2
|
7.02
|
70
|
12
|
18
|
Dec. 31–Feb. 1
|
|
3
|
2.42
|
41
|
36
|
23
|
Dec. 30–Feb. 4
|
|
4
|
3.43
|
41
|
36
|
23
|
Dec. 26–Feb. 16
|
|
5
|
‒1.09
|
32
|
50
|
18
|
Jan. 11–Feb. 17
|
|
6
|
3.93
|
57
|
36
|
7
|
Dec. 29–Feb. 19
|
|
7
|
2.88
|
41
|
32
|
27
|
Jan. 20–Feb. 24
|
|
8
|
5.37
|
54
|
23
|
23
|
Jan. 19–Feb. 24
|
|
9
|
0.53
|
40
|
50
|
10
|
Dec. 28–Feb. 2
|
|
10
|
‒1.43
|
36
|
41
|
23
|
Jan. 16–Feb. 24
|
|
11
|
1.72
|
43
|
34
|
23
|
Jan. 20–Feb. 24
|
|
12
|
5.05
|
52
|
21
|
27
|
Dec. 26–Feb. 21
|
The dataset integrates sea ice thickness information
derived from GF-4 satellite inversions with official channel vector data,
strictly adhering to the POLARIS methodology framework. It generates
daily-scale RIO of no-ice-class vessel indices for 12 critical navigable waters
in the northern Liaodong Bay across 44 clear-sky days. Its development and
release not only provide a refined quantitative tool for maritime safety
management in northern Liaodong Bay but also offer a significant case study for
validating the application of the POLARIS methodology in non-polar waters,
thereby advancing the development of the POLARIS methodology. Analysis
indicates that the operational risks for no-ice-class vessels in the northern Liaodong
Bay winter exhibit significant spatiotemporal heterogeneity. High-risk waters
are primarily concentrated in the main navigation channels of the main channel
of Rongxing harbor area of Yingkou Port and quarantine anchorage (Water 5 and
10), while eastern waters present relatively lower risks. High-risk periods
predominantly occur from January to February. This dataset is publicly
available in a standardized, machine-readable format and enables direct
application in winter maritime safety management, vessel route optimization,
ice navigation risk assessment model validation, and ice-region vessel
navigability studies under climate change. It provides critical data support
for safe operations and long-term research in related fields.
This
dataset retains certain limitations from its development process. Its
construction was constrained by clear-sky observation conditions, resulting in
only 44 valid observation days, which makes continuous monitoring throughout
the entire ice period challenging. Sea ice thickness inversion primarily relies on empirical optical remote sensing
models, which lack sufficient validation through field measurements. The
delineation of navigable waters is based on the 2016 edition of the China
Sailing Directions Bohai Sea and Yellow Sea
and does not reflect recent dynamic changes in navigation channels.
Additionally, the assessment model does not account for vessel dynamic
parameters or human operational factors. Future research will aim to monitoring
continuity by integrating multi-source remote sensing data such as SAR and
passive microwave. It will also optimize inversion algorithms through field
measurements, introduce AIS data and ship logs to develop a human-vessel-ice
coupled risk assessment model, and update spatial assessment units based on the
latest fairway information. These improvements aim to achieve higher precision
and real-time capability in ice navigation risk assessment.
Author
Contributions
Qian, S. H. was responsible for the overall design of the dataset and research
plan guidance, and participated in revising and guiding the data paper. Guo, Z.
K. contributed to the data collection, data processing, and model and algorithm
design, and also drafted the paper manuscript. Fan, J. M. contributed to the
data validation and wrote the paper.
Conflicts of Interest
The authors declare no conflicts of
interest.
References
[1]
Sun, S. Y. Research on deep
learning-based sea ice identification and thickness grading methods in Liaodong
Bay [D].
Changchun: Jilin University, 2025.
[2]
Sun, T. High spatial-temporal
resolution monitoring of sea ice in northern Liaodong Bay based on multi-source
remote sensing data [D]. Dalian: Dalian Ocean University,
2024.
[3]
Guo, D. L., Zhao, P., Wang, B.,
et al. Sea ice in the Liaodong Bay:
statistical analysis based on satellite observations [J]. Oceanologia et Limnologia Sinica, 2019, 50(1): 31–40.
[4]
The People’s Government of
Liaoning Province. Yingkou breaks through the sea ice
of Liaodong Bay to safeguard the transport of grain from north to south
[EB/OL]. (2025-02-17) [2025-12-31]. https://www.ln.gov.cn/web/ywdt/qsgd/ass_2_1/2025021709011340363/index.shtml.
[5]
Xu,
J., Xu, S., Ma, L., et al. Research on Polar
Operational Limit Assessment Risk Indexing System for ships operating in
seasonal sea-ice covered waters [J]. Journal of Marine Science and
Engineering, 2024, 12(5): 827.
[6]
Maritime Safety Committee.
Guidance on methodologies for assessing operational capabilities and
limitations in ice [J]. International Maritime Organization, 2016: 1.
[7]
Ma,
L., Fan, J. M., Qian, S.
H., et al. Dataset of non-ice-strengthened vessel operational risks in
the navigable waters of the northern Liaodong Bay during the winter based on
POLARIS methodology (2021–2022) [J/DB/OL]. Digital Journal of Global Change
Data Repository, 2025. https://doi.org/10.3974/geodb.2025.04.04.V1.
[8]
GCdataPR Editorial Office.
GCdataPR data sharing policy [OL]. https://doi.org/10.3974/dp.policy.2014.05 (Updated
2017).
[9]
Natural Resources Satellite
Remote Sensing Cloud Service Platform [EB/OL]. [2026-01-05]. https://www. sasclouds.com/chinese/home.
[10] The Navigation Guarantee Department of the Navy of the CPLA
Headquarters. China Sailing Directions Bohai Sea and Yellow Sea [M]. Tianjin: China
Navigation Books Publishing House, 2016.
[11] National Meteorological Centre [EB/OL]. [2026-01-05].
https://data.cma.cn/.
[12] Ma, L., Qian, S. H., Dong, H.
H., et al. Navigability
of liquefied natural gas carriers along the northern sea route [J]. Journal
of Marine Science and Engineering, 2024, 12(12): 2166.
[13]
Ma, L., Qian, S. H., Mou, X. G., et al. Comparative research on vessel
navigability on the Northern Sea route based on the NSR admission criteria and
POLARIS methodology [J]. Journal of Marine Science and Engineering,
2025, 13(7): 1282.
[14] Ma, L., Qian, S. H., Zheng, Y. Z., et
al. Research on the changes in the navigable window
for no ice class of LNG carriers on the Northern Sea route (2015–2024) [J/OL]. Chinese Journal of Polar Research, 2026: 1–22. https://doi.org/10.13679/j.jdyj.20250061.