Modeling
Dataset Development and Analysis of Long-term Poultry
Trade Network in China (2010–2022)
REN Hongyan1* WANG Qi2 XU Nankang1,3
1. State Key Laboratory of
Resources and Environmental Information System, Institute of Geographic
Sciences and Natural Resources Research, Chinese Academy of Sciences, Beijing
100101, China;
2.
School of Geographic Sciences, East China Normal University, Shanghai 200241, China;
3.
China Telecom Corporation Limited Shanghai Branch, Shanghai 200120, China
Abstract: This
study developed the modeling dataset of long-term poultry trade network in
China (2010–2022) based on city-level poultry meat production and consumption
data for the period 2010–2022, employing the modified radiation model. The
dataset systematically reveals the spatiotemporal evolution of China’s poultry
trade patterns. The findings indicate that: Overall, consumption growth
fluctuated considerably while production growth remained relatively steady; the
scale of intercity poultry trade continued to expand, with short‑distance flows
being dominant; both the clustering and density of the network increased,
presenting a pattern of dense in the east and sparse in the west, short‑distance
dominance, and enhanced connectivity. The dataset includes the following data
during 2010–2022: (1) annual urban poultry production and consumption; (2)
urban poultry trade directed network; (3) urban poultry trade undirected
network; (4) urban poultry trade binary network; (5) distribution of poultry
trade volume by distance; and (6) characteristics of poultry trade network. The
dataset is archived in .xlsx and .shp formats, and consists of 12 data files
with data size of 103 MB (compressed into one file with 47.3 MB).
Keywords: poultry trade; radiation model;
trade network; 2010–2022
DOI: https://doi.org/10.3974/geodp.2026.05.06
Dataset Availability Statement:
The
dataset supporting this paper was published and is accessible through the Digital
Journal of Global Change Data Repository at:
https://doi.org/10.3974/geodb.2026.06.04.V1.
1 Introduction
Poultry, as one of the primary sources of
animal protein—including meat, eggs, etc.—plays a critical role in food supply.
In particular, with the continuous development of urbanization in China,
consumers’ awareness and consumption patterns have undergone profound changes,
driving a dietary shift from a grain‑dominated structure towards meat‑oriented consumption. This consequently leads to an
increasing demand for poultry meat products[1,2]. During
2014–2024, the share of poultry meat in China’s domestic apparent meat
consumption rose from 20.7% to 26.0%[3]. Meanwhile, poultry, as an
intermediate host in avian influenza transmission, is considered to play a key
amplifying and bridging role in the transmission chain. In particular, the
trade of poultry through live bird markets (LBMs) has been identified as an
important pathway for the zoonotic transmission of avian influenza[4–6].
Previous radiation‑model‑based studies on
China’s intercity poultry trade networks at provincial or city scales[7] mostly
focused on single-year analyses, lacking a long‑term network to systematically
analyze spatiotemporal changes or reveal the transmission mechanisms of
zoonotic diseases like avian influenza. To address this gap, we collected
national poultry production and consumption data from 2010 to 2022, constructed
a long‑term poultry trade network using the modified radiation model, and
compiled it into the Modeling dataset of long‑term poultry trade network
in China (2010–2022).
2 Metadata of the Dataset
The metadata of the Modeling dataset of
long-term poultry trade network in China (2010–2022)[8] is
summarized in Table 1. It includes the information regarding the name, authors,
geographic region, data period, temporal resolution, spatial resolution,
dataset files, data publication and sharing service platform, etc.
Table 1 Metadata
summary of the Modeling dataset of long-term poultry trade network in China
(2010–2022)
|
Items
|
Description
|
|
Dataset full
name
|
Modeling dataset
of long-term poultry trade network in China (2010–2022)
|
|
Dataset short
name
|
PoultryTradeNetwork2010-2022
|
|
Authors
|
Ren, H. Y.,
Institute of Geographic Sciences and Natural Resources Research, Chinese
Academy of Sciences, renhy@igsnrr.ac.cn
Wang, Q., East
China Normal University, Shanghai, 51283901128@stu.ecnu.edu.cn
Xu, N. K.,
Institute of Geographic Sciences and Natural Resources Research, Chinese
Academy of Sciences, xunankang6012@igsnrr.ac.cn
|
|
Geographical
region
|
China (data on
Hong Kong, Macao, and Taiwan are currently unavailable)
|
|
Year
|
2010–2022
|
|
Temporal
resolution
|
Year
|
|
Spatial
resolution
|
City
|
|
Data format
|
.xlsx, .shp
|
|
Data size
|
103 MB
|
|
Data files
|
(1) annual urban
poultry production and consumption; (2) urban poultry trade directed network;
(3) urban poultry trade undirected network; (4) urban poultry trade binary
network; (5) distribution of poultry trade volume by distance; and (6)
characteristics of poultry trade network
|
|
Foundation
|
Ministry of
Science and Technology of P. R. China (2023YFC2307502)
|
|
Computing
environment
|
Python
|
|
Data publisher
|
Global Change
Research Data Publishing & Repository, http://www.geodoi.ac.cn
|
|
Address
|
No. 11A, Datun
Road, Chaoyang District, Beijing 100101, China
|
|
Data sharing
policy
|
(1) Data are openly available and can be
freely downloaded via the Internet; (2) End users are encouraged to use Data subject to proper citation; (3)
Users, who are by definition also value-added service providers, are welcome
to redistribute Data subject to
written permission from the GCdataPR Editorial Office and the issuance of a Data redistribution license; and (4)
If Data are used to compile new
datasets, the “ten percent principle” should be followed such that Data records utilized should not
surpass 10% of the new dataset contents, while sources should be clearly
noted in suitable places in the new dataset[9]
|
|
Communication and searchable system
|
DOI, CSTR,
Crossref, DCI, CSCD, CNKI, SciEngine, WDS, GEOSS, PubScholar, CKRSC, OARL
|
3 Methods
3.1 Data Sources
This dataset is based on city-level data on
poultry meat production, per capita food expenditure, resident population, and
provincial per capita poultry meat consumption. The provincial per capita
poultry meat consumption data were obtained from the China Statistical Yearbook
(2011–2023)[10], while the poultry meat production, per capita food
expenditure, and resident population data were sourced from the statistical
yearbooks or bulletins of provinces, municipalities directly under the central
government, and autonomous regions (2011–2023)[11–41].
3.2 Data Processing
For poultry production
in each city, poultry meat production was used as a proxy indicator. Based on
the provincial per capita poultry meat consumption, the per capita food
expenditure of each city within the province, and the resident population of
each city, the poultry consumption of each city was estimated[7].
The specific calculation Equation is as follows:
 (1)
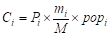 (2)
where  denotes the
annual per capita food expenditure of city
 (CNY·person–1·year–1);
 denotes the
number of cities in the province where city
 is located;
 denotes the mean
annual per capita food expenditure of the
 cities within the province (CNY·person–1·year–1);
 denotes the
poultry consumption of city (kg);
 denotes the annual
provincial per capita poultry meat consumption (kg·person–1·year–1);
 denotes the resident
population of city (persons).
3.3 Modified Radiation Model
Drawing on the radiation model for simulating
population movement patterns and estimating population flows[42], we
treat poultry in trade as an element analogous to population. By incorporating
poultry production and consumption scales as key parameters, we employ the
modified radiation model to simulate and calculate the poultry trade network
among cities or provinces. The Equations[7] are as follows:
 (3)
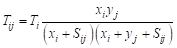 (4)
where  denotes the total poultry exports of city ,
 denotes the poultry
production of city ,
 denotes the
export proportion of poultry production, which is treated as a constant (
 =1) in this study.
 denotes
the poultry trade volume between city and city j.
 denotes the poultry
consumption of city
 ,
 represents the
sum of poultry consumption of all cities within the distance range from city to city (taking city as the centre). All variables are in kg, except
for , which is a dimensionless constant.
Since the poultry trade network derived from
the modified radiation model is directed (i.e., bilateral flows between city
pairs), it is difficult to visualize directly in space. To clearly illustrate
the intercity trade pattern, we constructed an undirected poultry trade network
weighted by the mean of the bidirectional trade flows between each pair of
cities, and subsequently generated the spatial network map of poultry trade.
3.4 Complex Network Analysis
In this study, we employed complex network
analysis, focusing on 2 indicators, namely network density and clustering
coefficient, to analyze the structural characteristics of the poultry trade
network.
Network density is used to measure the
connection strength among nodes, and its calculation Equation is as follows:
 (5)
where  is the network
density,
 is the
number of connections in the network, and
 is the number of
nodes in the network.
The clustering coefficient reflects the
degree of clustering among the neighbors of a node, and its calculation
Equation is as follows:
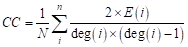 (6)
where  is the clustering
coefficient,
 is the number of
actual connections among the neighbors of node ,
 is the degree of
node , is the number of
nodes in the network.
Since the poultry trade network derived from
the modified radiation model is fully connected—i.e., trade flows exist between
any pair of cities—its network density and clustering coefficient are constant
values, and thus cannot effectively reflect the structural characteristics or
changes of the poultry trade network. To address this limitation, we applied
the three‑sigma rule to identify outliers in trade volumes and used the mean of
the remaining data as the global threshold. For each city pair, if the trade
volume in either direction exceeded this threshold, the value was assigned as
1; otherwise, it was assigned as 0, thereby constructing a binary poultry trade
network. Based on this network, we further calculated the network density and
clustering coefficient to reveal the structural characteristics of the poultry
trade network.
4 Data Results
4.1 Dataset Composition
The Modeling dataset of
long‑term poultry trade network in China (2010–2022) consists of: (1) annual
urban poultry production and consumption; (2) urban poultry trade directed
network; (3) urban poultry trade undirected network; (4) urban poultry trade
binary network; (5) distribution of poultry trade volume by distance; and (6)
characteristics of poultry trade network.
Among these, the urban poultry production and
consumption data are raw data and serve as the fundamental input to the
radiation model. The directed network, undirected network, trade‑volume‑by‑distance
data, and network characteristic data are output data, which are used to
characterize intercity poultry trade relationships and the changes in network
structure. In addition, to facilitate network visualization and structural
feature calculation, we provide the binary network data as intermediate data.
4.2 Basic Situation of Poultry Production and Consumption in China
Both poultry production
and consumption in China have shown an overall upward trend. By 2022,
production had exceeded 25 million tons, while consumption had surpassed 15
million tons. During 2010–2022, poultry production, consumption, and the
production‑consumption gap exhibited different change patterns: production
showed a fluctuating growth trend; consumption first increased and then
declined; and the gap first rose, then fell, and then rebounded. In particular,
from 2012 onwards, the growth rate of consumption accelerated notably,
accompanied by a shift of the production‑consumption gap from an upward to a
downward trend. By 2020, consumption began to decline while the production‑consumption
gap started to rise, and throughout this process, production increased only
moderately (Figure 1).
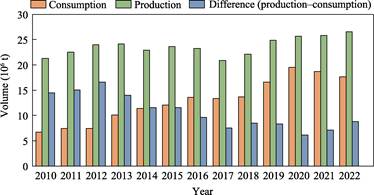
Figure 1 Basic situation of China’s
poultry market (2010–2022)
4.3 Poultry Trade Network and Structural Characteristics
The structure of China’s intercity poultry
trade network exhibits significant differentiation in both temporal and spatial
dimensions. At the spatial level, as shown in Figure 2, poultry trade
activities are widely distributed across the country. Intercity flows with
trade volumes exceeding 20,000 tons are found in most provinces, and showed a
clear increasing trend during 2010–2022 (as indicated by the increasing number
of red flow lines representing trade volumes above 20,000 tons).
Meanwhile, as shown in Figure 3a, there is a
significant distance decay effect in intercity poultry trade flows, with
approximately 80% of the trade volume concentrated within 180 km and 90% within
280 km. Further analysis of the urban poultry trade network using complex
network methods reveals that, during 2010–2022, both the network density and
the clustering coefficient of China’s urban poultry trade network exhibited
clear upward trends (Figure 3b). Specifically, the network density increased
from 0.0017 to approximately 0.0040, an increase of about 135%, reflecting a
sustained strengthening of connection intensity among cities, with increasingly
close and diversified trade linkages. The clustering coefficient rose from
0.025 to 0.08, an increase of approximately 220%, indicating that the regional
clustering characteristics within the trade network have been continuously
reinforced, and that the trade connections between node cities and their
neighboring cities have become increasingly rich.
In summary, over the
study period, the scale of poultry trade at both city and provincial levels in
China continued to expand, with short‑distance flows dominating intercity
trade, and both the clustering and network density of the poultry trade network
shown an upward trend.
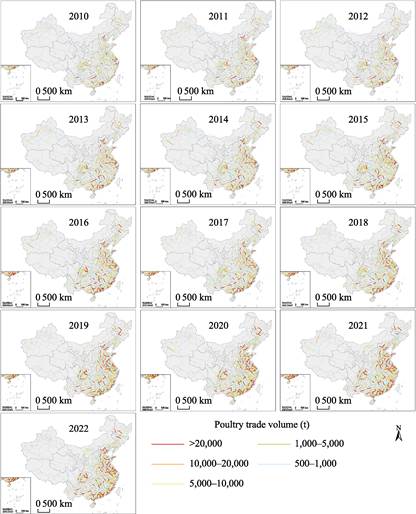
Figure 2 Maps of the intercity
poultry trade network in China (2010–2022) (trade volume > 500 t)
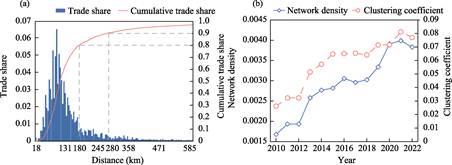
Figure 3 Characteristics of
intercity poultry trade network of China
5 Discussion and Conclusion
This study collected city-level poultry
consumption and production data and, by applying the modified radiation model,
obtained a long‑term poultry trade network of China, providing a reference for
studies on poultry trade and even avian influenza transmission.
The findings are as follows: (1) During
2010–2022, China’s poultry supply‑demand pattern exhibited consumption‑driven
phased fluctuations over time, while production growth remained relatively
moderate. (2) At the city scale, the scale of poultry trade continued to
expand, with short‑distance flows dominating; both the clustering and network
density of the resulting poultry trade network increased, revealing a pattern
of dense in the east and sparse in the west, short‑distance dominance, and
enhanced connectivity.
This dataset reflects
the spatiotemporal changes of China’s poultry trade pattern from 2010 to 2022,
and provides scientific data for optimizing industrial layout, ensuring meat
supply security, and establishing a cross‑regional joint prevention and control
system for epidemics that centers on poultry trade regulation while taking
regional differences into account.
Author Contributions
Ren, H. Y. designed the
overall framework of the dataset. Ren, H. Y. and Xu, N. K. collected and
processed the data, and designed the models and algorithms. Ren, H. Y. and
Wang, Q. performed data validation and visualization, and drafted the data
paper. Ren, H. Y., Wang, Q. and Xu, N. K. completed the revision and improvement of the dataset and data paper.
Conflicts of Interest
The
authors declare no conflicts of interest.
References
[1]
Howard, A. G., Attard, S. M.,
Herring, A. H., et al. Socioeconomic gradients in the Westernization of
diet in China over 20 years [J]. SSM-Population Health, 2021, 16:
100943.
[2]
Zhai, F. Y.,
Du, S. F., Wang, Z. H., et al. Dynamics of the Chinese diet and the role
of urbanicity, 1991–2011 [J]. Obesity Reviews, 2014,
15(S1): 16–26.
[3]
Zhu, Z. Y. Trends and current
situation of China’s meat sector [J]. Animal Research and One Health,
2026(1): 1–3.
[4]
Wang, X. L., Jiang, H., Wu, P., et
al. Epidemiology of avian influenza A H7N9 virus in human beings across five epidemics in mainland China, 2013–17: an
epidemiological study of laboratory-confirmed case series [J]. The
Lancet Infectious Diseases, 2017, 17(8): 822–832.
[5]
Zhang, R. S., Lei, Z., Liu, C., et
al. Live poultry feeding and trading network and the transmission of avian
influenza A(H5N6) virus in a large city in China, 2014–2015 [J]. International
Journal of Infectious Diseases, 2021, 108: 72–80.
[6]
Zhou, X. Y., Li, Y., Wang, Y. M., et
al. The role of live poultry movement and live bird market biosecurity in
the epidemiology of influenza A (H7N9): a cross-sectional observational study
in four eastern China provinces [J]. Journal of Infection, 2015, 71(4):
470–479.
[7]
Kong, L. C.,
Zhou, X., Duan, M. W., et al. A dataset of a proxy variable for the
poultry trade flows in China [J]. Scientific Data, 2022,
9(1): 690.
[8]
Ren, H. Y., Wang, Q., Xu, N. K.
Modeling dataset of long-term poultry trade network in China (2010–2022)
[J/DB/OL]. Digital Journal of Global Change Data Repository, 2026.
https://doi.org/10.3974/ geodb.2026.06.04.V1.
[9]
GCdataPR Editorial Office. GCdataPR
data sharing policy [OL]. https://doi.org/10.3974/dp.policy.2014.05 (Updated
2017).
[10]
National Bureau of Statistics of
China. China Statistical Yearbook (2011–2023) [M]. Beijing: China Statistics
Press, 2011–2023.
[11]
Beijing Municipal Bureau of
Statistics. Beijing Statistical Yearbook (2011–2023) [M]. Beijing: China
Statistics Press, 2011–2023.
[12]
Tianjin Municipal Bureau of
Statistics. Tianjin Statistical Yearbook (2011–2023) [M]. Beijing: China
Statistics Press, 2011–2023.
[13]
Shanghai Municipal Bureau of
Statistics. Shanghai Statistical Yearbook (2011–2023) [M]. Beijing: China
Statistics Press, 2011–2023.
[14]
Chongqing Municipal Bureau of
Statistics. Chongqing Statistical Yearbook (2011–2023) [M]. Beijing: China
Statistics Press, 2011–2023.
[15]
Hebei Provincial Bureau of
Statistics. Hebei Statistical Yearbook (2011–2023) [M]. Beijing: China
Statistics Press, 2011–2023.
[16]
Shanxi Provincial Bureau of
Statistics. Shanxi Statistical Yearbook (2011–2023) [M]. Beijing: China
Statistics Press, 2011–2023.
[17]
Inner Mongolia Autonomous Region
Bureau of Statistics. Inner Mongolia Statistical Yearbook (2011–2023) [M].
Beijing: China Statistics Press, 2011–2023.
[18]
Liaoning Provincial Bureau of
Statistics. Liaoning Statistical Yearbook (2011–2023) [M]. Beijing: China
Statistics Press, 2011–2023.
[19]
Jilin Provincial Bureau of
Statistics. Jilin Statistical Yearbook (2011–2023) [M]. Beijing: China
Statistics Press, 2011–2023.
[20]
Heilongjiang Provincial Bureau of
Statistics. Heilongjiang Statistical Yearbook (2011–2023) [M]. Beijing: China
Statistics Press, 2011–2023.
[21]
Jiangsu Provincial Bureau of
Statistics. Jiangsu Statistical Yearbook (2011–2023) [M]. Beijing: China
Statistics Press, 2011–2023.
[22]
Zhejiang Provincial Bureau of
Statistics. Zhejiang Statistical Yearbook (2011–2023) [M]. Beijing: China
Statistics Press, 2011–2023.
[23]
Anhui Provincial Bureau of
Statistics. Anhui Statistical Yearbook (2011–2023) [M]. Beijing: China
Statistics Press, 2011–2023.
[24]
Fujian Provincial Bureau of
Statistics. Fujian Statistical Yearbook (2011–2023) [M]. Beijing: China
Statistics Press, 2011–2023.
[25]
Jiangxi Provincial Bureau of
Statistics. Jiangxi Statistical Yearbook (2011–2023) [M]. Beijing: China
Statistics Press, 2011–2023.
[26]
Shandong Provincial Bureau of
Statistics. Shandong Statistical Yearbook (2011–2023) [M]. Beijing: China
Statistics Press, 2011–2023.
[27]
Henan Provincial Bureau of
Statistics. Henan Statistical Yearbook (2011–2023) [M]. Beijing: China
Statistics Press, 2011–2023.
[28]
Hubei Provincial Bureau of
Statistics. Hubei Statistical Yearbook (2011–2023) [M]. Beijing: China
Statistics Press, 2011–2023.
[29]
Hunan Provincial Bureau of
Statistics. Hunan Statistical Yearbook (2011–2023) [M]. Beijing: China
Statistics Press, 2011–2023.
[30]
Guangdong Provincial Bureau of
Statistics. Guangdong Statistical Yearbook (2011–2023) [M]. Beijing: China
Statistics Press, 2011–2023.
[31]
Guangxi Zhuang Autonomous Region
Bureau of Statistics. Guangxi Statistical Yearbook (2011–2023) [M]. Beijing:
China Statistics Press, 2011–2023.
[32]
Hainan Provincial Bureau of
Statistics. Hainan Statistical Yearbook (2011–2023) [M]. Beijing: China
Statistics Press, 2011–2023.
[33]
Sichuan Provincial Bureau of
Statistics. Sichuan Statistical Yearbook (2011–2023) [M]. Beijing: China
Statistics Press, 2011–2023.
[34]
Guizhou Provincial Bureau of
Statistics. Guizhou Statistical Yearbook (2011–2023) [M]. Beijing: China
Statistics Press, 2011–2023.
[35]
Yunnan Provincial Bureau of
Statistics. Yunnan Statistical Yearbook (2011–2023) [M]. Beijing: China
Statistics Press, 2011–2023.
[36]
Xizang Autonomous Region Bureau of
Statistics. Xizang Statistical Yearbook (2011–2023) [M]. Beijing: China
Statistics Press, 2011–2023.
[37]
Shaanxi Provincial Bureau of
Statistics. Shaanxi Statistical Yearbook (2011–2023) [M]. Beijing: China
Statistics Press, 2011–2023.
[38]
Gansu Provincial Bureau of
Statistics. Gansu Statistical Yearbook (2011–2023) [M]. Beijing: China
Statistics Press, 2011–2023.
[39]
Qinghai Provincial Bureau of
Statistics. Qinghai Statistical Yearbook (2011–2023) [M]. Beijing: China
Statistics Press, 2011–2023.
[40]
Ningxia Hui Autonomous Region
Bureau of Statistics. Ningxia Statistical Yearbook (2011–2023) [M]. Beijing:
China Statistics Press, 2011–2023.
[41]
Xinjiang Uygur Autonomous Region
Bureau of Statistics. Xinjiang Statistical Yearbook (2011–2023) [M]. Beijing:
China Statistics Press, 2011–2023.
[42]
Simini, F., Gonzalez, M. C.,
Maritan, A., et al. A universal model for mobility and migration
patterns [J]. Nature, 2012, 484(7392): 96–100.