500-m
Raster Dataset Development of Fog Duration in Poyang Lake Basin (2018–2025)
LI Haijun1,2 SHAN Jiusheng1,2* LIU Bo1
YIN Xiaofei1
1. Jiangxi Meteorological Observatory, Nanchang 330096, China;
2. Jiangxi Province Key Laboratory of Climate Change Risk
and Meteorological Disaster Prevention, Nanchang 330096, China
Abstract: Clarifying the evolution and fine
spatial distribution of fog is fundamental for refined fog forecast and early
warning, which can mitigate adverse fog impacts on human daily activities,
low-altitude economy, land transportation and shipping. Current operational fog
observations rely exclusively on sparse surface visibility sensors (one station
per county) with coarse spatial resolution, making it urgent to develop a
high-resolution dataset capturing fine-scale fog characteristics. Based on
15-minute, 500 m visible Channel 2 data from Fengyun-4A/4B satellites, digital
elevation model, ground visibility and precipitation observations, this study
established a daytime fog dataset for the Poyang Lake Basin. A total of 139
daytime fog cases were identified, fog detection was conducted following the
method of Li et al. (2026), and gridded accumulation was implemented to
produce final gridded products. The dataset has a 500 m spatial resolution with
593,095 grid points, which is 6,817 times the number of the existing 87
operational surface stations. Validation results for 2018–2025 show a
correlation coefficient of 0.85, a relative root mean square error of 0.29, and
a mean relative error of 0.21. The dataset exhibits a significant positive
correlation, high accuracy, and small deviation, demonstrating reliable
applicability. The dataset contains 3 types of daytime
fog products covering the Poyang Lake Basin from 2018 to 2025: (1) fog duration
of 139 individual daytime fog cases; (2) annual cumulative daytime fog
duration; (3) 8-year total cumulative daytime fog duration. The dataset is
archived in .tif format, and consists of 149 data files with data size of 1.55
GB (compressed into 1 file with 26.4 MB).
Keywords: fog; spatial distribution;
Poyang Lake; Fengyun satellite; high-resolution
DOI: https://doi.org/10.3974/geodp.2026.05.09
Dataset Availability Statement:
The dataset supporting this
paper was published and is accessible through the Digital
Journal of Global Change Data Repository at:
https://doi.org/10.3974/geodb.2026.03.05.V1.
1 Introduction
Fog is a weather
phenomenon in which a large number of tiny water droplets or ice crystals
suspend in the near-surface atmosphere, reducing visibility to below 1 km[1].
As a hazardous weather condition in a certain situation, fog brings risks and
inconvenience to daily life, low-altitude economy, transportation, and shipping[2–4].
To mitigate the adverse impacts of fog and provide timely fog forecasts and
early warnings, it is essential to fully and accurately understand the spatial
distribution and temporal evolution of fog in a given region[5].
At present, meteorological departments mainly observe
fog using visibility sensors at surface meteorological stations[6–8],
whose major limitation is the sparsity of stations. Moreover, since fog is
strongly influenced by topography and underlying surface type, its spatial
distribution is highly nonlinear[5,6]. Therefore, high spatial
precision data that can represent the actual distribution of fog are both
scarce and necessary.
With stable and continuous observations and high
spatial resolution, meteorological satellites have great potential to improve
fog detection. Numerous studies have been conducted on satellite-based gridded
fog detection. The classical dual-channel difference method using mid-infrared
and long-wave infrared channels enables nighttime fog detection[9].
Visible channels are used for daytime fog detection based on the unique optical
characteristics such as texture and boundaries of fog[10].
Statistical models[11] and machine learning models[12,13]
have also been applied for both daytime and nighttime fog identification.
Although remarkable progress has been made, these methods still struggle to
effectively distinguish fog from low clouds.
In recent years, some researchers have incorporated
digital elevation model (DEM) data and effectively improved the separation of
fog and low clouds[14,15]. However, these studies have not
considered the spatial distribution characteristics of fog under topographic
constraints. In fact, due to local microclimates, fog often concentrates in
valleys or over specific underlying surfaces[5,6]. Using elevation
data combined with terrain delineated by natural watersheds as constraints is
more consistent with the natural distribution characteristics of fog[16].
Li[17] proposed a fog detection method for the entire natural Poyang
Lake Basin, which sets thresholds in groups based on the Gaussian distribution
of visible reflectance over non-fog surfaces (referred to as the Li 26 algorithm). This method fully considers the
topographic constraint of natural watersheds on fog, can partly distinguish fog
from low clouds, and achieves high-resolution (500 m) daytime fog detection.
Based on the Li 26 algorithm, this study uses visible
data from FY-4A/B meteorological satellites, DEM data, and in situ visibility
and precipitation observations. A total of 139 daytime fog cases from 2018 to
2025 over the Poyang Lake Basin were screened and individually detected. By
accumulating the detection results, a dataset of daytime fog spatial
distribution from 2018 to 2025 was constructed, with a spatial resolution of
500 m. This dataset will help improve the understanding of the fine-scale
distribution characteristics of fog in the Poyang Lake Basin, enhance the
accuracy of fog forecasting and early warning by meteorological departments,
and support more refined assessments of meteorological risks posed by fog to
economy, population, transportation, and other sectors.
2 Metadata of the Dataset
The metadata of 500-m raster
dataset of fog duration in Poyang Lake Basin (2018–2025)[18] is
summarized in Table 1. It includes the dataset full name, short name, authors,
year of the dataset, spatial resolution, data format, data size, data files,
data publisher, etc.
3 Methods
3.1 Study Area
The Poyang Lake Basin covers an area
of 162,225 km2, with a geographic extent of 113°35′– 118°29′
E, 24°29′–30°05′ N (Figure 1). The basin is located in Southern China, with
96.62% of its area lying in Jiangxi Province and the remaining 3.38%
distributed across 5 provinces:
Table 1 Metadata summary of the 500-m raster dataset of fog
duration in Poyang Lake Basin (2018–2025)
|
Items
|
Description
|
|
Dataset full name
|
500-m raster dataset of fog duration in
Poyang Lake Basin (2018–2025)
|
|
Dataset short name
|
Fog_PYLakeBasin_2018–2025
|
|
Authors
|
Li, H. J., Jiangxi Meteorological Observatory,
lihaijun862097@outlook.com
Shan, J. S., Jiangxi Meteorological Observatory, shanjiusheng@hotmail.com
Liu, B., Jiangxi
Meteorological Observatory, 149037992@qq.com
Yin, X. F., Jiangxi Meteorological Observatory, 617031745@qq.com
|
|
Geographical
region
|
Poyang Lake Basin
|
|
Year
|
2018–2025
|
|
Spatial resolution
|
500 m
|
|
Data format
|
.tif
|
|
|
|
Data size
|
26.4 MB (compressed)
|
|
|
|
Data files
|
The 139 individual fog events, the annual cumulative
values, the 8-year cumulative value
|
|
Foundations
|
Jiangxi Meteorological Bureau (JXCX202304); National
Natural Science Foundation of China (42275007)
|
|
Computing environment
|
ArcGIS, Python
|
|
Data publisher
|
Global Change
Research Data Publishing & Repository, http://www.geodoi.ac.cn
|
|
Address
|
No. 11A, Datun
Road, Chaoyang District, Beijing 100101, China
|
|
Data sharing policy
|
(1) Data are openly available and can be
freely downloaded via the Internet; (2) End users are encouraged to use Data subject to proper citation; (3)
Users, who are by definition also value-added service providers, are welcome
to redistribute Data subject to
written permission from the GCdataPR Editorial Office and the issuance of a Data redistribution license; and (4)
If Data are used to compile new
datasets, the “ten percent principle” should be followed such that Data records utilized should not
surpass 10% of the new dataset contents, while sources should be clearly
noted in suitable places in the new dataset[19]
|
|
Communication and
searchable system
|
DOI, CSTR, Crossref, DCI, CSCD, CNKI,
SciEngine, WDS, GEOSS, PubScholar, CKRSC, OARL
|
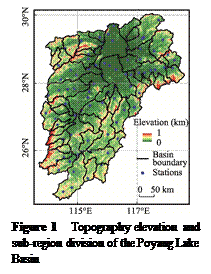 Fujian, Zhejiang, Anhui, Hunan, and Guangdong. The river system mainly consists
of Poyang Lake (the largest freshwater lake in China) and its 5 major
tributaries: the Ganjiang, Fuhe, Xinjiang, Raohe, and Xiushui Rivers. The basin
is dominated by hills and mountains and forms an important part of the hilly
region in southeastern China. Its highest peak is Huanggang Mountain in the
Wuyi Mountains, with an elevation of 2.16 km, and there are no snow-capped
mountains. The basin features typical ridge-valley topography, and local
microclimates constrain the spatial distribution of fog. The basin is located
among three large urban agglomerations: the Yangtze River Delta, the Pearl
River Delta, and the Middle Yangtze River. It has a dense expressway network
and is frequently affected by fog.
3.2 Data Sources
Satellite data were obtained from the
National Satellite Meteorological Center. Since the operational
data of the FengYun-4A (FY-4A) satellite, the primary operational satellite of
China’s meteorological department, are available from March 12, 2018, to March
4, 2024, the Channel 2 visible light data of the Advanced Geostationary
Radiation Imager (AGRI) aboard FY-4A were used in this study for this period.
The data have a central wavelength of 0.65 µm, a spectral bandwidth of
0.55–0.75 µm, and a temporal/spatial resolution of 15 min/500 m. As FY-4B took
over operational tasks from FY-4A on March 5, 2024, the Channel 2 visible light
data of AGRI aboard FY-4B were adopted from March 5, 2024, to December 31,
2025, with a central wavelength of 0.525 µm, a spectral bandwidth of 0.50–0.55
µm, and an identical temporal/spatial resolution of 15 min/500 m. Satellite
data were primarily used for high spatiotemporal resolution identification of
fog spatial distribution.
The Digital Elevation Model (DEM) data were
acquired from the Geospatial Data Cloud. With an original spatial
resolution of 90 m, the DEM data were resampled to 500 m (consistent with the
satellite data resolution) using ArcGIS 10.2 software. DEM data were primarily
applied in the grouping step of fog identification.
The boundary data of the Poyang Lake Basin[20]
were obtained from the National Earth System Science Data Center, covering the year 2000 in
.shp format. These boundary data were used to delineate the Poyang Lake Basin
as the study region.
Visibility and
precipitation data were retrieved from the “Tianqing” Meteorological Big Data
Cloud Platform developed by the National Meteorological Information Center.
Visibility and precipitation data were observed by visibility sensors and rain
gauges at meteorological stations, respectively. Visibility data were mainly
used for fog case screening and dataset result verification, while
precipitation data were only used for fog case screening.
3.3 Algorithm
3.3.1 Fog
Case Selection
Low visibility caused by clouds is frequently
recorded at mountainous meteorological stations, so such stations are usually
excluded when counting fog station observations[5]. After excluding 2
mountainous stations (Lushan and Jinggangshan), a total of 85 national
meteorological stations remain in the Poyang Lake Basin, and their locations
are shown in Figure 1. Referring to Li 26 algorithm,
fog cases were delineated using the 2018–2025 visibility and precipitation data
from these 85 stations in the Poyang Lake Basin. A fog case was selected when
the following two conditions were met simultaneously: the number of stations
with visibility≤1 km was ≥15, and the number of stations with both visibility ≤1 km and rainfall intensity≥0.1 mm/h was ≤3 (Equation 1).
 (1)
where, N denotes the total number of
stations, Nvis≤1 represents the number of stations
with visibility ≤1 km, and Nr≥0.1 and vis≤1 denotes the number of stations
where visibility ≤1 km and rainfall intensity ≥0.1 mm/h at the same site.
The time period of a diurnal fog case was
defined to start at 0.5 h after sunrise in Nanchang (the central city of the Poyang
Lake Basin) and end at the moment when the number of stations with visibility ≤1 km dropped below 3. If the
number of stations with visibility ≤1 km remained ≥3 throughout the entire day for a
fog case, the time period would end at 0.5 h before sunset in Nanchang.
3.3.2 Satellite Based Identification of
Fog Spatial Distribution
The identification of a single fog case
consisted of several fog detection processes at 15-minute intervals. For a
single fog detection, the FY-4A/B data and DEM data at the corresponding moment
were used, following the method Li 26 algorithm. The general workflow of this
method is as follows: Considering the spatial distribution characteristics of
fog that it concentrates along river valleys but is scarce along mountain
ridges, the study area was divided into 52 subregions based on sub-basin
boundaries (Equation 2), with the subregion division shown in Figure 1. For
each subregion, a threshold was set as the minimum elevation value within the
subregion plus 0.3 km using DEM data; areas above the threshold were classified
as high elevation zones, and those below as low elevation zones (Equation 3).
Based on the distribution features that the peak value of the Gaussian
distribution of visible light reflectance over the surface of high elevation
zones is much smaller than that over fog tops, the identification threshold for
each of the 52 subregions was determined as the mean value of visible light
reflectance in the high elevation zone plus three times the standard deviation
(Equation 4). A visible light grid point with a value higher than the
identification threshold of its corresponding subregion was identified as fog.
 and
 (2)
 and
 (3)
 (4)
where A denotes the Poyang Lake Basin, A1,
A2, …, A52 represent the 1st, 2nd, …, 52nd
subregions after division, respectively, and Am, An
and Ai represent the m-th, n-th, and i-th
subregions. Ahi and Ali
represent the high elevation zone and low elevation zone of the i-th
subregion, respectively. ti denotes the identification
threshold for the i-th subregion, and μhi
and σhi represent the mean visible reflectance and
standard deviation over the high elevation zone of the i-th subregion,
respectively.
3.4 Technical Route
Fog does not persist
continuously over time; it typically forms at night and dissipates after sunrise,
appearing as temporally discrete fog events. The risk of fog disasters
increases significantly only when the density and extent of a fog event expand,
resulting in low visibility over a large area. Most fog studies focus on fog
cases with a certain spatial scale[3,5,7–17]. Therefore, datasets developed based on fog
cases meet the current general practical research needs.
The technical route for developing this
dataset is shown in Figure 2.
Step 1: Selection of fog cases. According to
the algorithm described in Section 3.3.1, 139 fog cases were selected during
2018–2025 (Figure 3). Satellite data at 15-minute intervals during the daytime
period were obtained for each fog case individually.
Step 2:
Satellite-based fog identification. According to the algorithm described in
Section 3.3.2, fog areas were identified for each of the 139 fog cases one by
one.
Step 3:
Accumulation into the dataset. First, grid alignment was carried out. Annual
accumulation was performed to obtain the spatial distribution of daytime fog
duration for each year from 2018 to 2025. All cases were then accumulated to
generate the grid data of the spatial distribution of total daytime fog
duration from 2018 to 2025.
4 Data Results and Validation
4.1 Dataset Composition
The dataset consists of spatial distribution raster data of daytime fog
duration for three components from 2018 to 2025: (1) the 139 individual fog
events; (2) the annual cumulative
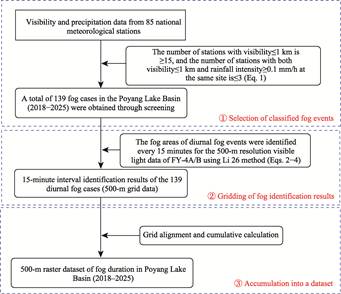
Figure 2 Flowchart of the dataset development
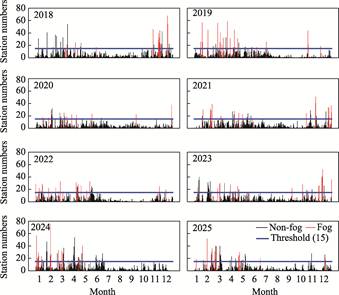
Figure 3
Statistical analysis of daily fog station numbers (2018–2025)
values; and (3) the 8-year cumulative value.
The dataset is archived in .tif format, with a total of 149 files and a
compressed size of 26.4 MB.
4.2 Data Validation
The fog duration derived
from in situ observations was compared with that extracted from the dataset at
corresponding stations (Table 2), with correlation coefficient (C), relative
root mean square error (R), and mean relative error (M) adopted for
quantitative accuracy evaluation. For the 8-year cumulative fog duration from
2018 to 2025, the correlation coefficient reached 0.85, indicating a
significant positive correlation. The corresponding R and M values were
0.29 and 0.21, respectively, suggesting high overall accuracy, small
deviations, and reliable performance of the 8-year cumulative dataset. For
annual fog duration during 2018–2025, the correlation coefficients ranged from
0.77 to 0.87, with significant correlations detected for all years. The highest
correlation coefficient (0.87) occurred in 2020, while the lowest value (0.77)
appeared in 2025. Annual R and M values varied within 0.33–0.53 and
0.24–0.38, respectively. The minimum R value of 0.33 was found in both
2019 and 2021, and the minimum M value of 0.24 was recorded in 2019. Both R
and M peaked in 2020, which was attributed to fewer fog cases and lower
absolute fog duration values in this year. In general, the annual fog duration
products of this dataset from 2018 to 2025 are credible.
Table 2 Verification table of total and annual
fog duration from 2018 to 2025
|
Year
|
Correlation coefficient
|
Relative root mean square error
|
Mean relative error
|
|
2018
|
0.83
|
0.37
|
0.29
|
|
2019
|
0.82
|
0.33
|
0.24
|
|
2020
|
0.87
|
0.53
|
0.38
|
|
2021
|
0.83
|
0.33
|
0.25
|
|
2022
|
0.83
|
0.43
|
0.29
|
|
2023
|
0.86
|
0.37
|
0.28
|
|
2024
|
0.80
|
0.36
|
0.25
|
|
2025
|
0.77
|
0.39
|
0.30
|
|
2018–2025
|
0.85
|
0.29
|
0.21
|
Note: The
correlation coefficient is bolded when the significance level of the linear
correlation is less than 0.01.
4.3 Data Products
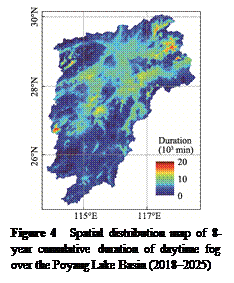 This study developed a 500-m raster dataset of daytime fog duration
spatial distribution over the Poyang Lake Basin. The basin covers an area of
162,200 km2, but is currently monitored by only 87 surface
meteorological stations (including 2 mountain stations). This dataset improves
the spatial resolution of fog observation to 500 m, with a total of 593,095
grid points, representing a 6,817-fold increase relative to the number of
stations. This significant improvement helps to further understand the fine scale
characteristics of fog spatial distribution in this region.
The spatial distribution of the 8-year cumulative
daytime fog duration from 2018 to 2025 is shown in Figure 4. Compared with
previous understanding of fog spatial distribution[6], this dataset
clearly identifies 3 high-value centers in the northeast, northwest, and west,
and reveals their detailed spatial patterns. The high value center in the
northeast is larger and more contiguous than those in the northwest and west,
which are more isolated. In addition, there are several connected
sub-high-value centers in the central basin. Overall, fog duration is higher in
the north and central parts than in the south; the variance is larger in the
surrounding mountainous areas, while it is more uniform in the central region.
From the perspective of annual cumulative fog duration
from 2018 to 2025 (Figure 5), the spatial distribution varies considerably
among the 8 years. Overall, fog duration is lower in 2020 and 2022, while the
other years are comparable. The northeast region is a high-value center in all
8 years, whereas the northwest and west are not always high-value centers. The
central part still tends to form connected high- or sub-high-value centers. In
2024, long duration fog also appeared in the southern part of the basin.
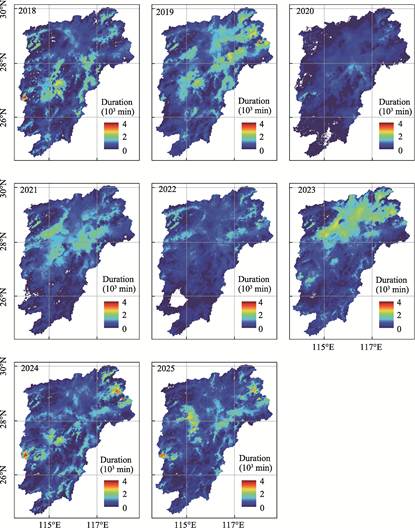
Figure 5 Spatial
distribution maps of annual cumulative duration of daytime fog over the Poyang
Lake Basin (2018–2025)
5 Discussion and Conclusion
This study developed a
daytime fog dataset for the Poyang Lake Basin using 15-minute and 500-m Channel
2 visible observations from the Advanced Geostationary Radiation Imager onboard Fengyun-4A/4B satellites, combined
with digital elevation model data, surface visibility and precipitation
measurements. A total of 139 daytime fog cases were identified with the Li 26
algorithm, and gridded fog products were generated via grid alignment and
cumulative calculation. The final 500-m resolution dataset contains 593,095
grid points, with spatial resolution improved by 6,817 times compared with the
existing 87 in situ meteorological stations. Three statistical
indicators—correlation coefficient (C), relative root mean square error (R),
and mean relative error (M)—were used for dataset validation against station
observations. The multi-year averaged C, R and M values for 2018–2025
were 0.85, 0.29 and 0.21, while the annual values ranged within 0.77–0.87,
0.33–0.53 and 0.24–0.38, respectively. Validation results reveal that the
dataset has significant positive correlation, high accuracy and small
deviations, and both annual and 8-year cumulative fog products are reliable.
This study demonstrates that domestic Fengyun-4A/4B satellites have great
application potential for satellite-based daytime fog detection.
Benefiting from the high spatial resolution of 500 m,
this dataset greatly improves the observational refinement of daytime fog
spatial distribution across the Poyang Lake Basin, and further advances our
understanding of regional fog distribution characteristics. Nevertheless,
several limitations still exist. Firstly, the visible satellite data adopted in
this study depend on solar reflectance during daytime, so nighttime data are
not included, and the dataset fails to describe and capture the initial formation
stage of nocturnal fog. Secondly, this study only selected fog cases observed
by at least 15 meteorological stations, which conforms to the general research
convention of current fog case studies[3,5,7–17]. However, only 139
qualified fog cases were extracted in total, which may underestimate the
cumulative fog duration in local fog-prone areas (such as patchy fog zones)
affected by small-scale topographic variations. Thirdly, accurate
discrimination between fog and low clouds remains one of the most intractable
challenges for existing satellite fog monitoring techniques[14–17].
Although the introduction of the DEM algorithm enhances the capability to
separate fog from low clouds in this dataset, there is still considerable room
for overall performance improvement.
Author Contributions
Li,
H. J. and Shan, J. S. conducted the overall design for the dataset development.
Li, H. J. and Liu, B. collected and processed the data. Li, H. J. designed the
models and algorithms. Li, H. J. and Yin, X. F. performed the data validation.
Li, H. J. wrote the data paper.
Acknowledgements
Special thanks
go to Engineer Huang, Y. J. of the Jiangxi Meteorological Observatory for her
help in English translation.
Conflicts of
Interest
The authors
declare no conflicts of interest.
References
[1]
China Meteorological
Administration. Specifications for surface meteorological observation. Part 4: observation
of weather phenomenon (QX/T 48—2007) [S]. Beijing: Standards Press of China,
2007.
[2]
Guo, J. P., Zhang, W., Zhou, B.
W., et al. Progress and prospect of research on the key frontier
scientific and technological issues in low-altitude economy meteorology [J]. Meteorological
Monthly, 2025, 51(11): 1455–1476.
[3]
Gong, X. Q., Zhao, Y., Wang,
W., et al. Analysis of traffic risk due to fog events using numerical
forecast model outputs [J]. Journal of Safety and Environment, 2026,
26(1): 142–150.
[4]
Yang, Z. N., Gu, T. T., Pan, Y.
Y. GIS-based risk regionalization of fog disaster on highway in Zhejiang Province
[J]. Meteorological Science and Technology, 2017, 45(4): 756–760.
[5]
Shi, C. E., Zhang, H., Yang, G.
Y., et al. Climatic characteristics and influencing factors of regional
extremely dense fog in Anhui Province [J]. Acta Meteorologica Sinica,
2022, 80(6): 924–939.
[6]
Yang, H., Liu, Y. X., Zhang, K.
M. The temporal and spatial distribution of fog days in Jiangxi Province [J]. Meteorology
and Disaster Reduction Research, 2015, 38(1): 66–72.
[7]
Xu, A. H., Chen, X. X., Xiao,
A., et al. Analysis on the characteristics of meteorological factors and
forecast ideas for regional advection fog in Jiangxi [J]. Meteorological
Monthly, 2016, 42(3): 372–381.
[8]
Sang, X. Z., Chen, S. J., Liu,
D. Y., et al. Circulation anomalies and formation mechanisms for late
autumn and early winter fog occurrences over eastern China [J]. Acta
Meteorologica Sinica, 2025, 83(2): 240–256.
[9]
Eyre, J. R., Brownscombe, J. L., Allam, R. J. Detection
of fog at night using Advanced Very High Resolution Radiometer ( AVHRR) imagery
[J]. Meteorology Magazine, 1984, 113: 266–271.
[10]
Ma, H. Y., Li, Y. N., Wu, X.
J., et al. Daytime land fog detection based on H8/AHI satellite data [J].
Remote Sensing Technology and Application, 2024, 39(4): 784–792.
[11]
Lu, B., Wang, B., Yu, B., et
al. Research on analysis of daytime sea fog detection threshold in the East
China Sea and visibility inversion based on Himawari-8 [J]. Marine Forecasts,
2022, 39(6): 62–73.
[12]
Liang, X. N., Ren, C. P., Wang,
Z., et al. Identification of heavy fog on the Jinliwen expressway in
Zhejiang Province by a new generation geostationary meteorological satellite [J].
Climatic and Environmental Research, 2023, 28 (5): 471−482.
[13]
Huang, Y. H., Fu, R. D., Fang,
X. Y., et al. Day time sea fog recognition based on multi-scale feature
fusion generation under attention mechanism [J]. Remote Sensing Technology
and Application, 2025, 40(1): 258–264.
[14]
Shang, H. Z., Chen, L. F.,
Letu, H. S., et al. Development of a daytime cloud and haze detection
algorithm for Himawari‐8 satellite measurements over central and eastern China
[J]. Journal of Geophysical Research Atmospheres, 2017. 122, 3528–3543.
[15]
Ran, Y. Z., Ma, H. Y., Liu, Z.
W., et al. Satellite fog detection at dawn and dusk based on the deep
learning algorithm under terrain-restriction [J]. Remote Sensing, 2022,
14, 4328.
[16]
Kurose, Y., Fukaishi, K.,
Hayashi, Y. et al. Climatological characteristics of basin fog at the
Ohzu Basin, Ehime Prefecture [J]. Journal of Agricultural Meteorology,
1998, 54(1): 13–21.
[17]
Li, H. J., Shan, J. S., Xin, J.
J., et al. High-resolution fog
dection over a mountainous lake basin [J]. Journal of Meteorological
Research, 2026, 40(1), 173–193.
[18]
Li,
H. J., Shan, J. S., Liu, B., et al. 500-m raster dataset of fog duration in Poyang Lake Basin [J/DB/OL]. Digital Journal of
Global Change Data Repository, 2026. https://doi.org/10.3974/geodb.2026.03.05.V1.
[19]
GCdataPR Editorial Office.
GCdataPR data sharing policy [OL]. https://doi.org/10.3974/dp.policy.2014.05
(Updated 2017).
[20]
Ma, R. H. 1:1,000,000 scale
vector boundary dataset of the Poyang Lake Basin (2000) [DS/OL]. National Earth
System Science Data Center, 2015.
https://www.geodata.cn/main/face_science_detail?typeName= face_science&guid=201525230652027.