LI Jie DU Jinze*
Northwest Research Institute, China Urban
Development Institute Co., Ltd., Lanzhou 730030, China
Abstract:
Seawater
quality monitoring data form the fundamental basis for studying marine
environmental conditions. Based on the Bohai Sea water quality monitoring data
(2017–2023) released by the Seawater Quality Monitoring
Information Disclosure System on the official website of China Ministry of
Ecology and Environment (MEE), this study developed a 30-m grid dataset of
Bohai Sea water quality (2017–2023) through data collation, data conversion,
spatial interpolation. The dataset includes annual 30-m resolution seawater
quality grid data (.tif) and annual seawater quality monitoring point data
(.gdb). Featuring high spatial resolution, a long-time span, and strong
continuity, this dataset provides data support for research on the
spatiotemporal distribution and improvement of Bohai Sea water quality. The
dataset is archived in .gdb and .tif formats, and consists of 251 files with
data size of 29.9 MB (compressed into one file with 3.91 MB).
Keywords: Bohai Sea; seawater; water quality;
monitoring; 30-m grid dataset; 2017–2023
DOI: https://doi.org/10.3974/geodp.2026.02.11
Dataset Availability Statement:
The dataset supporting this paper was published and is
accessible through the Digital Journal of Global Change Data Repository
at: https://doi.org/10.3974/geodb.2025.10.07.V1.
1 Introduction
China is a country with extensive sea areas,
long coastlines, numerous islands, abundant resources, and diverse ecosystems[1].
Seawater quality protection is a key component of environmental protection and
critical to the sustainable development of coastal cities. In 2019, the concept
of building a “community with a shared future for marine life” was first
proposed, contributing China’s wisdom and strength to marine ecological
protection and security. Against this backdrop, seawater quality monitoring and
the rational use of monitoring data serve as fundamental geographic information
to scientifically guide the protection and management of marine water quality.
They play an important role in the scientific evaluation of the marine
environment, rational protection of the ecological environment, and maintenance
of the integrity of marine ecosystems.
The Seawater Quality Monitoring Information Disclosure
System of the MEE has provided open access to a large volume of seawater
quality monitoring data for the Bohai Sea, Yellow Sea, East China Sea, and
South China Sea, presented in a webpage format. Most existing studies of this
type focus on specific water quality detection methods, equipment, and
evaluation technical routes based on monitoring results. Spatially, current
relevant studies only analyze limited data from local regions, such as the
analysis of seawater quality status and change trends in Shanghai Yangshan Port
over the past 20 years[2], water quality evaluation and its
influencing factors in the coastal waters of South China[3], current
status and sustainable utilization countermeasures of the aquatic environment
in the coastal waters of Zhuhai[4], water quality status and
pollution prevention suggestions in the coastal waters of Qingdao[5],
and comprehensive evaluation of water quality status in the coastal waters of
major cities around the Bohai Sea[6].
To facilitate the accurate analysis of vertical changes
and horizontal comparisons of Bohai Sea water quality, improve the utilization
rate of published data, and enable overlay analysis of seawater quality
monitoring data with other spatial data such as regional environmental data,
this study collated and developed a 30-m resolution spatial dataset of Bohai
Sea water quality for 2017–2023. This dataset is characterized by high spatial
resolution, a long-time span, and strong continuity.
2 Metadata of the Dataset
The metadata of the 30 m raster dataset of
seawater quality in Bohai Sea (2017–2023)[7] is summarized in Table
1. It includes the full name, short name, authors, geographical region, year of
the dataset, data format, data size, data files, data publisher, and data
sharing policy, etc.
Table 1 Metadata summary of the 30 m raster
dataset of seawater quality in Bohai Sea (2017–2023)
|
Items
|
Description
|
|
Dataset full name
|
30 m raster
dataset of seawater quality in Bohai Sea (2017–2023)
|
|
Dataset short
name
|
BohaiSeaWaterQuality2017-2023
|
|
Authors
|
Li, J., Northwest
Research Institute, China Urban Development Institute Co., Ltd.,
1029349809@qq.com
Du, J. Z.,
Northwest Research Institute, China Urban Development Institute Co., Ltd.,
hello.dujinze@vip.qq.com
|
|
Geographical region
|
Bohai Sea
|
|
Year
|
2017–2023
|
|
Data format
|
.gdb, .tif
|
|
Data size
|
3.91 MB (after compression)
|
|
Dataset files
|
Annual 30-m resolution seawater quality
grid data; Annual seawater quality monitoring point feature data
|
|
Data publisher
|
Global Change Research Data Publishing & Repository,
http://www.geodoi.ac.cn
|
|
Address
|
No. 11A, Datun
Road, Chaoyang District, Beijing 100101, China
|
|
Data sharing policy
|
(1) Data are openly available and can be
free downloaded via the Internet; (2) End users are encouraged to use Data subject to citation; (3) Users,
who are by definition also value-added service providers, are welcome to
redistribute Data subject to written
permission from the GCdataPR Editorial Office and the issuance of a Data redistribution license; and (4)
If Data are used to compile new
datasets, the “ten percent principal” should be followed such that Data records utilized should not
surpass 10% of the new dataset contents, while sources should be clearly
noted in suitable places in the new dataset[8]
|
|
Communication and
searchable system
|
DOI, CSTR, Crossref, DCI, CSCD, CNKI, SciEngine,
WDS, GEOSS, PubScholar, CKRSC
|
3 Methods
3.1 Study Area
The extracted data cover the Bohai Sea
records (2017–2023) published by the Seawater Quality Monitoring Information
Disclosure System of the MEE, with a spatial scope of 37°05'N–40°97'N latitude and 117°57'E–122°25'E longitude. Figure 1 shows the spatial
distribution of seawater quality monitoring points in the Bohai Sea in 2017.
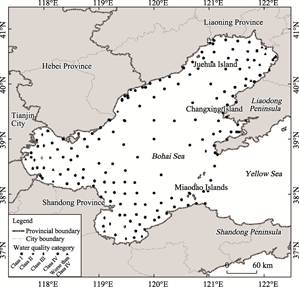
Figure
1 Distribution
map of seawater quality monitoring points in the Bohai Sea (2017)
3.2 Data Sources
The data involved in this study mainly include seawater quality
monitoring data and basic geographic information data. The seawater quality
monitoring data are from the published records of the Seawater Quality
Monitoring Information Disclosure System on the official website of the MEE[9]
(Figure 2). The basic geographic information data are vector data of
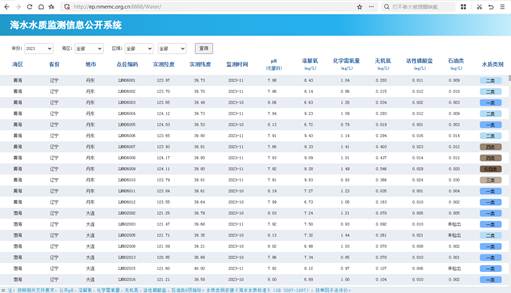
Figure 2 Schematic
diagram of the source of seawater quality monitoring data(http://ep.nmemc.org.cn:8888/Wate/)
|
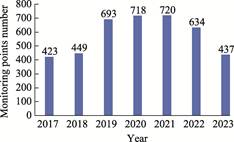
Figure 3 Number of water
quality monitoring points in the Bohai Sea by year
|
administrative regions around the Bohai Sea,
obtained from the National Geographic Information Public Service Platform
(TianDiTu)[10].
The Seawater Quality Monitoring Information
Disclosure System of the MEE has released data for the Bohai Sea from 2017 to
2023. A total of 4,074 monitoring points were set up in the Bohai Sea during
this period, with the maximum of 720 in 2021 and the minimum of 437 in 2023.
The specific distribution every year is shown in Figure 3.
3.3 Data Extraction
Seawater quality monitoring data published by
the Seawater Quality Monitoring Information Disclosure System on the official
website of the MEE were extracted annually via code, saved as .txt files, then
imported into Excel, and organized via a series of steps including
transposition and column splitting. A summary data table was compiled,
including fields such as sea area, province, city, point code, measured longitude,
measured latitude, monitoring time, pH, dissolved oxygen (mg/L), chemical
oxygen demand (mg/L), inorganic salts (mg/L), reactive phosphate (mg/L),
petroleum hydrocarbons (mg/L), water quality category, and data source (Figure
4).
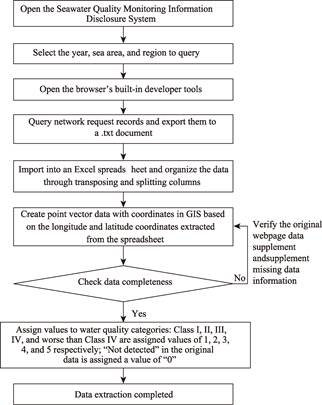
Figure 4 Flowchart of the data extraction process
Administrative
division maps at the provincial, municipal, and county levels nationwide were
downloaded from the National Geographic Information Public Service Platform
(TianDiTu). Data around the Bohai Sea were extracted as the land-sea boundary
on the northern, western, and southern sides of the Bohai Sea. The line connecting
Laotieshan Cape at the southern end of the Liaodong Peninsula, via the Miaodao
Islands, to Penglai Cape at the northern end of the Shandong Peninsula was used
as the boundary between the Bohai Sea and the Yellow Sea[11].
3.4 Data Processing
3.4.1 Data Conversion
Data within the Bohai Sea
were extracted based on the “sea area” field in the summary data table. Using
the measured longitude and latitude information in the table, GIS software was
used to generate point spatial vector data of Bohai Sea water quality monitoring
(.gdb) with the WGS84 geographic coordinate system. All field information from
the summary data table was linked to the attribute table of the point spatial
vector data through GIS software, forming complete point spatial vector data of
Bohai Sea water quality monitoring (.shp) with 21 fields.
For the convenience of analysis and statistics, 6
types of indicators—pH, dissolved oxygen (mg/L), chemical oxygen demand (mg/L),
inorganic nitrogen (mg/L), reactive phosphate (mg/L), and petroleum
hydrocarbons (mg/L)—were set to double-precision type. For the “not detected”
records in the original monitoring data of these 6 indicators, the
corresponding field values in the vector data were set to “0”. Water quality
categories (Class I, Class II, Class III, Class IV, and Worse than Class IV)
were assigned values of 1, 2, 3, 4, and 5, respectively.
3.4.2 Raster Data
Processing
The
geographic coordinates of the point vector data of seawater quality monitoring
were uniformly projected to the WGS 1984 World Mercator projected coordinate system.
Using the Inverse Distance Weighting (IDW) method in the Spatial Analyst tool
of GIS software, interpolation analysis was performed on the point vector data
at the same monitoring time each year. The water quality category was used as
the field, the data precision was set to 30 m×30 m, and the distance exponent
was 2. This yielded 30-m resolution spatial distribution grid data of seawater
quality categories at each monitoring time point per year.
The average value of
seawater quality categories at different monitoring time points in the same
year was calculated using the Raster Calculator in the Spatial Analyst tool
(Map Algebra), generating the basic grid data of Bohai Sea water quality
monitoring for each year. The basic grid data were reclassified, and water
quality categories were reassigned according to the reclassification mapping
rules (Table 2).
Table 2 Description of reclassification
assignment mapping
|
Serial NO.
|
Original value
|
New value
|
Meaning
|
|
1
|
1–1.5
|
1
|
Class I
|
|
2
|
1.5<a≤2.5
|
2
|
Class II
|
|
3
|
2.5<a≤3.5
|
3
|
Class III
|
|
4
|
3.5<a≤4.5
|
4
|
Class IV
|
|
5
|
<4.5
|
5
|
Worse than Class
IV
|
3.4.3 Scope Verification
The 30-m resolution grid
data of Bohai Sea water quality (2017–2023) were compared with the vector data
of administrative regions around the Bohai Sea. Grid data consistent with the
scope of the Bohai Sea were obtained using the clipping tool. The area of each
water quality category was recalculated, resulting in the 30-m resolution grid
data of Bohai Sea water quality (2017–2023) containing 6 fields: object identifier, assignment,
number of grids, seawater quality type, and area.
3.5 Data Visualization
ArcGIS software was used for
the spatial visualization of the 30-m resolution grid data of Bohai Sea water
quality (2017–2023). Through the symbology
system, water quality category was used as the unique value, an appropriate
color scheme was selected, and administrative division data around the Bohai
Sea (obtained from TianDiTu) were added. Necessary elements such as map frames,
legends, and scales were produced. By querying TianDiTu, place names such as
Juehua Island, Changxing Island, Miaodao Islands, Bohai Bay, Laizhou Bay, and
Liaodong Bay were labeled on the map, generating spatial data maps of Bohai Sea
water quality with 30 m resolution for 2017–2023.
4 Data Results
4.1 Dataset Composition
The 30 m raster dataset of
seawater quality in Bohai Sea (2017–2023) includes: (1) Annual 30-m resolution
seawater quality grid data (.tif), containing 6 fields: object identifier,
value, number of grids, water quality type, and area (Table 3).
Table 3 Attribute table description of 30 m
resolution seawater quality category grid data
|
NO.
|
Field name
|
Field meaning
|
Field type
|
Example
|
|
1
|
OID
|
Object identifier
|
string
|
2
|
|
2
|
Value
|
Value
|
string
|
3
|
|
3
|
Count
|
Count
|
string
|
8634593
|
|
4
|
Szlb_CN
|
Water quality category
(Chinese)
|
string
|
Class III
|
|
5
|
Szlb_EN
|
Water quality category
(English)
|
string
|
Class III
|
|
6
|
Area
|
Area (m2)
|
string
|
7771133700
|
(2) Annual seawater quality monitoring point data
(.gdb), including 21 fields such as sea area, province, city, point code,
measured longitude, measured latitude, monitoring time, pH, dissolved oxygen
(mg/L), chemical oxygen demand (mg/L), inorganic salts (mg/L), reactive
phosphate (mg/L), petroleum hydrocarbons (mg/L), water quality category, and
data source (Table 4).
The point data (.gdb) adopt the WGS84 geographic
coordinate system, and the grid layers (.tif) adopt the WGS 1984 World Mercator
projected coordinate system.
4.2 Data Results Analysis
Data analysis shows that the
seawater quality of the Bohai Sea has improved significantly from 2017 to 2023,
specifically, the proportion of Class I water quality area increased from
48.31% in 2017 to 79.02% in 2023 (Figure 5). The proportion of Class IV water
quality area decreased from 6.5% in 2018 to 0.003% in 2023 (Figure 6). The
proportion of Worse than Class IV water quality area was 1.38% in 2017 and
1.21% in 2018, and was completely eliminated after 2019 (Figure 7).
Table 4 Attribute table description of point-type
seawater quality monitoring vector data
|
NO.
|
Field name
|
Field meaning
|
Field type
|
Example
|
|
1
|
OBJECTID
|
Object ID
|
string
|
18
|
|
2
|
Shape
|
Vector type
|
string
|
Point
|
|
3
|
Sea_CN
|
Sea area
(Chinese)
|
string
|
渤海
|
|
4
|
Sea_EN
|
Sea area
(English)
|
string
|
The Bohai Sea
|
|
5
|
Province_CN
|
Province
(Chinese)
|
string
|
辽宁
|
|
6
|
Province_EN
|
Province
(English)
|
string
|
Liaoning Province
|
|
7
|
City_CN
|
City (Chinese)
|
string
|
大连
|
|
8
|
City_EN
|
City (English)
|
string
|
Dalian
|
|
9
|
Site
|
Site code
|
string
|
B21YQ007
|
|
10
|
Lon
|
Measured longitude
(E)
|
Double
|
121.49
|
|
11
|
Lat
|
Measured latitude
(N)
|
Double
|
39.67
|
|
12
|
Monitor_time
|
Monitoring time
|
Date
|
2017-5-1
|
|
13
|
pH
|
pH
|
Double
|
8.05
|
|
14
|
Rjy
|
Dissolved oxygen
(mg/L)
|
Double
|
7.79
|
|
15
|
Hxxyl
|
Chemical oxygen demand
(mg/L)
|
Double
|
1.09
|
|
16
|
Wjd
|
Inorganic nitrogen
(mg/L)
|
Double
|
0.051
|
|
17
|
Hxlxy
|
Reactive phosphate
(mg/L)
|
Double
|
0.009
|
|
18
|
Syl
|
Petroleum hydrocarbons
(mg/L)
|
Double
|
0.013
|
|
19
|
Szlb_CN
|
Water quality category
(Chinese)
|
string
|
一类
|
|
20
|
Szlb_EN
|
Water quality category
(English)
|
string
|
Class I
|
|
21
|
Cite
|
Data source
|
string
|
http://ep.nmemc.org.cn:8888/Water/
|
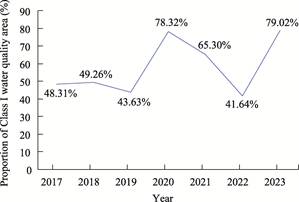
Figure
5 Proportion of Class I water quality area
in the Bohai Sea (2017–2023)
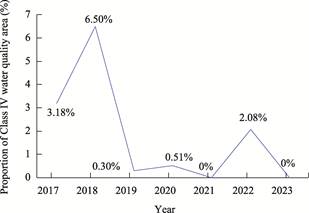
Figure 6 Proportion of Class IV water quality area
in the Bohai Sea (2017–2023)
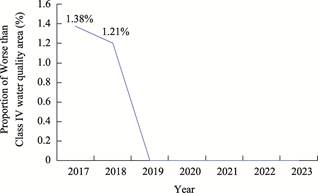
Figure 7 Proportion of Worse than Class IV water
quality area in the Bohai Sea (2017–2023)
Spatially, since 2017, the water quality in
the Bohai Sea waters of Hebei Province and southwestern Liaoning has been
relatively stable, basically reaching Class I by the end of 2023. Laizhou Bay
and Liaodong Bay, once the most polluted areas, completely eliminated Worse
than Class IV water quality in 2019. In 2023, all Class IV water quality in the
Bohai Sea was concentrated in Laizhou Bay,
while all Class III water quality was distributed in Laizhou Bay and Liaodong
Bay, accounting for 18% and 82% respectively. The water quality in Bohai
Bay has improved significantly: dominated by Class II and III in 2017, it was
mainly Class I in 2023, accounting for 74% of the Bohai Bay area, with Class II
accounting for only 26% (Figure 8).
5 Discussion and Conclusion
This study
developed a 30-m resolution gridded dataset of seawater quality in the Bohai
Sea (2017–2023) based on water quality monitoring data from the Bohai monitoring
stations published on the Seawater Quality Monitoring Information Disclosure System
of the Ministry of Ecology and Environment. The dataset was constructed through
data cleaning, format transformation, and spatial interpolation. Characterized
by long temporal coverage, multi-dimensional attributes, consistent structure,
and rigorous quality control, it supports
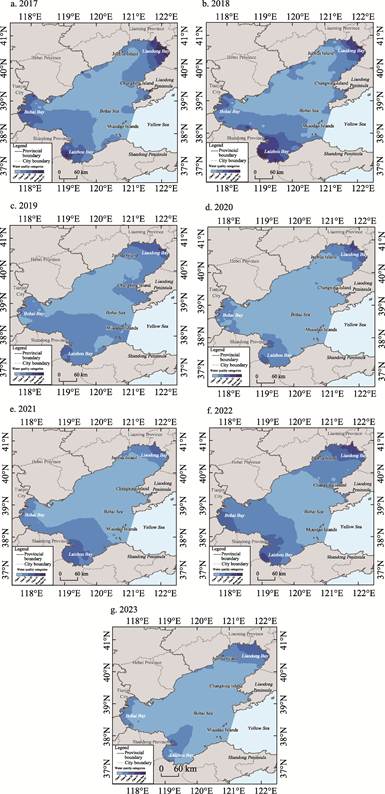
Figure 8 Distribution maps of 30-m resolution
seawater quality in the Bohai Sea (2017–2023)
both longitudinal analysis of annual trends and cross-regional comparison
of seawater quality. Moreover, it provides a reliable data foundation for
multidimensional correlation research. By integrating this dataset with spatial
information such as administrative divisions, GDP distribution, locations of
industrial enterprises, aquaculture zones, and shipping routes, further studies
can be conducted to explore the mechanistic relationships between seawater
quality variations and factors such as regional economic development levels,
industrial pollution types, intensity of aquaculture activities, and impacts of
maritime transportation.
Author Contributions
Li, J. designed the overall development of the
dataset, collected and processed the data, and wrote the data paper; Du, J. Z. performed
the data validation.
Conflicts of Interest
The
authors declare no conflicts of interest.
References
[1]
Wang, Q. Marine Environmental Protection Law comes into
force today [N]. People’s Court Daily, 2024-01-01(4).
[2]
Qian, J. Y. Analysis of seawater quality status and
change trends in Shanghai Yangshan Port over the past 20 years [J]. Green
Technology, 2023, 25(10): 65–71,77. DOI: 10.16663/j.cnki.lskj.2023.10.008.
[3]
Huang, P. H., Wang, G., Huang, Z. Y. Water quality
evaluation and its influencing factors in coastal waters of South China [J]. Tropical
Geography, 2021, 41(1): 124–135. DOI: 10.13284/j.cnki.rddl.003299.
[4]
Wu, Z. F., Guo, Z. X., Wang, J. Z., et al. Current
status and sustainable utilization countermeasures of the aquatic environment
in coastal waters of Zhuhai [J]. Environment and Development, 2000(4):
22–23.
[5]
Wang, Y. L., Sun, L., Wang, J. S. Water quality status
and pollution prevention suggestions in coastal waters of Qingdao [J]. Science
and Technology Innovation, 2020(22): 144–145. DOI: 10.3969/j.issn.1673- 1328.2020.22.086.
[6]
Zhang, G. S., Yan, J. S., Wu, T. T., et al.
Comprehensive evaluation of water quality status in coastal waters of major
cities around the Bohai Sea [J]. Journal of Hydroecology, 2022, 43(4):
63–70. DOI: 10.15928/j. 1674-3075.202102060309.
[7]
Li, J., Du, J. Z. 30 m raster
dataset of seawater quality in Bohai Sea (2017–2023) [J/DB/OL]. Digital
Journal of Global Change Data Repository, 2025. https://doi.org/10.3974/geodb.2025.10.07.V1.
[8]
GCdataPR Editorial Office. GCdataPR data sharing policy
[OL]. https://doi.org/10.3974/dp.policy.2014.05 (Updated 2017).
[9]
Ministry of Ecology and Environment of P. R. China. Seawater
Quality Monitoring Information Disclosure System [OL]. http://ep.memc.org.cn:8888/Water/.
[10]
National Geographic Information
Public Service Platform (TianDiTu). Administrative region visualization [OL]. https://cloud.tianditu.gov.cn/administrativeDivision/.
[11]
Zheng, D. Physical Geography of China [M]. Beijing:
Science Press, 2015: 136.