ZHU Hualiang1 ZHANG Miaomiao1* HONG Chen1 WEN Huayang2
1. Anhui Meteorological
Information Center, Anhui Meteorological Bureau, Hefei 230031, China;
2. Huaihe River Basin
Meteorological Center, Anhui Meteorological Bureau, Hefei 230031, China
Abstract: To achieve automatic
observation of dew, frost, and icing phenomena while acquiring timely,
comprehensive, and continuous observational data of these weather phenomena
occurrences, this paper develops a comprehensive identification algorithm for
the 3 weather phenomena at 2,164 surface meteorological stations across China.
Using the Bayesian discriminant method, the algorithm utilizes observational
data of key meteorological elements, including air temperature, surface
temperature, relative humidity, and wind speed. A long-time identification
product is hereafter generated, covering the period 2018–2024 with an hourly
temporal resolution. A comparative analysis with manual observation data
demonstrates that the proposed product achieves agreement rates of 65.57%, 90.90%,
and 95.26% for dew, frost, and icing, respectively, indicating relatively
robust performance. Presently, this time-series identification product has been
officially incorporated into the operational workflow of meteorological departments
across China, effectively substituting manual observations of the
aforementioned phenomena at surface meteorological stations. It thereby lays a
solid foundation for advancing the automation of comprehensive meteorological
observations and facilitating the unattended operation of national-level
surface meteorological stations across China. Additionally, the long-time
dataset can serve as fundamental data to support weather forecasting,
agricultural meteorology, road traffic forecasting, and service provision.
Keywords: dew phenomenon; frost phenomenon; icing
phenomenon; Bayesian discrimination; comprehensive identification
DOI: https://doi.org/10.3974/geodp.2026.01.11
Dataset Availability Statement:
The dataset
supporting this paper was published and is accessible through the Digital Journal of
Global Change Data Repository at:
https://doi.org/10.3974/geodb.2025.10.04.V1.
1
Introduction
Dew, frost, and icing are common weather phenomena in daily
life, exerting significant impacts on human production and daily activities.
For instance, dew serves as a crucial source of water resources and humidity in
arid and semi-arid regions, playing an indispensable role in plant growth and
development[1]; Autumn early frost and spring late frost can cause
freeze damage to plants (especially crops)[2,3]; In winter, snowfall
and rainfall events are prone to result in road snow accumulation or freezing,
which severely hinders people’s travel and daily routines[4,5].
Therefore, meteorological departments attach great importance to the monitoring
and forecasting of these 3 weather phenomena. Timely, comprehensive, and
continuous observational data of them are conducive to agricultural
meteorological and road traffic forecasting and service provision, and serve as
a scientific basis for effective disaster prevention, emergency rescue, and
other related initiatives[6–10].
In
the early days, the monitoring of dew, frost, and icing phenomena relied on
manual visual observations[11]. However, this method has several
inherent drawbacks, such as strong subjectivity, low observation frequency,
sparse distribution of observation stations, and high investment and
maintenance costs[10,12]. To achieve automated observation of these
weather phenomena occurrences, researchers worldwide have primarily conducted
experimental research based on tracer-based imaging[13], fiber optic
sensors[14,15], optical sensors[16], and microlysimeters[17].
Nevertheless, due to the high cost of related equipment and suboptimal
identification performance, there are currently no mature automated observation
devices or corresponding operational products available globally.
Frost,
dew, and icing phenomena occur under specific meteorological conditions, being
the comprehensive outcomes of variations in multiple meteorological elements.
To achieve timely, comprehensive, and continuous automated observation of these
weather phenomena occurrences, this study leverages existing observational data
to develop an integrated identification algorithm for the 3 weather phenomena
based on the Bayesian discriminant method. A corresponding time-series
identification product has been generated since 2018, which can effectively
substitute manual observations and provide fundamental data support for weather
forecasting, agricultural meteorology, and road traffic forecasting and service
provision.
2 Metadata
of the Dataset
The metadata of The comprehensive identification dataset for
dew, frost, and icing phenomena in China (2018–2024)[18] is
summarized in Table 1. It includes the full name, short name, authors,
geographical region, year of the dataset, temporal resolution, data format,
data size, data files, data publisher, and data sharing policy, etc.
3 Methods
3.1
Algorithm
3.1.1 Selection
of Relevant Factors
The
formation of dew, frost, and icing is influenced by meteorological factors,
including temperature, humidity, and wind speed, reflecting the comprehensive
effects of variations in these elements. Nevertheless, the magnitude of
influence exerted by different meteorological factors on their formation
differs significantly. Using surface observation data from more than 600
reference climate stations and basic meteorological stations across China
during the period 2003–2013,
the correlation coefficients between the occurrence of dew, frost, and
Table 1 Metadata summary of The comprehensive
identification dataset for dew, frost, and icing phenomena in China (2018–2024)
|
Items
|
Description
|
|
Dataset
full name
|
The
comprehensive identification dataset for dew, frost, and icing phenomena in
China (2018–2024)
|
|
Dataset
short name
|
ChinaDewFrostIcing2018-2024
|
|
Authors
|
Zhu,
H. L., Anhui Meteorological Information Center, Anhui Meteorological Bureau,
hualiangzhu@126.com
Zhang,
M. M., Anhui Meteorological Information Center, Anhui Meteorological Bureau,
zhangmiaomm@126.com
Hong,
C., Anhui Meteorological Information Center, Anhui Meteorological Bureau,
16590595@qq.com
Wen,
H. Y., Huaihe River Basin Meteorological Center, Anhui Meteorological Bureau,
wenhy12@163.com
|
|
Geographical
region
|
2,164
surface meteorological stations (reference climate stations, basic
meteorological stations and conventional meteorological stations) in China,
17.0°N–53.0°N and 74.0°E–135.0°E
|
|
Year
|
2018–2024
|
|
Temporal
resolution
|
h
|
|
Data
format
|
.txt
|
|
|
|
Data
size
|
176
MB(after compressed)
|
|
|
|
Dataset
composition
|
Hourly
dew, frost, and icing phenomena data (2018–2024)
|
|
Foundation
|
China
Meteorological Administration (YBSZX2024008)
|
|
Data
publisher
|
Global Change Research Data Publishing &
Repository, http://www.geodoi.ac.cn
|
|
Address
|
No.
11A, Datun Road, Chaoyang District, Beijing 100101, China
|
|
Data
sharing policy
|
(1) Data are openly available and can be
free downloaded via the Internet; (2) End users are encouraged to use Data subject to citation; (3) Users,
who are by definition also value-added service providers, are welcome to
redistribute Data subject to
written permission from the GCdataPR Editorial Office and the issuance of a Data redistribution license; and (4)
If Data are used to compile new
datasets, the ‘ten per cent principal’ should be followed such that Data records utilized should not
surpass 10% of the new dataset contents, while sources should be clearly
noted in suitable places in the new dataset[19]
|
|
Communication and searchable system
|
DOI,
CSTR, Crossref, DCI, CSCD, CNKI, SciEngine, WDS, GEOSS, PubScholar, CKRSC
|
icing correlation coefficients between the occurrence of
dew, frost, and icing and key meteorological variables, including air
temperature, surface temperature, vapor pressure, and wind speed are
calculated. Further correlation analysis between these phenomena and additional
meteorological factors indicated that the formation of dew and frost exhibits
significant correlations with air temperature, surface temperature, relative
humidity, vapor pressure, and wind speed. Specifically, dew formation exhibits
a significant positive correlation with air temperature, surface temperature,
and dew point temperature, while showing a significant negative correlation
with wind speed. Frost formation, in contrast, exhibits a highly significant
negative correlation with air temperature, surface temperature, vapor pressure,
and wind speed. For icing, its most pronounced correlation is with the minimum
air temperature and minimum surface temperature, showing a significant negative
correlation. These findings confirm that different meteorological factors exert
varying magnitudes of influence on the formation of dew, frost, and icing, with
temperature acting as the primary influencing factor. This study thus provides
appropriate identification indicators for the development of discriminant
models for dew, frost, and icing events.
3.1.2
Bayesian Discriminant Model Construction
The Bayesian discriminant model is a statistical
classification and decision-making model grounded in Bayesian theorem. Its core
principle entails calculating the posterior probabilities of a sample belonging
to distinct categories and assigning the sample to the category with the
maximum posterior probability. In the context of weather phenomenon
identification, the model first adopts the prior probabilities of target
weather phenomena (i.e., dew, frost, and icing)—specifically, the probabilities
of the phenomenon occurring or not occurring—and integrates them with the daily
observed meteorological element data. It then separately computes the
conditional probabilities for 2 scenarios: “the weather phenomenon is present”
and “the weather phenomenon is absent”. Finally, by comparing the numerical
values of these 2 sets of probabilities, the model determines whether the
target weather phenomenon occurs on that day. The training method and
discrimination procedures of the Bayesian discriminant model for a specific
weather phenomenon (dew, frost, or icing) at an individual meteorological
station are outlined as follows[10,12]:
(1)
Using surface meteorological observation data from the meteorological stations
spanning the period 2003–2013 as training samples, the probabilities of the
target weather phenomenon occurring and not occurring in the samples are
calculated as  and
and  , respectively.
(2)
Assume that the observed values of relevant meteorological elements on a given
day are denoted as  , where
  represents key variables including daily minimum air
temperature, daily minimum surface temperature, and other relevant
meteorological factors. Based on the training sample set, the conditional
probabilities
represents key variables including daily minimum air
temperature, daily minimum surface temperature, and other relevant
meteorological factors. Based on the training sample set, the conditional
probabilities  (for
(for  ) of observing the meteorological element values X are
calculated under two mutually exclusive scenarios: the non-occurrence and
occurrence of the target weather phenomenon. Here,
) of observing the meteorological element values X are
calculated under two mutually exclusive scenarios: the non-occurrence and
occurrence of the target weather phenomenon. Here,  denotes the non-occurrence of the target weather
phenomenon, and
denotes the non-occurrence of the target weather
phenomenon, and  denotes its occurrence.
(3)
According to Bayesian theorem, the posterior probabilities  (for ) of the target weather phenomenon (i.e., dew, frost, and
icing) being absent or present on that day are calculated under the condition
of the observed meteorological element values X. The calculation equations
are provided as follows:
(for ) of the target weather phenomenon (i.e., dew, frost, and
icing) being absent or present on that day are calculated under the condition
of the observed meteorological element values X. The calculation equations
are provided as follows:
 (1)
(1)
If
the posterior probability of the target weather phenomenon being absent,  , is
greater than the posterior probability of it being present,
, is
greater than the posterior probability of it being present,  , the phenomenon is determined to be non-existent on that
day; otherwise, it is deemed to have occurred. That is:
, the phenomenon is determined to be non-existent on that
day; otherwise, it is deemed to have occurred. That is:
 (2)
(2)
Equation
2 can be simplified as:
 (3)
(3)
Assuming
that the meteorological elements are mutually independent and each follows a
normal distribution  under the scenarios of the target weather phenomenon
being absent or present, the following holds:
under the scenarios of the target weather phenomenon
being absent or present, the following holds:

 (4)
(4)
In the equation,  and
and  denote the mean and standard deviation of the j-th
feature under the i-th class, respectively. These parameters can be
estimated via the maximum likelihood estimation (MLE) method using the training
sample set.
denote the mean and standard deviation of the j-th
feature under the i-th class, respectively. These parameters can be
estimated via the maximum likelihood estimation (MLE) method using the training
sample set.
(4) Based on the daily
observed values of relevant meteorological elements (e.g., daily minimum air
temperature and daily minimum surface temperature), the identification of the
target weather phenomenon can be accomplished using Equation 4. If  , the phenomenon is determined to be absent on that day;
otherwise, it is deemed to have occurred.
, the phenomenon is determined to be absent on that day;
otherwise, it is deemed to have occurred.
These steps are replicated separately for the dew, frost,
and icing phenomena at 2,164 meteorological stations across China. For the
Bayesian discriminant models of dew and frost, the selected meteorological
elements include air temperature, surface temperature, water vapor pressure,
wind speed, and relative humidity. For icing, the selected meteorological
elements are air temperature and surface temperature. During the model
construction process, Bayesian discriminant models for dew are successfully established
at 1,202 meteorological stations, while model establishment failed at 962
stations due to poor-quality dew observation data. For frost, 81 stations
lacked historical observation data to serve as modeling samples (attributed to
late station establishment or other reasons), making the Bayesian discriminant
models for frost unfeasible. Regarding icing discriminant models, 19 stations
failed to establish such models due to insufficient historical observation data
(caused by late station establishment or other factors). Surface meteorological
observation data from 2014 to 2015 were employed as independent samples to
validate the discriminative performance of the Bayesian discriminant models.
The results showed that the average discriminant accuracy rates of the dew,
frost, and icing models reached 86.1%, 91.8%, and 96.9%, respectively. This
indicates that the established Bayesian discriminant models are scientifically
reasonable and practically acceptable.
3.2
Technical Route
To comprehensively account for the impacts of special
weather conditions (e.g., rain and snow), the following steps are adopted for
the integrated identification of dew, frost, and icing phenomena:
Step 1: Threshold judgment. Based on the surface
observation elements listed in Table 2, determine whether the current time
period is favorable for the occurrence of dew, frost, or icing phenomena. If
the conditions are not favorable for the occurrence of any of these 3
phenomena, the corresponding weather phenomenon is directly determined to be
absent during the current time period; otherwise, proceed to Step 2.
Step 2: Bayesian model judgment. First, confirm whether a
Bayesian discriminant model has been constructed for the current meteorological
station. If the corresponding Bayesian discriminant model has been established,
the model is employed to identify the target weather phenomenon; otherwise,
proceed to Step 3.
Step 3: Bayesian model judgment based on reference stations.
First, confirm whether there is a qualified reference station for the target
meteorological station. If a reference station exists, the Bayesian
discriminant model of this reference station is employed to identify the
corresponding weather phenomenon; otherwise, proceed to Step 4. The selection
Table 2 Weather conditions unfavorable
for the formation of dew, frost, and icing phenomena
|
Factor
|
Dew
|
Frost
|
Icing
|
|
Unfavorable conditions
|
Maximum air temperature < –3 ℃
Precipitation in the past 3 h > 0 mm
Relative humidity < 60%
Wind speed > 5 m/s
|
Minimum air temperature > 3 ℃
Precipitation in the past 3 h > 0 mm
Relative humidity < 60%
Wind speed > 5 m/s
|
Minimum air temperature > 3 ℃
|
Note:
The occurrence of any of the aforementioned conditions is unfavorable for the
formation of the corresponding weather phenomenon.
criteria for reference stations are specified as follows: (1)
The altitude difference from the target station is less than 200 m, and the
geographical environment is similar; (2) The correlation coefficient of the
daily average air temperature with the target station is greater than 0.9, and
the result passes the significance test at the 0.05 level; (3) The
straight-line distance from the target station is less than 100 km; (4) A valid
Bayesian discriminant model for the corresponding weather phenomenon has been
successfully constructed. If multiple candidate reference stations meet the
above criteria, the one with the shortest straight-line distance to the target
station is selected as the final reference station.
Step 4: Threshold judgment. Due to persistently high (or
low) temperatures throughout the year at meteorological stations in coastal
areas such as Guangdong, Guangxi, Hainan and high-altitude regions, there are
no dew, frost or icing events, or only a few days with such events in the
modeling sample. Therefore, these stations were excluded during the model
construction process. For stations where neither a Bayesian discriminant model
can be constructed nor a reference station model is available in real-time
calculations, the element threshold method is directly adopted for judgment, as
detailed in Table 3.
Table 3 Discrimination thresholds for dew,
frost and icing phenomena
|
Factor
|
Dew
|
Frost
|
Icing
|
|
Discrimination conditions
|
Air temperature > 0 ℃
Relative humidity > 80%
Wind speed < 5 m/s
Surface temperature ≤ dew point temperature
|
Air temperature < 0 ℃
Relative humidity > 80%
Wind speed < 5 m/s
Surface temperature ≤ dew point temperature
|
Air temperature < 0 ℃
|
Note: the
corresponding weather phenomenon is determined to have formed only when all the
above conditions are satisfied simultaneously.
4 Data
Results and Validation
4.1
Dataset Composition
This dataset comprises hourly
observational records of dew, frost, and icing phenomena from 2,164 surface
meteorological stations across China, spanning the period from November 15,
2018, to December 31, 2024. The data are archived in .txt files named after the
station numbers, with values delimited by semicolons ( “ ; ” ) and missing data
indicated by slashes ( “ / ” ). The file format and data structure of the
physical files are detailed in Table 4.
Table 4 Composition of the dataset file
content
|
No.
|
Item
|
Item name
|
Character number
|
Description
|
|
1
|
Station_Id_C
|
Station number
|
5
|
–
|
|
2
|
Lat
|
North latitude
|
5
|
Decimal degree, Unit: °
|
|
3
|
Lon
|
East longitude
|
6
|
Decimal degree, Unit: °
|
|
4
|
Alti
|
Altitude
|
5
|
Unit: m
|
|
5
|
Station_Name
|
Station name (Chinese)
|
Variable
|
–
|
|
6
|
Station_Name_Eng
|
Station name (English)
|
Variable
|
–
|
|
7
|
Year
|
Year
|
4
|
–
|
|
8
|
Mon
|
Month
|
1–2
|
–
|
|
9
|
Day
|
Day
|
1–2
|
–
|
|
10
|
Hour
|
Hour
|
1–2
|
–
|
|
11
|
Dew
|
Dew phenomenon
|
1
|
1 =
Dew occurred at the time
0 =
Dew did not occur at the time
|
|
12
|
Frost
|
Frost phenomenon
|
1
|
1 =
Frost occurred at the time
0 =
Frost did not occur at the time
|
|
13
|
ICE
|
Icing phenomenon
|
1
|
1 =
Icing occurred at the time
0 =
Icing did not occur at the time
|
4.2
Data Results
In accordance with the provisions of the Specifications for
Surface Meteorological Observations[11]: “If the number of missing
observations in a month reaches 7 or more, the month shall be excluded from
monthly statistics and treated as missing data; if a year contains 1 or more
months excluded from monthly statistics, the year shall be excluded from annual
statistics and treated as missing data”. Based on The comprehensive
identification dataset for dew, frost, and icing phenomena in China
(2018–2024), annual day-count series of dew, frost, and ice from 2019 to 2024
at 2,164 surface meteorological stations across China were statistically
derived (data for 2018 were excluded from annual statistics due to only 1.5
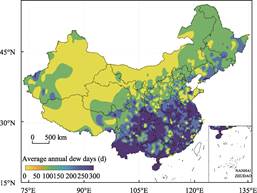
months of records being available). Figures 1–3 illustrate the spatial
distributions of the annual average days of dew, frost, and icing,
respectively, which were generated using the thin plate spline interpolation
method. As presented in Figure 1, the annual dew days in China generally
exhibit a spatial pattern of “more in the south and fewer in the north”.
Southwest China records the longest annual dew days nationwide, with most
stations documenting over 250 d—for example, Kunming (271 d), Dali (337 d), and
Suichuan County in Jiangxi Province, which has the highest number of dew days
(361 d) in the country. In contrast, the northern regions have relatively fewer
annual dew days, particularly in Northwest China, where most stations report
fewer than 50 d. For instance, Hami and Karamay in Xinjiang both have
approximately 20 d of dew per year, with Turpan in Xinjiang recording the
minimum of 1 d. Notably, alpine meteorological stations observe fewer dew days
compared to surrounding lowland stations—for example, Wutai Mountain Station
has an average of only 30 d, and Songshan Mountain Station only 2 d, both
significantly lower than those at nearby lowland stations.
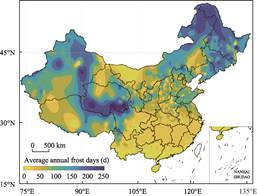
As
presented in Figure 2, the spatial distribution of frost days exhibits an
opposite pattern to that of dew days, characterized by “more in the north and
fewer in the south”. High-value regions of annual frost days are concentrated
in the Sichuan-Qinghai border area, the eastern parts of Northeast China
(encompassing Heilongjiang, Jilin, and Inner Mongolia), and northern Xinjiang.
Among all observational stations, Maduo County in Qinghai Province records the
highest annual frost days at 251. Stations including Mohe in Heilongjiang, Seda
in Sichuan, Bayanbulak in Xinjiang, and Arxan in Inner Mongolia all document
over 200 frost days per year. Frost is absent in areas south of 21°N latitude.
Notably, Menghai in Yunnan Province—situated north of 21°N—has the fewest frost
days in this latitudinal zone, with an annual record of only 1 frost day.
|
|
|
|
Figure
1 Distribution map
of average annual dew days
|
Figure
2 Distribution map of
average annual frost days
|
|
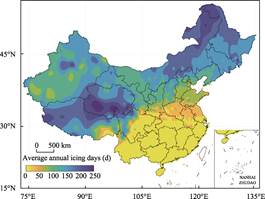
Figure 3 Distribution map of average annual
icing days
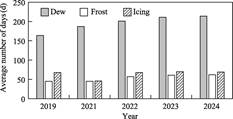
Figure 4 Average
annual dew, frost, and icing
days sequence in China
|
As
presented in Figure 3, the spatial distribution of icing days in China exhibits
a pattern of “more in the north and fewer in the south”, with high-value
regions concentrated in Qinghai Province, Xinjiang Uygur Autonomous Region, and
Northeast China. For instance, Wudaoliang Station in Qinghai records 282 annual
icing days, while Tianshan Daxigou Station in Xinjiang documents 232 d. In Northeast
China, both Xinlin and Mohe in Heilongjiang Province have over 220 icing days
per year. Icing phenomena are absent in areas south of 23°N latitude. North of
23°N, stations with the fewest icing days—such as Tengchong in Yunnan Province
and Zijin in Guangdong Province—record only 1 icing day annually.
Figure
4 illustrates the national average annual sequence of dew days, frost days, and
icing days in China from 2019 to 2024. The multi-year national average annual
dew days amount to 196, with an average of 54 frost days and 65 icing days per
year (due to widespread missing data exceeding 7 d at many stations in July
2020, the statistics of dew days, frost days, and ice days for 2020 are
recorded as missing). As presented in the figure, the annual average dew days
exhibit an overall increasing trend, rising from 164 d in 2019 to 205 d in
2024, with a cumulative growth rate of 5.48%. Unlike the continuous growth of
dew days, the frost day sequence remains relatively stable—recording 45 d both
in 2019 and 2021—before increasing to 62 d in 2024. The minimum number of icing
days occurred in 2021 (46 d), while in other years, the number of icing days
remained around 70 d, showing a relatively gentle variation trend.
4.3
Data Validation
The performance of the comprehensive identification product
is evaluated using manual observation data from November 15, 2018, to November
14, 2019. Given that the manual observation data are of daily frequency,
whereas the comprehensive identification product adopts an hourly resolution, a
temporal aggregation approach is employed to facilitate performance evaluation:
if the product detects the occurrence of dew, frost, or icing phenomena at any
hour within a single day, the corresponding weather phenomenon is deemed to
have occurred on that day. Subsequently, the consistency between the aggregated
product results and the manual observation data is quantified. A higher
consistency rate indicates superior discriminative performance of the product,
while a lower rate reflects inadequate performance.
Table
5 presents the overall evaluation results of the comprehensive identification
product. For the dew identification product, the number of consistent cases
where both national manual observations and the product recorded dew occurrence
was 151,476, while the number of consistent cases where both recorded no dew
was 432,211, resulting in an overall consistency rate of 65.57% for dew
identification. The number of dew occurrences detected by the product is
significantly higher than that recorded by manual observations. This
discrepancy is partly attributed to the fact that dew often forms first on
winter nights and subsequently freezes into frost; in early morning
observations, only frost is recorded, with dew omitted. On the other hand,
according to meteorological observational standards, dew formed by melted frost
is not counted as valid dew. In winter, mixed occurrences of frost and dew are
common, and dew formation during frost melting also contributes to the
underrecording of dew in manual observations. For the frost identification
product, the number of consistent cases where both manual observations and the
product recorded frost occurrence was 95,204, and the number of consistent
cases where both recorded no frost was 714,061, with an overall consistency
rate of 90.90%. Similarly, the product detected more frost occurrences than
manual observations. This is primarily due to the nocturnal formation
characteristic of frost: after 2013, nighttime observation periods were
canceled at national general meteorological stations, leading to the
underrecording of nighttime frost in manual observations. Regarding the icing
identification product, the number of consistent cases where both manual
observations and the product recorded icing occurrence was 176,285, and the
number of consistent cases where both recorded no icing was 671,718, achieving
an overall consistency rate of 95.26%. Compared with manual observations, the
product exhibits fewer underdetection and misdetection events, and can
effectively reflect the actual occurrence of icing phenomena.
Table 5 Overall evaluation results of the
comprehensive identification product for dew, frost, and icing Phenomena
|
Weather phenomenon
|
Manual observation: Present / Product identification:
Present (times)
|
Manual observation: Present / Product identification:
Absent (times)
|
Manual observation: Absent / Product identification:
Present (times)
|
Manual observation: Absent / Product identification:
Absent (times)
|
Consistency rate (%)
|
|
Dew
|
151,476
|
30,354
|
276,188
|
432,211
|
65.57
|
|
Frost
|
95,204
|
23,534
|
57,435
|
714,061
|
90.90
|
|
Icing
|
176,285
|
19,111
|
23,120
|
671,718
|
95.26
|
5
Discussion and Conclusion
This product is primarily generated through a comprehensive
identification process, which integrates Bayesian discriminant models
(constructed via the Bayesian discriminant method) for dew, frost, and icing
phenomena with surface meteorological observation elements (e.g., temperature,
humidity, and wind speed). Verification and evaluation results indicate that
the overall consistency rates for the comprehensive identification of dew,
frost, and icing are 65.57%, 90.90%, and 95.26%, respectively. However, the
identification accuracy of certain stations remains unsatisfactory, with
relatively frequent missed detections and false alarms. This is partly
attributed to the use of manual observation data for both model training and
validation: factors such as strong subjectivity in manual recording and low
observation frequency undermine the reliability of the datasets. On the other
hand, during the construction of the Bayesian discriminant models, limitations
including the insufficient selection of influencing factors, inadequate data
volume, and uneven data distribution have led to compromised generalization
ability of the trained models. To address the these issues, optimizations can
be implemented from 3 aspects: (1) Integrate automated observation devices
(e.g., intelligent video-based weather phenomenon monitors) to collect
real-scenario data, supplementing small-sample categories and edge-case data;
(2) Strengthen dataset cleaning and anomaly detection, utilizing clustering
algorithms to identify and filter outliers, thereby improving data reliability;
(3) Replace the Bayesian models with moderately complex models (e.g., deep
learning models) and conduct multi-dimensional performance evaluation using
metrics such as precision, recall, and F1-score to refine model performance.
This
product is now officially operational nationwide across China’s meteorological
departments, replacing manual observations of dew, frost, and icing phenomena.
It can provide fundamental support for
weather forecasting, agrometeorological services, road traffic forecasting,
service provision, and other related fields. However, the product is limited by
its low spatial resolution, which is insufficient to meet the requirements of
refined meteorological services. In future work, combined with surface gridded
analysis data, efforts will be devoted to developing national gridded analysis
products for dew, frost, and icing phenomena.
Author Contributions
Wen, H. Y. contributed to the overall design of the
dataset development. Zhu, H. L. designed the models and algorithms, and
conducted the evaluation and validation of the dataset product. Zhang, M. M.
and Hong, C. collected and preprocessed the observational data of weather
conditions conducive to the formation of dew, frost, and icing phenomena. Zhu,
H. L. and Zhang, M. M. wrote the data paper.
Conflicts of Interest
The
authors declare no conflicts of interest.
References
[1]
Ma, B.,
Tian, J. C., He, J. Y., et al.
Mechanism of dew formation in the arid zone of central Ningxia and its impact
on surface soil moisture [J]. Advances in
Water Science, 2022, 33(6):
955–966.
[2]
Wang, Y.,
Qiu, X. L., Li, Y. X., et al. Risk
assessment of forest and fruit yield reduction caused by frost damage based on
phenological period: a case study of Hebei Province [J]. Chinese Journal of Agrometeorology, 2022, 4(10): 821–831.
[3]
Zhang, B., Sun, S. S., Ding, L. G., et
al. Hazard analysis and zoning of spring tea frost damage in Guizhou [J]. Journal
of Meteorology and Environment,
2023, 39(5): 99–105.
[4]
Bao, L. L.,
Cheng, P., Wang, X. Y., et al. Road
icing early warning in Gansu Province based on Logistic regression and neural
network [J]. Journal of Arid Meteorology, 2024, 42(1): 137–145.
[5]
Zhang, H.
F., Lu, S., Shen, J. J., et al.
Spatiotemporal variation characteristics of road icing in Shaanxi and its risk
early warning model [J]. Journal of Arid
Meteorology, 2020, 38(5):
878–885.
[6]
Song, P.,
Che, J. H., Guo, T. T., et al.
Low-temperature climatic characteristics and SVM prediction model of the
highway pavement around Jiaozhou Bay [J]. Journal
of Marine Meteorology, 2023,
43(3): 80–87.
[7]
Wang, K. X.,
Bao, Y. X., Zhu, C. Y., et al.
Application of random forest regression in winter pavement temperature
prediction [J]. Meteorological Monthly, 2021, 47(1): 82–93.
[8]
Zou, L. J., Liu, S., Lu, Q. J. Pavement temperature model and icing
potential based on neural network [J]. Highway, 2022, 67(10): 409–414.
[9]
Zhang, Q.
K., Xiang, Y., Ji, Z. M., et al.
Climatic characteristics and trend analysis of icing phenomena in Anhui
Province in recent 55 years [J]. Journal
of Natural Disasters, 2020,
29(6): 218–226.
[10]
Hua, L. S.,
Wen, H. Y., Zhu, H. L., et al.
Discussion on automatic observation model of frost formation based on Bayesian
discrimination method [J]. Meteorological
Monthly, 2015, 41(8):
964–969.
[11]
China
Meteorological Administration. Specifications for Surface Meteorological
Observations [M]. Beijing: China Meteorological Press, 2003: 21–27.
[12]
Wen, H. Y.,
Zhu, H. L., Ma, W. Z., et al.
Correction of icing phenomenon data series based on Bayesian discrimination
method [J]. Meteorological Monthly, 2021, 47(9): 1113–1121.
[13]
Shi, C. C.
Pavement icing monitoring and early warning system based on machine vision [J].
Electronic Design Engineering, 2025, 33(6): 34–38.
[14]
Zhao, X. K.,
Hu, Z., Zhang, J. P., et al. Research
progress on intelligent monitoring of pavement icing based on optical fiber
sensing technology [J]. Journal of Jilin
University (Engineering and Technology Edition), 2023, 53(6): 1566–1579.
[15]
Xie, Q. Z.,
Wang, L., Ge, J. Y., et al. Design of
polymer optical fiber icing sensor and method for detecting pavement ice layer
thickness [J]. Journal of China & Foreign Highway, 2023,
43(4): 59–67.
[16]
Ma, S. Q.,
Wu, K. J., Chen, D. D., et al. Design
of automatic observation system for weather phenomena [J]. Meteorological Monthly, 2011,
37(9): 1166–1172.
[17]
Ran, B.,
Zhang, Z. Y., Yang, J. B., et al. Formation law of condensed water on
Artemisia ordosica in the Mu Us Sandy Land and its impact on water balance [J].
Transactions of the Chinese Society of
Agricultural Engineering, 2023,
39(8): 111–119.
[18]
Zhu, H. L.,
Zhang, M. M., Hong, C., et al. The comprehensive identification dataset
for dew, frost, and icing phenomena in China (2018–2024) [J/DB/OL]. Digital
Journal of Global Change Data Repository, 2025.
https://doi.org/10.3974/geodb.2025.10.04.V1.
[19]
GCdataPR
Editorial Office. GCdataPR data sharing policy [OL].
https://doi.org/10.3974/dp.policy.2014.05 (Updated 2017).