Spatiotemporal
Evolution Dataset Development of Habitat Quality and Multi-Scenario
Simulation in Yuanjiang-Jinshajiang-Minjiang Dry Valleys (2000–2040)
GUO Yalin1* WANG Yucai1 YAN Weipo2 WANG Qing1 ZHANG Yu1
1. School
of Environment and Resource, Southwest University of Science and Technology,
Mianyang 621010, China;
2. Sichuan Academy of Environmental Policy and
Planning, Chengdu 610041, China
Abstract: The spatiotemporal evolution of habitat quality in dry
valleys serves as an important indicator of regional ecological security. With
the intensification of anthropogenic activities and rapid changes in land use
patterns, the risk of habitat quality degradation in dry valleys is becoming
increasingly prominent, posing severe challenges to regional ecological
security. This study focuses on the Yuanjiang dry-hot valley, the Jinshajiang
dry-warm valley (Shangri-La-Lijiang section), and the upper Minjiang
dry-temperate valley. Based on land use data from 2000, 2010, and 2020, a coupled
FLUS-InVEST model was constructed to analyze the spatiotemporal evolution of
historical habitat quality. Three scenarios—natural development,
farmland protection, and ecological restoration— were then used to
simulate land use patterns and predict habitat quality in 2040. These analyses
generated a dataset describing spatiotemporal evolution and multiscenario based
simulations and predictions of habitat quality in the dry valleys of the
Yuanjiang, Jinshajiang, and upper Minjiang Rivers (2000–2040). Model
reliability was verified using the kappa coefficient and overall accuracy; the kappa coefficients for the three regions were 0.80, 0.81,
and 0.87, respectively, and all overall accuracies exceeded 0.88, indicating
that the model has good applicability in each region. The dataset comprises (1)
study area boundary data; (2) simulated land use type data at 1 km resolution
for the study areas in 2040 under the three scenarios; (3) spatial distribution
data of habitat quality at 1 km resolution for the study areas in 2000, 2010,
2020, and 2040 (under the three simulated scenarios); and (4) statistical data
of habitat quality for the study areas during different periods. This dataset
systematically reflects the differentiated response patterns of habitat quality
to land use changes across the three types of dry valleys and can provide
fundamental data support for land use optimization, ecological risk
identification, and zoning management in dry valley regions. The dataset is
archived in .shp, .tif, .xls and .txt formats, and consists of 179 data files
with data size of 967 KB (compressed into one file with 679 KB).
Keywords:
dry valley;
land-use change; habitat quality evolution; FLUS-InVEST model; multi-scenario
simulation
DOI: https://doi.org/10.3974/geodp.2026.05.11
Dataset Availability Statement:
The dataset supporting this paper
was published and is accessible through the Digital Journal of Global Change Data Repository
at: https://doi.org/10.3974/geodb.2026.06.03.V1.
1 Introduction
Dry
valleys represent a unique type of ecological landscape in the Hengduan
Mountains and are characterized by low precipitation, intense evaporation, low
vegetation coverage, and limited ecological recovery capacity, making them
extremely sensitive to external disturbances[1]. Based on
climatic, vegetation, and soil characteristics, the dry valleys in the Hengduan
Mountains can be classified into 3 types: dry-hot valleys, dry-warm valleys,
and dry-temperate valleys[2,3]. In recent years, under the
combined effects of anthropogenic activities and natural factors, land use
patterns in dry valley areas have undergone significant changes, and habitat
degradation has accelerated in some regions, posing severe challenges to
regional sustainable development and the performance of ecological functions.
Habitat quality is an important indicator for measuring ecosystem health and
biodiversity conservation. Its spatiotemporal evolution is essential for
identifying regional ecological risks and formulating conservation strategies
and has become a key concern in the fields of ecological protection and
sustainable development[4].
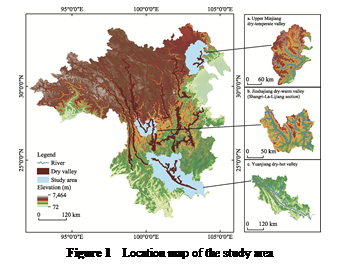 In view of this context, 3
typical dry valleys in the Hengduan Mountains—the Yuanjiang dry-hot valley, the
upper Minjiang dry-temperate valley, and the Jinshajiang dry-warm valley
(Shangri-La-Lijiang section)—were selected as the research objects (Figure 1).
Based on land use data from 2000, 2010, and
2020, a coupled FLUS-InVEST model was constructed, and 3 scenarios—natural
development, farmland protection, and ecological restoration—were established.
A dataset of spatiotemporal evolution, multi-scenario simulation and
prediction of habitat quality in the dry valleys of the Yuanjiang, Jinshajiang,
and upper Minjiang Rivers (2000– 2040) was developed, elucidating the
differentiated response patterns of habitat quality to land use changes in the
three types of dry valleys. This dataset can
provide fundamental data support for land use optimization, ecological
risk identification, and zoning management in dry valley regions.
2 Metadata of
the Dataset
The metadata of the
Spatiotemporal evolution dataset of habitat quality and multi-scenario
simulation in Yuanjiang-Jinshajiang-Minjiang dry valleys (2000–2040)[5]
is summarized in Table 1. It includes the dataset full name, short name,
authors, year of the dataset, temporal resolution, spatial resolution, data
format, data size, data files, data publisher, etc.
Table 1 Metadata summary of the Spatiotemporal evolution dataset of habitat quality and
multi-scenario simulation in Yuanjiang-Jinshajiang-Minjiang dry valleys
(2000–2040)
|
Item
|
Description
|
|
Dataset full name
|
Spatiotemporal
evolution dataset of habitat quality and multi-scenario simulation in
Yuanjiang-Jinshajiang-Minjiang dry valleys (2000–2040)
|
|
Dataset short name
|
HabitatQuality&Simulation_2000-2040
|
|
Authors
|
Guo, Y. L.,
School of Environment and Resource,Southwest University of
Science and Technology, guoyalin_linda@163.com
Wang, Y. C.,
School of Environment and Resource,Southwest University of
Science and Technology, 2792387745@qq.com
Yan, W. P., Sichuan Academy of Environmental Policy and Planning, yanweipo@scaepp.cn
Wang, Q., School
of Environment and Resource,Southwest University of Science and Technology,
qingw@imde.ac.cn
Zhang, Y., School
of Environment and Resource,Southwest University of Science and Technology, zy_upup@outlook.com
|
|
Geographical region
|
Yuanjiang-Jinshajiang-Minjiang
dry valleys
|
|
Year
|
2000, 2010, 2020,
2040
|
|
Temporal
resolution
|
Year
|
|
Spatial
resolution
|
1 km
|
|
Data format
|
.shp, .tif, .xls,
.txt
|
|
Data size
|
967 KB
|
|
Data files
|
Study area
boundary data; Simulated land use type data in 2040, spatial distribution
data for habitat quality in 2000, 2010, 2020, and 2040 under three scenarios;
Statistical data on habitat quality during different periods
|
|
Foundations
|
Natural Science
Foundation of Sichuan Province (2026NSFSC1172); Ministry of Science and
Technology of P. R. China (2015BAC05B05-01); National Natural Science
Foundation of China (41071115)
|
|
Data publisher
|
Global Change Research Data Publishing & Repository,
http://www.geodoi.ac.cn
|
|
Address
|
No. 11A, Datun
Road, Chaoyang District, Beijing 100101, China
|
|
Data sharing
policy
|
(1) Data are openly available and can be
free downloaded via the Internet; (2) End users are encouraged to use Data subject to citation; (3) Users,
who are by definition also value-added service providers, are welcome to
redistribute Data subject to
written permission from the GCdataPR Editorial Office and the issuance of a Data redistribution license; and (4)
If Data are used to compile new
datasets, the “ten percent principle” should be followed such that Data records utilized should not
surpass 10% of the new dataset contents, while sources should be clearly
noted in suitable places in the new dataset[6]
|
|
Communication and searchable system
|
DOI, CSTR,
Crossref, DCI, CSCD, CNKI, SciEngine, WDS, GEOSS, PubScholar, CKRSC, OARL
|
3 Methods
3.1 Data Sources
The
basic data used in this study cover 3 major categories—land use, physical
geography, and socioeconomic—with a total of 13 indicators (Table 2). The land
use data were obtained from the National Cryosphere Desert
Data Center at a spatial resolution of
30 m and included 8 land use types: cropland, forestland, shrubland, grassland,
water body, ice/snow, bare land, and impervious surface. Physical geography
data included elevation, slope, aspect, mean annual temperature, annual
precipitation, and the normalized difference vegetation index (NDVI). Elevation
data were acquired from the Geospatial Data Cloud platform at a 30
m spatial resolution; slope and aspect data were derived from the Digital
Elevation Model (DEM) using GIS tools. The mean annual temperature, annual
precipitation, and NDVI were sourced from the Earth Resource Data Cloud
platform at a
spatial resolution of 1 km. Socioeconomic data includes the nighttime light
index, GDP density, population density, road distribution, and distance to the
nearest government seat. Specifically, the nighttime light index data were
obtained from the Resource and Environment Science Data Platform; GDP
density and population density data were derived from the LandScan dataset, all at
1 km spatial resolution. Road data were freely downloaded from OpenStreetMap.
The distance to the nearest government seat was characterized by the Euclidean
distance, which is based on the government seat locations provided by the National
Catalogue Service for Geographic Information. To meet
the operational requirements of the FLUS model, all data were uniformly
resampled to a 1 km resolution and projected to the WGS_1984_UTM_46N coordinate
system.
Table 2
Main data sources and descriptions
|
Data category
|
Data name
|
Year
|
Spatial resolution
|
Data source
|
|
Land
use
|
Land
use raster data
|
2000,
2010, 2020
|
30 m
|
National
Cryosphere Desert Data Center
|
|
Physical
geography
|
Elevation
|
–
|
30 m
|
Geospatial
Data Cloud
|
|
|
Slope
|
–
|
30 m
|
Derived
from DEM using GIS tools
|
|
|
Aspect
|
–
|
30 m
|
Derived
from DEM using GIS tools
|
|
|
Mean
annual temperature
|
2000,
2010, 2020
|
1 km
|
Earth
Resource Data Cloud
|
|
|
Annual
precipitation
|
2000,
2010, 2020
|
1 km
|
Earth
Resource Data Cloud
|
|
|
Normalized difference vegetation index (NDVI)
|
2000,
2010, 2020
|
1 km
|
Earth
Resource Data Cloud
|
|
Socioeconomic
|
Nighttime
light index
|
2000,
2010, 2020
|
1 km
|
Resource
and Environment Science Data Platform
|
|
|
Population
density
|
2000,
2010, 2020
|
1 km
|
LandScan
dataset
|
|
|
GDP
density
|
2000,
2010, 2020
|
1 km
|
LandScan
dataset
|
|
|
Distance
to road
|
2019
|
–
|
OpenStreetMap
|
|
|
Distance
to railway
|
2019
|
–
|
OpenStreetMap
|
|
|
Distance to the nearest government seat
|
2019
|
–
|
National
Catalogue Service for Geographic Information
|
3.2 Algorithm
3.2.1 Land Use Simulation based on the FLUS Model
The
future land use simulation (FLUS) model is a tool for multi-scenario simulation
and prediction of spatiotemporal changes in land use types[7]. The model incorporates an artificial neural
network (ANN) algorithm to derive the suitability probability of each land
use type from a single period of land use data and multiple driving factors.
Moreover, it employs a self-adaptive inertia competition mechanism based on
roulette wheel selection, which addresses the uncertainty and complexity of
mutual conversions among multiple land use types by adjusting parameters such
as the neighborhood factor,
inertia coefficient, and conversion cost, thereby improving simulation accuracy[8,9]. The simulation performance of the model largely depends on the
rational selection of driving factors. Land use change results from the
combined effects of physical, geographic, and socioeconomic factors. Therefore,
by considering the regional context and referring to the relevant literature[10],
this study selected a total of 12 indicators from 2 categories—physical
geography (elevation, slope, aspect, mean annual temperature, annual
precipitation, NDVI, and distance to river) and socioeconomics (nighttime light
index, GDP density, population density, distance to road, and distance to the
nearest government seat)—as the driving factors (Table 2) for the FLUS model to
simulate and predict future land use patterns.
Based on the
policies and development goals of the study area and with reference to the
relevant literature[11], 3 scenarios—natural
development, farmland protection, and ecological restoration—were established
to simulate land use patterns for 2040.
(1) Natural
development scenario: This scenario follows the historical trends of land use
change in dry valleys from 2000 to 2020 without imposing additional policy
constraints, reflecting the trajectory of natural evolution.
(2) Farmland
protection scenario: In accordance with the national food security strategy and
the requirements of the farmland conservation redline policy, the probability
of farmland conversion is strictly controlled to strengthen the protection of
cultivated land.
(3) Ecological
restoration scenario: Aligned with national ecological restoration projects and
green development strategies, this scenario focuses on promoting the expansion
of ecological land such as grassland and forestland, restricting the growth of
nonecological land, and achieving the comprehensive management goals of soil
erosion and desertification control in dry valley regions.
3.2.2 Habitat Quality Assessment based on the InVEST Model
In
this study, the habitat quality module of the InVEST model was used to assess
the habitat quality of 3 typical dry valleys in the Hengduan Mountains. This
module is based on land use data and considers human activities that cause
habitat degradation as threat factors. It accounts for the maximum influence
distance and weight of each threat factor, as well as the sensitivity of
different land use types to each threat factor[12]. Cropland and impervious surfaces are associated with intense
anthropogenic activities, while bare land, which lacks vegetation cover and is
prone to weathering and erosion, has a high risk of land degradation[13].
Therefore, cropland, bare land, and impervious surfaces were selected as threat
sources. The model-related parameter settings are shown in Tables 3 and 4.
Table 3 Threat factor attributes
|
Threat
factor
|
Maximum distance
|
Weight
|
Decay type
|
|
Cropland
|
5
|
0.5
|
Exponential
|
|
Bare land
|
3
|
0.3
|
Exponential
|
|
Impervious surface
|
8
|
0.9
|
Linear
|
Table 4 Sensitivity of land use types to habitat
threat factors
|
Land use type
|
Habitat suitability
|
Threat
factor
|
|
Cropland
|
Bare land
|
Impervious surface
|
|
Cropland
|
0.25
|
0.3
|
0.4
|
0.1
|
|
Forestland
|
1
|
0.8
|
0.5
|
0.7
|
|
Shrubland
|
0.8
|
0.6
|
0.6
|
0.6
|
|
Grassland
|
0.8
|
0.4
|
0.5
|
0.6
|
|
Water body
|
0.9
|
0.65
|
0.4
|
0.8
|
|
Ice/snow
|
0.5
|
0.1
|
0.1
|
0.1
|
|
Bare land
|
0.1
|
0.1
|
0.2
|
0.1
|
|
Impervious surface
|
0
|
0
|
0
|
0
|
|
Wetland
|
0.75
|
0.7
|
0.4
|
0.9
|
In the habitat
quality assessment of the InVEST model, the degree of habitat degradation
serves as the basis for calculating habitat quality, and its expression is as
follows:
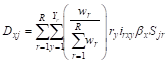 (1)
where Dxj denotes the degree
of habitat
degradation of grid cell x in land use type j, which
ranges from
0 to 1; R is the number of threat factors; r represents the r-th threat factor; Yr denotes the total number of grid cells of threat factor r; wr represents the weight of threat factor r, ranging from 0 to 1; ry denotes the stress
intensity of threat factor r on grid cell y; irxy represents the influence
of threat factor r from grid cell y to grid cell x, which may follow
either linear or exponential decay; βx denotes the accessibility or protection level of grid cell x; and Sjr represents the sensitivity of land use type j to threat factor r.
The habitat
quality index is calculated as follows:
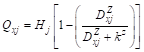 (2)
where Qxj denotes the degree
of habitat
quality of grid cell x in land use type j, which ranges from 0 to 1, with higher values
indicating better habitat quality and greater suitability for species survival; Hj and Dxj represent the degree
of habitat
suitability and degree of habitat degradation, respectively, of land use type j; z is a normalization constant, usually set to 2.5; and k is the half-saturation
constant used to adjust the distribution and variation range of habitat quality
values. All variables above are dimensionless;
however, the spatial distance used to calculate the influence decay (irxy)
is measured in meters (m).
4 Data Results and Validation
4.1 Dataset Composition
The dataset comprises: (1) study area boundary data (.shp); (2) simulated land use
type data at 1 km resolution for the study areas in 2040 under three scenarios
(.tif); (3) spatial distribution data for habitat quality at 1 km resolution
for the study areas in 2000, 2010, 2020, and 2040 (under the three simulated
scenarios) (.tif); and (4) statistical data on habitat quality for the study
areas during different periods (.xls).
4.2 Data Validation
To evaluate the applicability of the FLUS model in
the study areas, this study used the kappa coefficient to verify the simulation
accuracy of the FLUS model. The kappa coefficient ranges from 0 to 1, with
larger values indicating higher simulation accuracy; a value greater than 0.70
is generally considered to represent relatively high accuracy[7].
The specific validation procedure was as follows: based on the land use data of
the study areas in 2000 and 2010 and the 12 driving factors, the FLUS model was
used to simulate and predict the land use pattern in 2020 for each region. The
simulation results were then compared with the actual land use data for 2020,
and the kappa coefficient and overall accuracy (OA) were calculated. The
validation results revealed that the kappa coefficients for the Yuanjiang
dry-hot valley, the upper Minjiang dry-temperate valley, and the Jinshajiang
dry-warm valley (Shangri-La-Lijiang section) were 0.80, 0.87, and 0.81,
respectively, and the OA values were all greater than 0.88, indicating that the
FLUS model has good applicability in each region and can be used for multi-scenario
simulations of future land use patterns in 2040.
In addition, the
simulated habitat quality results were highly consistent with the regional land
use transition patterns: regions with more dramatic land use change exhibited
correspondingly greater changes in habitat quality. Under the three scenarios,
the variation ranges of habitat quality index relative to the 2020 baseline
were 0.006–0.012 for the Yuanjiang dry-hot valley, 0.003–0.013 for the upper
Minjiang dry-temperate valley, and 0.001 for the Jinshajiang dry-warm valley
(Shangri-La-Lijiang section) (the index was 0.912 under all three scenarios),
reflecting the differentiated response characteristics of different regions to
land use policy interventions and supporting the rationality of the assessment
results.
4.3 Data Results
Analysis
4.3.1 Evolution of Land Use Types in Each Region
Forests
were the dominant land use type in all three study areas: the Yuanjiang dry-hot
valley, the upper Minjiang dry-temperate valley, and the Jinshajiang dry-warm
valley (Shangri-La-Lijiang section). From 2000 to 2020, the common trends of
land use transformation in the three regions were a decrease in grassland and
an expansion of impervious surfaces, but the evolutionary pathways differed
significantly (Table 5). In the Yuanjiang dry-hot valley, cropland, shrubland,
and impervious surface areas increased by 945.20 km2, 661.42 km2,
and 109.94 km2, respectively, whereas forestland and grassland areas
decreased by 1,020.96 km2 and 697.42 km2, respectively.
The conversion was dominated by the transformation from forestland and
grassland to cropland, with some cropland converted to impervious surfaces,
reflecting the encroachment of agricultural production and urban development on
ecological space. In the upper Minjiang dry-temperate valley, grassland and
cropland decreased by 332.56 km2 and 168.79 km2, respectively,
while forestland increased by 334.23 km2. The conversion was
dominated by the transformation from grassland and cropland to forestland,
reflecting an internal structural adjustment of ecological land. In the
Jinshajiang dry-warm valley (Shangri-La-Lijiang section), grassland decreased by
328.76 km2, whereas cropland and forestland increased by 169.30 km2
and 102.56 km2, respectively, and impervious surfaces expanded
notably (+4.25 km2, +551.95%). The conversion was dominated by the
transformation from grassland to cropland and forestland, while cropland
continued to be converted to impervious surfaces, resulting in spatial
expansion characteristics driven jointly by urbanization and agricultural
development.
Table 5
Changes in land use types by region (2000–2020)
|
|
Yuanjiang dry-hot
valley
|
Upper Minjiang dry-temperate valley
|
Jinshajiang dry-warm valley (Shangri-La-Lijiang section)
|
|
Net change (km2)
|
Change rate (%)
|
Net change (km2)
|
Change rate (%)
|
Net change (km2)
|
Change rate (%)
|
|
Cropland
|
945.20
|
7.00
|
–168.79
|
–27.34
|
169.30
|
18.96
|
|
Forestland
|
–1,020.96
|
–2.15
|
334.23
|
2.39
|
102.56
|
0.95
|
|
Shrubland
|
661.42
|
38.74
|
–10.00
|
–4.85
|
40.65
|
22.14
|
|
Grassland
|
–697.42
|
–24.00
|
–332.56
|
–3.63
|
–328.76
|
–17.95
|
|
Water body
|
1.81
|
0.99
|
25.81
|
20.31
|
22.71
|
35.65
|
|
Ice/snow
|
/
|
/
|
25.61
|
28.76
|
18.28
|
85.70
|
|
Bare land
|
/
|
/
|
121.63
|
32.85
|
–28.99
|
–58.24
|
|
Impervious surface
|
109.94
|
106.73
|
4.07
|
45.17
|
4.25
|
551.95
|
Note: /indicates
no transition.
4.3.2 Multi-Scenario Simulation of Land Use Change
Under the three
development scenarios of natural development, farmland protection, and
ecological restoration, the responses of land use to policy interventions
varied considerably across regions (Figure 2). The Yuanjiang dry-hot valley
exhibited the most pronounced responses: under the natural development
scenario, cropland (+770.32 km2) and forestland (+269.89 km2)
expanded simultaneously; under the farmland protection scenario, cropland
expansion (+1,264.67 km2) and grassland contraction (–666.50 km2)
were particularly notable; and under the ecological restoration scenario, the
increase in forestland area (+2,016.62 km2) was the greatest among
the three regions, indicating a high sensitivity of
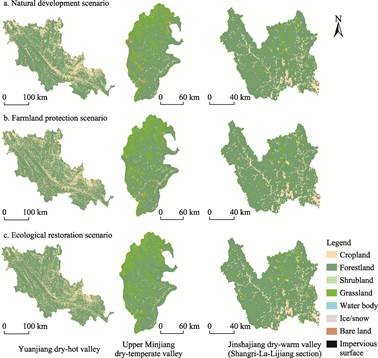
Figure 2 Spatial distribution maps of land use
types under different simulation scenarios (2040)
land
use to policy interventions in this area. The upper Minjiang dry-temperate
valley responded relatively positively to ecological restoration policies, with
notable effectiveness in bare land management (–347.08 km2,
–70.39%); however, under the natural development scenario, the trends of bare
land expansion (+158.47 km2) and ice/snow shrinkage (–28.78 km2)
warrant attention. In the Jinshajiang dry-warm valley (Shangri-La-Lijiang
section), land use change was the most moderate under all three scenarios, but
the expansion of forestland was limited (+0.98% under the natural development
scenario, +2.19% under the farmland protection scenario, and only –0.02% under
the ecological restoration scenario), indicating that because forest coverage
is already at a high level (>78%), the potential for further ecological
restoration gains is significantly constrained by baseline conditions. The
differing response characteristics of land use change in the three types of dry
valleys reflect the profound influence of regional natural background
conditions and differences in the intensity of human activities on the
effectiveness of policy interventions.
4.3.3 Spatiotemporal Variation Characteristics of Habitat Quality
An
equal-interval classification method was adopted to divide the habitat quality
index into 5 grades: low quality (0–0.2), relatively low quality (0.2–0.4),
moderate quality (0.4–0.6), relatively high quality (0.6–0.8), and high quality
(0.8–1). Overall, the habitat quality in the Yuanjiang dry-hot valley, the
upper Minjiang dry-temperate valley, and the Jinshajiang dry-warm valley
(Shangri-La-Lijiang section) exhibited pronounced temporal evolution and
spatial differentiation characteristics (Figure 3).
From 2000 to 2020, the habitat quality of
the Yuanjiang dry-hot valley tended to decrease, with relatively low-quality
habitat increasing by 942.57 km2 and moderate-quality habitat
emerging (210.93 km2), whereas high-quality habitat decreased by
1,054.63 km2. The habitat quality index decreased from 0.828±0.304
to 0.819 ± 0.310. In the upper Minjiang dry-temperate valley, the habitat
quality index increased from 0.888 ± 0.176 to 0.891±0.177. Specifically,
high-quality habitat remained largely stable (+17.18 km2), and relatively
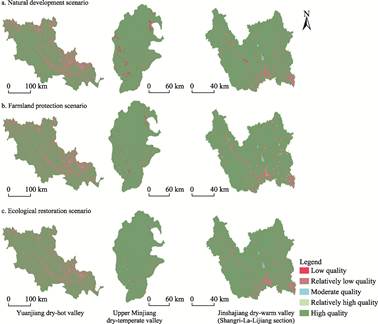
Figure 3 Distribution maps of habitat quality
classes under three simulation scenarios (2040)
low-quality
habitat decreased by 169.33 km2; however, low-quality and
moderate-quality habitat increased by 125.16 km2 and 26.99 km2,
respectively, indicating an emerging trend of low-quality habitat expansion. In
the Jinshajiang dry-warm valley (Shangri-La-Lijiang section), the area of
high-quality habitat decreased by 167.82 km2, while that of
relatively low-quality habitat increased by 167.77 km2, and the
habitat quality index decreased from 0.919±0.196 to 0.913±0.210.
From 2020 to 2040, under the natural development
scenario, habitat quality in all three regions tended to decrease. The farmland
protection scenario had negative effects on habitat quality in the Yuanjiang
dry-hot valley (the habitat quality index decreased to 0.807±0.319) and the
Jinshajiang dry-warm valley (Shangri-La-Lijiang section) (habitat quality index
decreased to 0.912±0.217) but had a slight positive effect in the upper
Minjiang dry-temperate valley (habitat quality index increased to 0.894±0.171),
reflecting regional variability in policy effects. Under the ecological
restoration scenario, the upper Minjiang dry-temperate valley showed the most
significant improvement in habitat quality (habitat quality index +0.013),
followed by the Yuanjiang dry-hot valley (+0.012), whereas the Jinshajiang
dry-warm valley (Shangri-La-Lijiang section) exhibited a slight decline
(–0.001), indicating that the marginal benefits of ecological restoration are
constrained by regional baseline conditions and that the space for ecological
recovery in high-altitude dry-warm valleys is limited.
5 Discussion and Conclusion
The
evolution of habitat quality in dry valleys has important indicative
significance for regional ecological security. However, under the influence of
different hydrothermal conditions, the responses of habitat quality to land use
change vary considerably among different types of dry valleys, which introduces
uncertainty into comparative studies across multiple types of dry valleys. The Spatiotemporal
evolution dataset of habitat quality and multi-scenario simulation in
Yuanjiang-Jinshajiang-Minjiang dry valleys (2000–2040) is based on a coupled
FLUS-InVEST model driven by multisource data, and the model reliability was
verified using the kappa coefficient and overall accuracy as dual indicators.
The kappa coefficients of the three typical regions are 0.80, 0.81, and 0.87,
respectively, and the overall accuracy values are all higher than 0.88,
indicating credible data quality. The development of this dataset effectively
fills the gap in comparative studies on the evolution patterns of habitat
quality in different types of dry valleys and provides a reliable foundation
for revealing the driving mechanisms underlying differences in habitat quality
degradation under different hydrothermal combinations.
At present, this
dataset has certain limitations. For example, the driving factors used in land
use change simulations do not fully incorporate dynamic variables such as
policy implementation intensity; the scenario settings are based on existing
policy frameworks and involve idealized assumptions; and the parameter settings
in the InVEST model, such as threat factor weights, maximum influence
distances, and habitat suitability, are somewhat empirical. Future research can
further improve simulation and assessment accuracy by introducing multisource
remote sensing data, optimizing localized parameter calibration, and adopting
multi-model integration methods, thereby providing more precise data support
for ecological risk identification and zoning management in dry valley regions.
Author Contributions
Guo,
Y. L. was in charge of overall design of the dataset development; Wang, Y. C.
and Yan, W. P. were responsible for data collection and processing, and for
designing the models and algorithms; Wang, Y. C., Guo, Y. L., Wang, Q. performed
data validation; Zhang, Y. conducted data verification and validation; Guo, Y.
L. and Wang, Y. C. drafted the data paper.
Conflicts of Interest
The
authors declare no conflicts of interest.
References
[1]
Wang, Z. L., Hu, B., Bao, W. K., et al. Latitudinal patterns and
underlying factors of component biomass in plant communities in the arid valley
of southwest China [J]. Chinese Journal of Plant Ecology, 2022, 46(5):
539–551.
[2]
Zhang, R. Z. The Dry Valleys of the Hengduan Mountains Region [M].
Beijing: Science Press, 1992.
[3]
Fan, J. R., Yang, C., Bao, W. K., et al. Distribution scope and
district statistical analysis of dry valleys in Southwest China [J]. Mountain
Research, 2020, 38(2): 303–313.
[4]
Zhang, Y. Z., Hu, Y. F., Han, Y. Q., et al. Spatial distributions
and evolutions of global major ecological degradation regions and research
hotspot regions [J]. Acta Ecologica Sinica, 2021, 41(19): 7599–7613.
[5]
Guo, Y.
L., Wang, Y. C., Yan, W. P., et al. Spatiotemporal evolution dataset of
habitat quality and multi-scenario simulation in Yuanjiang-Jinshajiang-Minjiang
dry valleys (2000–2040) [J/DB/OL]. Digital Journal of
Global Change Data Repository, 2026.
https://doi.org/10.3974/geodb.2026.06.03.V1.
[6]
GCdataPR Editorial Office. GCdataPR data sharing policy [OL].
https://doi.org/10.3974/dp.policy.2014.05 (Updated 2017).
[7]
Li, Y. X., Liu, Z. S., Li, S. J., et al. Multi-scenario
simulation analysis of land use and carbon storage changes in Changchun City
based on FLUS and InVEST model [J]. Land, 2022, 11(5): 647.
[8]
Lin, W. B., Sun, Y. M., Nijhuis, S., et al. Scenario-based flood
risk assessment for urbanizing deltas using future land-use simulation (FLUS):
Guangzhou Metropolitan Area as a case study [J]. Science of the Total
Environment, 2020, 739: 139899.
[9]
Su, J. C., Tang, B., Liu, Y., et al. Multi-scenario land use
change simulation and ecosystem service function evaluation in Bazhong City
based on FLUS model [J]. Environmental Ecology, 2023, 5(11): 17–25.
[10] Wang, L. Y., Zhang, Y. Evolution
of spatiotemporal patterns and multiscenario simulation of land use transition
in Gansu Province [J]. Arid Zone Research, 2025, 42(4): 695–707.
[11] Zuo, Q., Zhou, Y., Wang, L., et
al. Impacts of future land use changes on land use conflicts based on
multiple scenarios in the central mountain region, China [J]. Ecological
Indicators, 2022, 137: 108743.
[12]
Zhang, X., Li, Y. X., Lv, C. J., et al. Research progress on
application of ecosystem service functions based on InVEST model [J]. Ecological
Science, 2022, 41(1): 237–242.
[13]
Wang, B. X., Cheng, W. M. Effects of land use/cover on regional habitat
quality under different geomorphic types based on InVEST model [J]. Remote
Sensing, 2022, 14(5): 1279.