In Situ Soil Nitrogen Dataset Development from West
of the Baiyangdian Wetland for High-Nitrogen Accumulation Farmland Research
LV Qi1,2 WANG Shiqin1* TAN Kangda1,2 LIU Bingxia1 ZHENG Wenbo1
1. Center for Agricultural Resources Research, Institute of
Genetics and Developmental Biology, Chinese Academy of Sciences/Hebei Key
Laboratory of Agricultural Water-Saving, Shijiazhuang 050022, China;
2. University of Chinese
Academy of Sciences, Beijing 100049, China
Abstract: The
western agricultural region of Baiyangdian Wetland has long been subjected to
intensive agricultural production, irrigation, drainage, and nitrogen
fertilizer application, leading to significant nitrogen accumulation in soil
profiles and its migration into the deep vadose zone. Soil nitrate and nitrite
nitrogen are critical indicators for assessing nitrogen transport,
transformation, and the potential risk of groundwater contamination. To investigate the dynamics of water and nitrogen transport
in the vadose zone under different fertilization regimes, we conducted
long-term in situ monitoring from June 2023 to September 2024 in wheat-maize
rotation fields in Dulian Village, Anxin County, Xiong’an New Area. Three
management strategies were implemented, including conventional fertilization,
25% nitrogen reduction fertilization, and biochar combined with 25% nitrogen
reduction fertilization. Soil samples were collected at 11 vertical soil layers
across 5 sampling periods from different soil depths (0–10, 10–25, 25–50, 50–75,
75–100, 100–150, 150–200, 200–250, 250–300, 300–350, 350–400 cm). Soil water
content, nitrate nitrogen, and nitrite nitrogen were determined using the
oven-drying method and KCl extraction-automated discrete chemical analysis,
respectively. This study established a measured soil nitrogen dataset for
high-nitrogen accumulation farmlands in western Baiyangdian Wetland. The
dataset includes: (1) geolocation of the farmland plot; (2) vertically soil
texture classification; (3) soil water content; (4) measured nitrate nitrogen
values in different soil layers; and (5) measured nitrite nitrogen values in
different soil layers. The dataset is archived in .shp and .xlsx formats,
comprising 9 data files with data size of 41.8 KB (compressed into 1 file with
35.4 KB).
Keywords: Baiyangdian Wetland; high-nitrogen farmland; vadose zone; nitrate
nitrogen; nitrite nitrogen
DOI: https://doi.org/10.3974/geodp.2026.05.10
Dataset Availability Statement:
The
dataset supporting this paper was published and is accessible through the Digital
Journal of Global Change Data Repository at: https://doi.org/10.3974/geodb.2026.04.07.V1.
1 Introduction
Nitrogen
fertilizers are foundational to global agricultural productivity, while
rational nitrogen application can significantly boost crop yields and enhance
the soil fertility; however, their chronic overapplication has precipitated a
widespread ecological challenge characterized by massive soil nitrogen
surpluses and profound nitrate accumulation within soil profiles[1].
Because nitrate is highly mobile and water-soluble, it readily leaches deep
into the vadose zone via irrigation and precipitation infiltration, severely
elevating the risk of groundwater contamination[2,3]. Concurrently,
nitrite—though typically present at lower bulk concentrations—acts as a
critical intermediate in nitrification and denitrification pathways, serving as
a highly sensitive proxy for active soil nitrogen transformations and shifting
redox environments[4,5]. The vadose zone functions as the critical
biogeochemical interface governing these dynamic processes[6]. The
vadose zone functions as the critical biogeochemical interface governing these
dynamic processes. Consequently, stratifying nitrate and nitrite distributions
within this deep profile is essential for mechanistically understanding
agricultural nitrogen loss.
The Baiyangdian Wetland
basin, a critical freshwater wetland and the ecological linchpin of the Xiong’an
New Area, exemplifies this challenge. The farmland area in the western part of
Baiyangdian is closely connected with the water environment of the lake, and
factors such as nitrogen fertilizer input, irrigation regimes, rainfall
infiltration, and changes in groundwater depth during agricultural production
may all affect the migration and accumulation of soil nitrogen in the vadose
zone of farmland[7,8]. Its adjacent farmlands are subjected to
intensive wheat-maize rotations characterized by marked seasonal transitions
and heavy fertilization, creating a hydrological regime where high surface
nitrogen inputs drive continuous deep vertical leaching[9]. Obtaining
multi-temporal and multi-depth measured data of soil water content and nitrogen
under various fertilization regimes in farmlands of western Baiyangdian Lake
provides an essential foundation for assessing nitrogen environmental impacts
of farmland in this area..
In recent years,
reduced nitrogen fertilization and biochar co-application have been regarded as
important farmland management practices for reducing the risk of nitrogen
leaching, enhancing nitrogen use efficiency, and ameliorating soil
physicochemical properties[10,11]. Compared with conventional
fertilization, a 25% reduction in nitrogen application directly decreases
exogenous nitrogen input; biochar co-application with reduced nitrogen may
alter soil water movement and nitrogen migration characteristics[12]
by improving soil pore structure, enhancing soil water and nutrient retention
capacity, and affecting microbial nitrogen transformation processes[13].
Currently, for the
high nitrogen accumulation farmland area in Baiyangdian, existing studies[14,15]
indicate that long-term stratified measured data of soil profile nitrogen under
different fertilization regimes are relatively scarce, making it difficult to
support precise nitrogen management and non-point source pollution control. We
established permanent experimental plots in a typical farmland in Anxin County,
located within 10 km of the Baiyangdian Wetland. To isolate the mechanistic
effects of fertilization, all plots shared identical cropping and field
management conditions. Treatments included conventional fertilization, a 25%
reduced nitrogen fertilization, and a biochar-amended reduced nitrogen
treatment. Sampling was conducted across five critical phenological and
hydrological periods utilizing a high-resolution vertical stratification
strategy (11 depth intervals down to 400 cm) for soil water content, nitrate
nitrogen, and nitrite nitrogen concentrations. A measured dataset of soil
nitrogen was constructed for the high nitrogen accumulation agricultural area
in western Baiyangdian, aiming to reveal the spatiotemporal differentiation and
variation patterns of soil nitrogen, and to provide data support and a
scientific basis for agricultural nitrogen emission reduction and non-point
source pollution control in the Baiyangdian watershed.
2 Metadata of the Dataset
The
metadata of the In situ soil nitrogen dataset from west of the Baiyangdian Lake
for high-nitrogen accumulation farmland research[16] is summarized
in Table 1. It includes the dataset full name, short name, authors, year of the
dataset, temporal resolution, spatial resolution, data format, data size, data
files, data publisher, and data sharing policy, etc.
Table 1 Metadata summary of the In situ soil nitrogen dataset
from west of the Baiyangdian Lake for high-nitrogen accumulation farmland
research
|
Items
|
Description
|
|
Dataset full
name
|
In situ soil
nitrogen dataset from west of the Baiyangdian Lake for high-nitrogen
accumulation farmland research
|
|
Dataset
short name
|
SoilNitrogenBaiyangdianLake
|
|
Authors
|
Lv, Q.,
Center for Agricultural Resources Research, Institute of Genetics and
Developmental Biology, Chinese Academy of Sciences, lvqi22@mails.ucas.ac.cn
Wang, S. Q.,
Center for Agricultural Resources Research, Institute of Genetics and
Developmental Biology, Chinese Academy of Sciences, sqwang@sjziam.ac.cn
Tan, K. D.,
Center for Agricultural Resources Research, Institute of Genetics and
Developmental Biology, Chinese Academy of Sciences, tankangda@ms.sjziam.ac.cn
Liu, B. X.,
Center for Agricultural Resources Research, Institute of Genetics and
Developmental Biology, Chinese Academy of Sciences, bxliu@sjziam.ac.cn
Zheng, W.
B., Center for Agricultural Resources Research, Institute of Genetics and
Developmental Biology, Chinese Academy of Sciences, wbzheng@sjziam.ac.cn
|
|
Geographical
region
|
Dulian
Village, Anxin County, Xiong’an New Area, China
|
|
Year
|
2023–2024
|
|
Data format
|
.shp, .xlsx
|
|
Data size
|
41.8 KB
|
|
Data files
|
Geolocation
of the farmland plot; vertically stratified soil texture of the plot; soil
water content, measured nitrate nitrogen and measured nitrite nitrogen values
in different soil layers
|
|
Foundation
|
National Natural Science Foundation of China (442377080)
|
|
Data
publisher
|
Global
Change Research Data Publishing & Repository, http://www.geodoi.ac.cn
|
|
Address
|
No. 11A,
Datun Road, Chaoyang District, Beijing 100101, China
|
|
Data sharing
policy
|
(1) Data are openly available and can be freely
downloaded via the Internet. (2) End users are
encouraged to use Data subject to citation.
(3) Users, who are by definition also value-added service providers, are
welcome to redistribute Data subject to written permission from the GCdataPR
Editorial Office and the issuance of a Data redistribution license. (4) If
Data are used to compile new datasets, the “ten percent principle” should be
followed, such that the Data records utilized should not surpass 10% of the
new dataset contents, while sources should be clearly noted in suitable
places in the new dataset[17]
|
|
Communication and searchable
system
|
DOI, CSTR,
Crossref, DCI, CSCD, CNKI, SciEngine, WDS, GEOSS, PubScholar, CKRSC, OARL
|
3 Methods
3.1 Study Area
The
long-term in situ experiment was conducted in the intensively managed farmlands
of Dulian Village, Anxin County, located within the Xiong’an New Area (115°51′52″E,
38°51′57″N). Positioned less than 10 km from the western periphery of
Baiyangdian Wetland in the central North China Plain, the site represents a typical high-yield agricultural
zone characterized by flat terrain and a continuous winter wheat-summer maize
rotation system[14]. The region experiences a temperate
monsoonal continental climate heavily governed by the East Asian monsoon. Mean
annual temperature is 12.6 ℃[18], with a mean annual
precipitation of approximately 480.8 mm, the vast majority of which is
concentrated during the summer months between June and September.
3.2 Field Experimental
Design and Sampling
In June 2023, three permanent experimental plots were
established within a designated crop quality and yield
improvement demonstration zone (Figure 1). Each plot spanned 22 m in length, 10 m in width, and was bordered by 2-m
guard rows, yielding a total experimental area of 0.075 ha. Specifically, the
nitrogen (N) application rates using compound fertilizer in the conventional
fertilization (CF) treatment were 210 and 207 kg N/ha for winter wheat and
summer maize, respectively. In the 25% reduced nitrogen fertilization (RF)
treatment, the N rates for winter wheat and summer maize were reduced to 157.5
and 155.25 kg N/ha, respectively. For the biochar combined with reduced
nitrogen fertilization (BRN) treatment, biochar granules were additionally
applied at a rate of 225 kg/ha based on the RF nitrogen application rates. To
strictly isolate the environmental effects of varying nitrogen inputs, all
treatments were maintained under identical cropping systems and baseline field
management conditions. The long-term monitoring period for the plots extended
from June 2023 to September 2024, covering different crop growth stages and the
periods affected by fertilization, irrigation, and rainfall within the
wheat-maize rotation system.
During soil
sampling, 3 replicate samples were collected from plots under the same
fertilization regime using a soil auger at depths of 0–10, 10–25, 25–50, 50–75, 75–100, 100–150, 150–200, 200–250, 250–300, 300–350, and
350–400 cm, respectively. Each sample was placed separately in an
aluminum box and a self-sealing bag; the aluminum boxes were additionally
sealed with waterproof tape at the closure and immediately stored in a
refrigerator at 4 ℃.
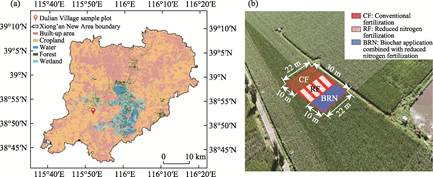
Figure 1 Map of the geographical location and
experimental layout of sample plots
3.3 Soil Chemical Analysis
Soil
samples stored in aluminum moisture tins were oven-dried at 105 ℃ for over
8 h until a constant weight was reached. The weights of the fresh soil plus
tin, dry soil plus tin, and the empty tin were recorded separately to calculate
the soil water content. For
inorganic nitrogen extraction, the homogenized fresh soil samples were
subjected to extraction utilizing a 2 mol/L KCl solution at a 1:10 (w/v)
soil-to-solution ratio. The resulting suspensions were subsequently centrifuged
and filtered. Concentrations of nitrate (NO3‒-N) and nitrite (NO2‒-N) were precisely
quantified using an automated discrete chemical analyzer (SmartChem 200).
3.4 Data Processing
The
soil water content was calculated using the following Equation:
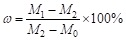 (1)
where  represents the gravimetric soil water
content (%);
 is the mass of the fresh soil plus the
aluminum tin (g);
 is the mass of the dry soil plus the
aluminum tin (g);
 is the mass of the empty aluminum tin
(g).
The NO2‒-N
concentration was determined using the diazotization-coupling colorimetric
method. Under acidic conditions, the nitrite in the extract reacts with
sulfanilamide to undergo a diazotization reaction, and subsequently couples
with N-(1-naphthyl) ethylenediamine dihydrochloride to form a magenta azo dye.
The instrument calculates the NO2‒-N concentration in the extract based
on the measured absorbance and a standard curve.
For NO3‒-N
determination, the nitrate in the extract is first reduced to nitrite via a
cadmium reduction module. The resulting nitrite is then measured following the
aforementioned colorimetric procedure, and the final NO3‒-N concentration is
obtained by subtracting the original background NO2‒-N content of the sample.
The soil NO3‒-N and NO2‒-N contents were
calculated using the following Equation:
 (2)
where  is the soil NO3‒-N
or NO2‒-N
content (mg/kg);
 represents the concentration of the extract determined by
the automated discrete chemistry analyzer (SmartChem200) (mg/L);
 is the volume of the extract (L);
 is the dilution factor; and
 is the mass of
the oven-dried soil (kg).
The mass of the
oven-dried soil was calculated from the fresh soil mass based on the
gravimetric soil water content:
 (3)
where is the mass of the fresh soil (kg),andis the gravimetric soil water content (%).
Origin 2025 was
used to construct graphs of these three indicators within the 0–400 cm soil
profile.
4 Data Results
4.1 Dataset Composition
The
dataset comprises a spatial shapefile (.shp) delineating the precise
geographical coordinates of the experimental
plots, coupled with a comprehensive tabular dataset (.xlsx) containing 4
distinct spreadsheets. One spreadsheet catalogs the baseline physical
properties of the soil profile, specifically texture and bulk density. The
remaining spreadsheets house the high-resolution empirical measurements
for soil water content (SWC), nitrate nitrogen (NO3‒-N) and nitrite nitrogen (NO2‒-N). The temporal scope encompasses 5 strategic sampling campaigns
conducted between June 2023 and September 2024. To ensure statistical
robustness, all temporal data report individual measurements from biological
triplicates, accompanied by their calculated means and standard deviations.
4.2 Data Results Analysis
Table
2 summarizes the mean values of soil water content, NO3‒-N and NO2‒-N
in the soil profile under different treatments across
various sampling periods. Furthermore, Figure 2 illustrates the dynamic changes
of these parameters at different depths throughout the monitoring period.
Temporally, SWC
exhibited pronounced seasonal variability. Moisture levels reached a minimum in
early summer (June 2023, 21.2%) and peaked significantly during the autumn
months (September and November 2023, 27.9% and 27.7%, respectively). The SWC in
March and September 2024 was recorded at 26.5% and 25.8%, respectively. This
seasonal pattern directly reflects the integrated effects of concentrated
monsoonal precipitation, periodic agricultural irrigation, and shifting crop
water consumption during the growing seasons[20,21]. Vertically, a
distinct moisture gradient emerged between the shallow and deep horizons. The
mean SWC in the 0–10, 10–25, and 25–50 cm layers was 24.3%, 24.7%, and 24.6%, respectively, whereas the
deep vadose zone (200–300 cm) was identified as a relative water-enriched stratum,
averaging 29.7%. Across the management regimes, mean SWC followed the hierarchy
of BRN (27.08%)>RF (26.91%)>CF (25.75%). The elevated moisture profile
under the BRN treatment confirms that biochar co-application exerts a positive,
functional effect on soil hydrological retention, thereby improving the soil
water-holding capacity[22].
Soil NO3‒-N
concentrations exhibited extreme spatiotemporal heterogeneity, ranging from
3.17 to 354.23 mg/kg, with an overall mean of 17.60 mg/kg.
Temporally, a critical accumulation phase occurred during the autumn and winter
seasons, with mean NO3‒-N
concentrations surging to a distinct peak of 33.30 mg/kg in November 2023.
Vertically, NO3‒-N
was overwhelmingly localized within the shallow upper root zones. The 10–50 cm depth interval functioned as the
primary accumulation sink, recording mean concentrations of 37.58 mg/kg (10–25
cm) and 45.44 mg/kg (25–50 cm) before attenuating significantly with increasing
profile depth. Crucially, the alternative management practices successfully
mitigated nitrate accumulation; the mean NO3‒-N profile content followed the order of CF
(18.97 mg/kg)> RF (17.52 mg/kg)> BRN (15.97 mg/kg). This confirms that
both reduced nitrogen inputs and biochar amendments are highly effective
strategies for depressing the overall nitrate burden in the vadose zone.
Although bulk NO2‒-N concentrations were orders of magnitude
lower than nitrate, their vertical distribution and temporal evolution were
remarkably synchronous with NO3‒-N.
Elevated NO2‒-N
activities were strictly confined to the 10–50 cm layer and peaked concurrently in November 2023. This distinct
synchronization highlights an intensified phase of active nitrogen accumulation
and microbial transformation within the shallow soil profile during the
post-harvest period. Among the treatments, conventional fertilization (CF)
consistently yielded the highest NO2‒-N
contents, whereas levels were comparatively suppressed under both the RF and
BRN regimes.
Table
2 Statistical summary of soil
profile parameters under different fertilization treatments across various
sampling periods
|
Sampling
period
|
Fertilization
treatment
|
Mean
|
|
SWC
(%)
|
NO3‒-N (mg/kg)
|
NO2‒-N (mg/kg)
|
|
June 2023
|
CF
|
21.2
|
16.40
|
0.61
|
|
September 2023
|
CF
RF
BRN
|
29.9
26.7
27.0
|
12.73
14.70
13.85
|
0.33
0.29
0.22
|
|
November 2023
|
CF
RF
BRN
|
26.6
27.9
28.7
|
38.35
32.51
29.03
|
0.60
0.69
0.43
|
|
March 2024
|
CF
RF
BRN
|
26.6
26.9
27.0
|
13.11
10.64
10.40
|
0.40
0.18
0.23
|
|
September 2024
|
CF
RF
BRN
|
25.5
26.2
25.7
|
14.27
12.22
10.60
|
0.36
0.22
0.20
|
Crucially, NO3‒-N and NO2‒-N exhibited a highly significant positive
correlation, demonstrating robust spatiotemporal synchrony across the soil
profile. This geochemical coupling was exceptionally pronounced during the
November 2023 accumulation peak within the 10–50 cm stratum, capturing an intensified phase of active nitrogen
biotransformation in the shallow subsurface. In stark contrast, bulk soil water
content was largely decoupled from the distribution of both inorganic nitrogen
forms, indicating that physical moisture gradients are not the dominant drivers
of nitrogen migration[23]. The pronounced spatiotemporal
heterogeneity of the vadose nitrogen pool is co-regulated by a complex, coupled
interplay of anthropogenic and biogeochemical factors—namely, fertilization
phenology, crop assimilation, intrinsic soil texture, localized microbial
cycling[15,24], and the episodic redistribution of nutrients
triggered by routine precipitation and agricultural irrigation[25].
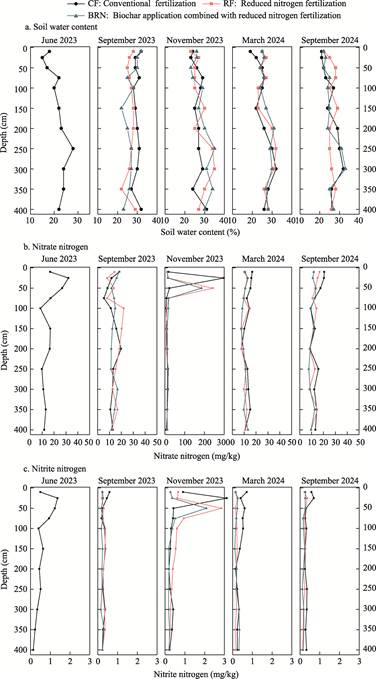
Figure
2 Dynamic changes of soil water
content, NO3‒-N and NO2‒-N in the soil profile
under different fertilization treatmentsf
5 Discussion and Conclusion
Based
on a long-term field monitoring experiment under 3 fertilization management
practices conducted from June 2023 to September 2024, this study systematically
analyzed the dynamic changes of nitrogen in the soil profile of agricultural
areas with high nitrogen accumulation in western Baiyangdian. Soil texture,
water content, and nitrate and nitrite nitrogen contents were measured. This
dataset can provide data support for identifying nitrogen leaching risks in
farmland in western Baiyangdian, optimizing nitrogen-reduction fertilization,
and constructing water and nitrogen transport models for the vadose zone.
Based on the systematic analysis of the empirical dataset, the findings
reveal that soil nitrogen within the high-accumulation farmlands west of
Baiyangdian Wetland is overwhelmingly dominated by NO3‒-N. Across the 0–400 cm profile, nitrate is
predominantly concentrated in the upper 100 cm layer, posing a pronounced risk
of deep vertical leaching under CF practices. Among the
varied management regimes, the intensity of nitrogen accumulation followed a
clear hierarchy: CF>RF>BRN. This effectively demonstrates that both
reduced exogenous nitrogen input and biochar co-application serve as viable
functional interventions to mitigate inorganic nitrogen accumulation and
alleviate potential leaching risks. Moving forward, subsequent research should
integrate multidimensional variables—including precipitation, irrigation
regimes, fertilization rates, crop nitrogen uptake, and groundwater depth—to
further quantitatively evaluate the impacts of diverse agricultural practices
on nitrogen leaching and associated aquatic environmental risks.
Author Contributions
Wang,
S. Q. conducted the overall design of the dataset. Liu, B. X. established the
field experiment. Lv, Q. conducted the sample collection and laboratory
experiments, processed the data, compiled the dataset, and wrote the data
paper. Tan, K. D. and Zheng, W. B. supervised and assisted in sample
collection.
Conflicts of Interest
The authors declare no
conflicts of interest.
References
[1]
Pang, Y. Y., Fan, X. D., Hu, X.
T., et al. Soil nitrogen leaching and utilization in winter wheat fields
under deep water storage irrigation [J]. Chinese Journal of Soil Science,
2025, 56(2): 465–474.
[2]
Singh, B., Craswell, E.
Fertilizers and nitrate pollution of surface and ground water: an increasingly
pervasive global problem [J]. SN Applied Sciences, 2021, 3(4): 518.
[3]
Murphy, N. P., Waterhouse, H.,
Dahlke, H. E. Influence of agricultural managed aquifer recharge on nitrate
transport: the role of soil texture and flooding frequency [J]. Vadose Zone
Journal, 2021, 20(5): e20150.
[4]
Liu, L. C., Zheng, T. Y., Qiu,
Y. Y., et al. Competitive roles of DNRA and denitrification on organic nitrogen
dynamics in partially saturated soil-water systems [J]. Water Resources
Research, 2025, 61(4): e2024WR038705.
[5]
Szczebak, L. D., Willems, J.
A., Müller, C., et al. Nitrite isotope characteristics and associated
soil N transformations [J]. Scientific Reports, 2021, 11(1): 5008.
[6]
Tan, K. D., Wang, S. Q., Zheng,
W. B., et al. Geomorphologic and sedimentary features dominate the
nitrogen accumulation and leaching in the deep vadose zone from a catchment
viewpoint [J]. Journal of Hydrology, 2025, 652: 132682.
[7]
Li, C., Tan, K. D., Zheng, W.
B., et al. Migration, transformation processes, and dominated factors of
nitrate nitrogen in the deep vadose zone in the Baiyangdian Watershe [J]. Chinese
Journal of Eco-Agriculture, 2025, 33(2): 314–323.
[8]
Li, X., Liu, M. Y., Min, L. L.,
et al. Nitrogen transport and transformation processes in the typical
deep vadose zone in the central North China Plain [J]. Chinese Journal of
Eco-Agriculture, 2025, 33(12): 2359–2370.
[9]
Zhou, X. N., Du, C. H., Li, H.
R., et al. Optimization of inter-seasonal nitrogen allocation increases
yield and resource-use efficiency in a water-limited wheat-maize cropping
system in the North China Plain [J]. The Crop Journal, 2024, 12(3):
907–914.
[10] Wang, L., Leghari, S. J., Wu, J. J., et al. Interactive
effects of biochar and chemical fertilizer on water and nitrogen dynamics, soil
properties and maize yield under different irrigation methods [J]. Frontiers
in Plant Science, 2023, Volume 14–2023.
[11] Zhang, C. Q., Zhang, C. H. The interactive effect of organic matter
addition and inhibitor application on soil nitrogen availability and crop yield
[J]. Chinese Journal of Soil Science, 2025, 56(6): 1717–1725.
[12] Zhang, Q., Niu, W. Q., Du, Y. D., et al. Sustainable effects
of nitrogen reduction combined with biochar on enhancing maize productivity and
nitrogen utilization [J]. European Journal of Agronomy, 2025, 162:
127429.
[13] Tian, X. Q., Li, Z., Wang, Y. F., et al. Evaluation on soil
fertility quality under biochar combined with nitrogen reduction [J]. Scientific
Reports, 2021, 11(1): 13792.
[14] Yang, Z. W., Yin, G. F., Zhao, H. X., et al. Spatiotemporal
variations in planting structure and nitrogen surplus in the Baiyangdian basin
[J]. Transactions of the Chinese Society of Agricultural Engineerin,
2023, 39(6): 111–119.
[15] Feng, W. Z., Wang, S. Q., Tan, K. D., et al. Simulation of
spatial and temporal variation of nitrate leaching in the vadose zone of
alluvial regions on a large regional scale [J]. Science of The Total
Environment, 2024, 916: 170114.
[16] Lv, Q., Wang, S. Q., Tan, K. D., et al. In situ soil nitrogen
dataset from west of the Baiyangdian Lake for high-nitrogen accumulation farmland
research [J/DB/OL]. Digital Journal of Global Change Data Repository,
2026. https://doi.org/10.3974/geodb.2026.04.07.V1.
[17] GCdataPR Editorial Ofice. GCdataPR data
sharing policy [OL]. https://doi.org/10.3974/dp.policy.2014.05 (Updated 2017).
[18] Liao, Y. M., Huang, D. P. Climate characteristics and change trend
of Xiong’an New Area [J]. Chinese Agricultural Science Bulletin, 2020,
36(23): 99–105.
[19] SAMR, SAC. Soil quality—determination of nitrate, nitrite and
ammonium in soils—extraction with potassium chloride solution and determination
using automated method with segmented flow analysis (GB/T 42487—2023) [S].
Beijing: Standards Press of China, 2023.
[20] Miao, Z., Qu, Z. Y., Bai, Y. Y., et al. Temporal and spatial
dynamics evolution of surface soil moisture content in agricultural fields
during crop growth period based on TVDI [J]. Transactions of the Chinese
Society for Agricultural Machinery, 2025, 56(8): 567–577.
[21] Zhao, L., Han, C. Y., Li, Y. N., et al. Coordinated
regulation of water use-efficiency-cost in a winter wheat-summer maize rotation
system and optimization of water allocation strategies [J]. Agricultural
Water Management, 2025, 318: 109718.
[22] Zhou, M. R., Ying, S. S., Chen, J. H., et al. Effects of
biochar-based fertilizer on nitrogen use efficiency and nitrogen losses via
leaching and ammonia volatilization from an open vegetable field [J]. Environmental
Science and Pollution Research, 2021, 28(46): 65188–65199.
[23] Li, Y., Ju, X. T., Wu, D. Transient nitrite accumulation explains
the variation of N2O emissions to N fertilization in upland agricultural soils
[J]. Soil Biology and Biochemistry, 2023, 177: 108917.
[24] Su, F. M., Wu, J. H., Wang, D., et al. Moisture movement,
soil salt migration, and nitrogen transformation under different irrigation
conditions: field experimental research [J]. Chemosphere, 2022, 300:
134569.
[25] Pu, X., Wang, T. T., Cai, K., et al. Characterization and
source apportionment of rainfall-driven nitrate export from dryland crop
systems with agricultural practices at mid-high latitudes [J]. Agriculture,
Ecosystems & Environment, 2024, 375: 109218.