Soil
Erosion Assessment Dataset Development of the Qinghai-Xizang Plateau Based on
the Ensemble RUSLE Model (1981–2018)
Huang, Y. Z.1,4
Xin, Z. B.2 Gao, G. Y.1,4 Ma, Y3,4 Yang, L. H.3,4 Song, X. F.3,4*
1. State
Key Laboratory of Regional and Urban Ecology, Research Center for
Eco-Environmental Science, Chinese Academy of Sciences, Beijing 100085, China;
2. School of Soil and Water Conservation, Beijing
Forestry University, Beijing 100083, China;
3. Key
Laboratory of Water Cycle and Related Land Surface Processes, Institute of Geographic
Science and Natural Resources Research, Chinese Academy of Sciences, Beijing
100101, China;
4. College of Resources and Environment, University
of Chinese Academy of Sciences, Beijing 101408, China
Abstract:
The Qinghai-Xizang Plateau is characterized by ecological fragility and high
sensitivity to climate change, with soil erosion posing a major threat to the
ecological security of the Pan-Third Pole region. To reduce discrepancies in
current assessments of soil erosion on the Qinghai-Xizang Plateau and to
provide a more reliable representation of the spatial distribution and temporal
dynamics in soil erosion, the authors applied an ensemble RUSLE model. This
model integrates multiple datasets, including the China Meteorological Forcing
Dataset (CMFD), Climate Hazards group Infrared Precipitation with Stations
(CHIRPS) and ERA-Interim, SoilGrids soil data, and a 90-m DEM, combined with
diverse erosion factor schemes (9 R factors × 3 K factors × 3 LS
factors×3 C factors). The model was used to evaluate soil erosion on the
Qinghai-Xizang Plateau from 1981 to 2018. The "RUSLE-IC-SDR" method
was compared with measured sediment yield data to develop a soil erosion
dataset for the Qinghai-Xizang Plateau. The dataset includes: (1) multi-year
average water erosion data for the periods 1981–2018, 1981–1998, and 1999–2018,
corresponding to the median values from the ensemble model; and (2) rates of
change in water erosion for 1981–2018, 1981–1998, and 1999–2018. The spatial
resolution of the data is 100 m. The dataset is archived in .tif format and
consists of 26 data files, with a total size of 12.3 GB (compressed into 6
files, 5.38 GB).
Keywords: soil erosion; Qinghai-Xizang Plateau; ensemble
RUSLE model; change; soil erosion by water
DOI: https://doi.org/10.3974/geodp.2025.04.01
Dataset Availability Statement:
The dataset supporting this paper was published and is
accessible through the Digital Journal of Global Change Data Repository
at: https://doi.org/10.3974/geodb.2025.06.05.V1.
1 Introduction
The Qinghai-Xizang Plateau is characterized
by active tectonic deformation, complex topography, diverse surface material
properties, and high sensitivity to climate change[1–3].
These unique natural conditions coupled with intensified climate change, have
exacerbated soil erosion across the region[3–7].
As a result, vast areas of fragile surface cover have developed, posing serious
challenges to ecological restoration and environmental management. Severe soil
erosion also threatens pastoral management, transportation infrastructure, and
the safety of residents’ lives and property on the Qinghai-Xizang Plateau.
Studies using the RUSLE model to assess soil erosion on the plateau have
attracted broad attention. However, discrepancies in data sources and the
parameterization of erosion factors have produced large variations in reported
erosion magnitudes, spatial patterns, and temporal dynamics[6,8–11].
Such inconsistencies hinder the establishment of a unified and reliable
understanding of regional erosion processes, limiting the design of effective
soil and water conservation practices and constraining ecological management
strategies. Therefore, a refined, robust, and reliable assessment of water
erosion on the Qinghai-Xizang Plateau is urgently needed.
The RUSLE model is widely applied because it
integrates diverse measured data, including geographic and climatic parameters,
and directly utilizes remote sensing data, making it the most widely used soil
erosion model to date[12–14]. On
the Qinghai-Xizang Plateau, however, most RUSLE-based studies have relied on a single
data source and algorithmic implementations for estimating erosion factors,
leading to uncertainties and limitations. To overcome this shortcoming, this
study developed an ensemble modeling framework that integrated multi-source
data and multiple algorithmic schemes, yielding 243 soil erosion assessment
scenarios (9 R-factor × 3 K-factor × 3 LS-factor × 3 C-factor
implementations). By exploiting the complementary strengths of different data
sources and algorithmic, this framework significantly enhances the robustness
and reliability of soil erosion estimates while minimizing biases associated
with single-source data or methodologies. This integrated strategy allows for
more precise identification of spatial distribution and temporal dynamics of
water erosion across the Qinghai-Xizang Plateau, producing a soil erosion
dataset spanning 1981–2018. The dataset provides a more reliable scientific
basis for detecting regional erosion hotspots, supporting policy formulation,
and informing future scenario projections[15].
2 Metadata of the Dataset
The metadata of the Soil erosion assessment
dataset of the Qinghai-Xizang Plateau based on the RUSLE model analysis (1981–2018)[16] is summarized in Table 1. It
includes the dataset full name, short name, authors, year of the dataset,
spatial resolution, data format, data size, data files, data publisher, and
data sharing policy, etc.
3 Methods
3.1 Data Sources and Processing
According to the input factors of the RUSLE model, the study utilized
precipitation, soil, digital elevation model (DEM), and vegetation datasets.
Precipitation data used were obtained from 3 sources: the China Meteorological
Forcing Dataset (CMFD), the Climate Hazards group Infrared Precipitation with
Stations dataset (CHIRPS), and the ERA-Interim dataset[18–20],
all at a daily temporal resolution. Soil data were obtained from the SoilGrids
Table 1 Metadata summary of Soil erosion assessment dataset
of the Qinghai-Xizang Plateau based on the RUSLE model analysis (1981–2018)
|
Items
|
Description
|
|
Dataset full name
|
Soil erosion assessment dataset of the Qinghai-Xizang
Plateau based on the RUSLE model analysis (1981–2018)
|
|
Dataset short name
|
SoilerosionERUSLE_1981–2018
|
|
Authors
|
Huang, Y. Z., Research Center for Eco-Environmental
Science, CAS, yzhuang_st@rcees.ac.cn
Xin, Z. B., Beijing Forestry University,
xinzhongbao@126.com
Gao, G. Y., Research Center for Eco-Environmental
Science, CAS, gygao@rcees.ac.cn
Ma, Y., Institute of Geographic Science and Natural
Resources Research, CAS, maying@igsnrr.ac.cn
Yang, L. H., Institute of Geographic Science and
Natural Resources Research, CAS, yanglihu@igsnrr.ac.cn
Song, X. F., Institute of Geographic Science and
Natural Resources Research, CAS, songxf@igsnrr.ac.cn
|
|
Geographical region
|
Qinghai-Xizang Plateau
|
|
Year
|
1981–2018
|
|
Spatial resolution
|
100 m
|
|
Data format
|
.tif
|
|
|
|
Data size
|
5.38 GB (after compression)
|
|
|
|
Data files
|
The multi-year average hydraulic erosion data corresponding
to the median of the integrated model 1981–2018, 1981–1998, and 1999–2018;
The rate of change of hydraulic erosion 1981–2018, 1981–1998, and 1999–2018
|
|
Foundation
|
Ministry of Science and Technology of P.
R. China (2019QZKK0403)
|
|
Data publisher
|
Global Change
Research Data Publishing & Repository, http://www.geodoi.ac.cn
|
|
Address
|
No. 11A, Datun Road, Chaoyang District,
Beijing 100101, China
|
|
Data sharing policy
|
(1) Data
are openly available and can be free downloaded via the Internet; (2) End
users are encouraged to use Data
subject to citation; (3) Users, who are by definition also value-added
service providers, are welcome to redistribute Data subject to written permission from the GCdataPR Editorial
Office and the issuance of a Data
redistribution license; and (4) If Data
are used to compile new datasets, the “ten
percent principal” should be followed such that Data records utilized should not
surpass 10% of the new dataset contents, while sources should be clearly
noted in suitable places in the new dataset[17]
|
|
Communication and
searchable system
|
DOI, CSTR, Crossref, DCI, CSCD, CNKI, SciEngine, WDS, GEOSS, PubScholar, CKRSC
|
dataset[21], which provides soil organic carbon,
USDA-based soil texture, soil sand, clay, silt content, and WRB classification.
The 90-m spatial resolution DEM data were sourced from the NASA Shuttle Radar
Topography Mission (SRTM-90 m)[22].
Normalized Difference Vegetation Index (NDVI) data were derived from 2 sources:
GIMMS-NDVI-3g and MOD13Q1.V6[23,24]. To extend the temporal
availability of vegetation data and ensure comparability, spatiotemporal
stability analysis and statistical downscaling techniques were applied to
correct the 2 NDVI datasets based on their overlapping period (February 2000 to
December 2015)[25]. Vegetation
type data were downloaded from the “1:1,000,000 Spatial distribution
data of vegetation types in China” available on the Resource
and Environmental Science Data Platform, originally sourced from the “Vegetation
atlas of China”[26]. All data
were resampled to a spatial resolution of 100 m.
3.2 Technical Workflow
The study applied the widely used RUSLE model
for large-scale soil erosion assessment. An ensemble modeling framework was
developed by integrating multi-source data and multiple calculation methods for
erosion factors, resulting in 243 assessment scenarios. These scenarios
encompassed all possible combinations of 9 rainfall erosivity (R) factor
schemes, 3 soil erodibility (K) factor schemes, 3 slope length and
steepness (LS) factor schemes, and 3 cover-management (C) factor
schemes. The close relationship between sediment connectivity (IC) and sediment
delivery ratio (SDR) was further utilized to output the erosion assessment.
This approach enabled the determination of soil erosion conditions on the
Qinghai-Xizang Plateau based on the ensemble model. The median value from the
assessment results were used to analyze the spatial patterns and temporal
dynamics of soil erosion over the past 40 years (1981–2018) on the plateau
(Figure 1).
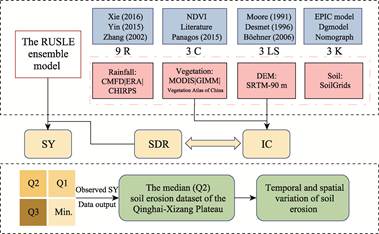
Figure 1 Flowchart of the
dataset development
3.3 Realization of the RUSLE Ensemble Model
The RUSLE was established by Wischmeier and
Smith based on 30 years of runoff plot data and artificial rainfall experiments
from 30 states in the United States[27]:
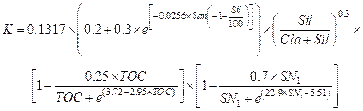
 (1)
(1)
where A is the potential water soil
erosion rate (t ha–1 yr–1),
R is the rainfall erosivity factor (MJ mm ha–1 h–1
yr–1), K is the soil erodibility factor (Mg ha h MJ–1 ha–1
mm–1), LS is the slope length and steepness factor
(dimensionless), C is the cover-management factor (dimensionless), and P
is the support practice factor (dimensionless). Due to the harsh living
environment on the Qinghai-Xizang Plateau, there are relatively few human land
development and management measures[28].
Therefore, in this study, the P factor is ignored (that is, P is
set to 1).
3.3.1 R Factor
The calculation of the R factor was
based on 3 daily rainfall datasets: CMFD, CHIRPS, and ERA-Interim. To derive
the R factor, the methods of Zhang, et al. (Equation 2–4), Xie, et
al. (Equation 5), and Yin, et al. (Equation 6) were applied[29–31].
 (2)
(2)
 (3)
(3)
 (4)
(4)
where Rj (MJ mm ha–1
h–1 yr–1) is the
rainfall erosivity of the j half-month; k is the number of days
in the j half-month; Pd (mm) is the daily effective
rainfall (≥12 mm); Pd12 (mm) is the average daily rainfall (≥12
mm); Py12 (mm) is the yearly average rainfall for days with
rainfall ≥12 mm.
 (5)
(5)
where Rday
(MJ mm ha–1 h–1 yr–1) is daily rainfall
erosivity; j presents the jth month; Pd
(mm) is the daily effective rainfall (≥9.7 mm)[31].
 (6)
(6)
where Rmonth
(MJ mm ha–1 h–1 yr–1) is monthly rainfall
erosivity; Pmonth (mm) is the sum of daily effective rainfall
(≥ 9.7 mm) in this month. (Pday)month (mm)
is the maximum daily rainfall for the month.
3.3.2 K Factor
The K factors in this
study were implemented by the common algorithms: EPIC (Equation 7), Dg (Equation
8–10), and Nomograph (Equation 11–12)[27,32,33].
According to the availability of SoilGrids, the data of soil layer 0–15 cm are
used to calculate the K factor[10].
 (7)
(7)
where K (Mg ha h MJ–1
ha–1 mm–1) is the soil erodibility; San (%)
is the sand content (0.05–2 mm); Sil (%) is the silt content (0.002–0.05
mm); Cla (%) is the clay content (<0.002 mm); TOC (%) is the
soil total organic carbon content; and SN1=1–San/100.
After multiplying by 0.131,7, the K value is expressed in an SI metric (Mg
ha h MJ–1 ha–1 mm–1). For soil samples with
organic matter content (TOC=SOM×0.58) above 4%, the upper limit
of 4% has been applied, to prohibit an underestimation of soil erodibility for
soils that are rich in organic matter[27,34].
 (8)
(8)
 (9)
(9)
 (10)
(10)
where Dg is the
Naperian logarithm of the geometric mean of the particle size distribution, di
(mm) is the maximum diameter of the i-th class, di–1
(mm) is the minimum diameter; fi is the mass fraction in the
corresponding particle size class (For example, if the lower limit of clay was
set as 0.000,05 mm, the Dg of soil containing 15% clay, 40% silt and 45%
sand was equal to –3.569).
 (11)
(11)
 (12)
(12)
where M is a factor
related to soil texture. N1 (%) is the silt and very fine
sand content (0.002–0.1 mm), which is commonly approximated as 20% of the sand content[34]; N2 (%)
is the clay content (<0.002 mm). The soil structure parameter (s) is
determined according to the WRB soil classification. Soil permeability (p)
is obtained from the USDA soil texture classification.
3.3.3 LS Factor
3 algorithms, Böhner,
Desmet, and Moore, in the System for Automated Geoscientific Analysis (SAGA)
software were used to calculate the LS factor in this study[15,35–37].
Firstly, DEM should be filled with sinks in ArcGIS using the Fill tool. Then
Flow Accumulation tool was used to calculate Total Catchment Area (TCA) in
SAGA, and Flow Width and Specific Catchment Area tool were used to calculate
Specific Catchment Area (SCA). Finally, SAGA’s LS factor was used to calculate
the LS factor.
3.3.4 C Factor
C factor is
considered the most important factor for policy and land-use decisions because
it is the factor most directly influenced by human activities to reduce erosion[38]. In this study, 3 C
factor schemes were realized through satellite remote sensing data (e.g., NDVI)
(Equation 13), literature values (Table 2), and the combination of the two
methods (Equation 14).
 (13)
(13)
where C is the cover-management
factor, α=–2, and β=1.
The C-factor for each land-cover type
was calculated as the weighted average of soil erosion ratio, with values
ranging from 0 to 1. However, the same land-cover class may exhibit different C
factors due to variations in vegetation density (Table 2). In this study,
following previous studies and summaries, the median of empirical values was
used to represent the C factor of a certain vegetation class[15].
Table 2 Vegetation
types and their corresponding literature values of C factor
|
No.
|
Class
|
Vegetation types
|
Ranges of C
|
C
|
|
1
|
Cultivated
|
Croplands
|
0.15–0.2
|
0.175
|
|
2
|
Forestlands
|
Needleleaf
forest
|
0.000,1–0.003
|
0.001,55
|
|
3
|
|
Mixed forest
|
0.000,1–0.003
|
0.001,55
|
|
4
|
|
Broadleaf forest
|
0.000,1–0.003
|
0.001,55
|
|
5
|
Shrublands
|
Shrub forestland
|
0.01–0.15
|
0.08
|
|
6
|
|
Sparse shrub
|
0.1–0.45
|
0.275
|
|
7
|
Grasslands
|
Steppe
|
0.05–0.15
|
0.1
|
|
8
|
|
Tussock
|
0.05–0.1
|
0.075
|
|
9
|
|
Meadow
|
0.01–0.08
|
0.045
|
|
10
|
|
Alpine
vegetation
|
0.01–0.15
|
0.08
|
|
11
|
Others
|
Water
|
0
|
0
|
|
12
|
|
Glacier
|
0
|
0
|
|
13
|
|
Bare soil
|
0.1–0.55
|
0.325
|
|
14
|
|
Marsh
|
0
|
0
|
The third calculation method of the C
factor adopts the method of Panagos, et al.[30],
and combines the assignment method and land coverage for calculation.
 (14)
(14)
where min(Clanduse)
is the minimum value in literature values for this vegetation type; Range(Clanduse) represents the range for
vegetation type of literature values; Fcover is vegetation
coverage. The assignments C factor of various vegetation types was
obtained according to Panagos and Majhi[38,39],
and combined with the C values of relevant studies on the Qinghai-Xizang
Plateau (Table 2).
3.4 Data Analysis
3.4.1 Change-Point Analysis
The study utilized the “cpm”
package in R, applying the Kolmogorov-Smirnov test to identify change points in
the soil erosion time series. The termination year with a rapid increase in the
cumulative number of change points was designated as the change point, dividing
year between the earlier and later periods. Notably, this statistical change
coincides with the launch of China’s
large-scale ecological restoration initiatives in 1999—the Grain-for-Green
Program and the Returning Grazing Land to Grassland Program—which further
supports the validity of the identified change point[40].
3.4.2
Soil
Erosion Trend
A pixel-based linear least
squares regression was employed to calculate the trend of annual soil erosion changes[40]. The Equation is as follows:
 (15)
(15)
where Slope represents
the rate of change in the variable x over the time series; xi
denotes the value of variable x in the i-th year; i is an
integer ranging from 1 to n (number of years).
3.5 Data Output
The “RUSLE-IC-SDR”
method was employed to calculate sediment yields corresponding to the minimum,
first quartile (Q1), second quartile (Q2/median), and third quartile (Q3)
erosion results from the ensemble model. The computed sediment yields were
compared with observed sediment yield data collected from 24 hydrological
monitoring stations, including 13 from water resources departments and 11 from
literature records, to determine the optimal output. Results demonstrated that
the Q2 output of the ensemble model showed closer
agreement with observed measurements from hydrological stations (R2=0.81,
RMSE = 7.04, NSE=0.81) (Figure 2). Therefore, the median values from the
ensemble model were selected as the final dataset output.
4 Data Results
4.1 Dataset Composition
The Soil erosion assessment dataset of the
Qinghai-Xizang Plateau based on the RUSLE model analysis (1981–2018) provides:
(1) The multi-year average water erosion data (unit: t ha–1 yr–1)
corresponding to the median of the integrated model from 1981 to 2018, from
1981 to 1998, and from 1999 to 2018; (2) The rate of change of water erosion
(unit: t ha–1 yr–1 yr–1) from 1981 to 2018,
from 1981 to 1998 and from 1999 to 2018. The spatial resolution of the data
is 100 m. The dataset is archived in .tif format.
4.2 Spatial Distribution and Changes in Erosion
The multi-year average soil erosion rate on the Qinghai-Xizang Plateau
from 1981 to 2018 was 5.91±2.29 t ha–1 yr–1,
corresponding to an annual soil loss of 1,526±591 Tg caused by water erosion.
Higher erosion rates were observed in the middle and upper reaches of
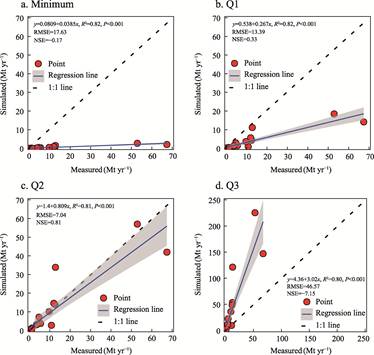
Figure 2 Performance of the
ensemble model in simulating mean annual sediment yield
Yarlung Tsangpo River in Shigatse, the lower
reaches of Yarlung Tsangpo River in Nyingchi, the Western Sichuan region, the
eastern Qinghai-Xizang Plateau, and the Pamir Plateau (Figure 3). In contrast,
the soil erosion rates in the Qaidam Basin and Changtang Plateau were the
lowest.
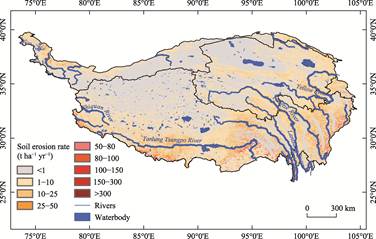
Figure 3 Distribution map of the
average soil erosion rate in Qinghai-Xizang Plateau (1981–2018)
Based on change-point analysis and the
timeline of the “Grain-for-Green Program”, the year 1999 was identified as a
turning point in soil erosion dynamics (Figure 4), dividing the study period
into an earlier phase (1981–1998) and a later phase (1999–2018).
The Qinghai-Xizang Plateau showed an increasing trend in soil erosion (Figures
4a and 5a), with erosion rates significantly higher in the later phase than in
the earlier one (P=9.5e–5). However, the sharp acceleration observed
before 1999 was substantially reduced afterward (earlier trend: 0.075 t ha–1
yr–1 yr–1; later trend: 0.013 t ha–1 yr–1
yr–1) (Figure 4a). During the earlier period, increased soil erosion
trends were primarily observed in the middle reaches of the Yarlung Tsangpo
River and southeastern Qinghai-Xizang Plateau (Figure 5b). In contrast, these
regions experienced declining erosion rates in the later period (Figure 5c).
intensified soil erosion became concentrated mainly in the western and eastern
Plateau during the later phase. Notably, the area showing mitigated soil
erosion expanded by 65.6% across the entire Qinghai-Xizang Plateau during this
later period (Figure 5c).
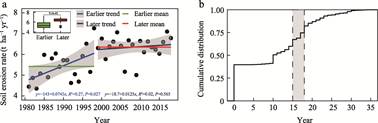
Figure 4 Annual trends of
soil erosion on the Qinghai-Xizang Plateau
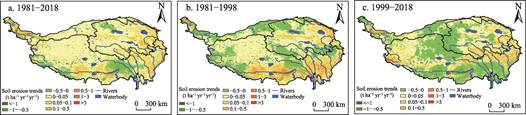
Figure 5 Distribution maps of
soil erosion changes and SOC erosion changes in
Qinghai-Xizang Plateau
5 Discussion and Conclusion
The Qinghai-Xizang Plateau serves as a
critical ecological security barrier for China, characterized by extremely
fragile ecosystems and shallow soil formation. Unsustainable human activities
and climate change have intensified water erosion across the plateau.
Understanding these processes is essential for environmental protection,
biodiversity conservation, and sustainable resource management. This study
employed an ensemble RUSLE model, integrating multi-source data and multiple
erosion factor calculation methods, to develop a more reliable soil erosion
dataset. The results identified erosion hotspot, with the highest rates
concentrated in the Yarlung Tsangpo River basin and eastern Qinghai-Xizang
Plateau. Analysis of erosion dynamics from 1981 to 2018 further indicated that
future soil erosion intensification requires particular attention in western
and eastern parts of the plateau. The water erosion dataset developed provides
scientific support and guidance for targeted soil and water conservation initiatives.
Author
Contributions
Song, X. F., Gao, G. Y., Xin, Z. B., and Huang, Y. Z.
contributed to the overall design of the dataset development; Huang, Y. Z. and
Ma, Y. designed the models and algorithms; Song, X. F. and Yang, L. H. provided
optimization suggestions for the paper and data; Huang, Y. Z. wrote the paper.
Conflicts of Interest
The authors
declare no conflicts of interest.
References
[1]
Zhang, Y. L., Li, B. Y., Zheng, D.
Datasets of the boundary and area of the Tibetan Plateau [J/DB/OL]. Digital
Journal of Global Change Data Repository, 2014.
https://doi.org/10.3974/geodb.2014.01.12.V1.
[2]
Yao, T. D., Chen, F. H., Cui, P., et
al. From Tibetan Plateau to Third Pole and Pan-Third Pole [J]. Bulletin
of Chinese Academy of Sciences, 2017, 32(9): 924–931.
[3]
Cui, P., Jia, Y., Su, F. H., et
al. Natural hazards in Tibetan Plateau and key issue for feature research [J].
Bulletin of Chinese Academy of Sciences, 2017, 32(9): 985–992.
[4]
Luo, L. F., Zhang, K. L., Kong,
Y. P., et al. Temporal and spatial distribution of soil loss on
Tibet-Qing Plateau [J]. Journal of Soil and Water Conservation, 2004,
18(1): 58–62.
[5]
Yang, Y. Y., Zhao, R. Y., Shi,
Z., et al. Integrating multi-source data to improve water erosion
mapping in Tibet, China [J]. Catena, 2018, 169: 31–45.
[6]
Teng, H. F., Liang, Z. Z.,
Chen, S. C., et al. Current and future assessments of soil erosion by
water on the Tibetan Plateau based on RUSLE and CMIP5 climate models [J]. Science
of the Total Environment, 2018, 635: 673–686.
[7]
Zhang, F., Hu, Y. D., Fan, X.
M., et al. Controls on seasonal erosion behavior and potential increase
in sediment evacuation in the warming Tibetan Plateau [J]. Catena, 2022,
209: 105797.
[8]
Sun, J., Liu, Y., Zhou, T. C., et
al. Soil conservation service on the Tibetan Plateau, 1984–2013 [J]. Earth
and Environmental Science Transactions of the Royal Society of Edinburgh,
2019, 109(3–4): 445–451.
[9]
Zhao, W. T., Cheng, Y. Z.,
Jian, J. S., et al. Water erosion changes on the Qinghai-Tibet Plateau
and its response to climate variability and human activities during 1982–2015 [J].
Catena, 2023, 229(26): 107207.
[10]
Tian, Q. L., Zhang, X. P., He,
J., et al. Potential risk of soil erosion on the Tibetan Plateau during
1990–2020: impact of climate change and human activities [J]. Ecological
Indicators, 2023, 154: 110669.
[11]
Kang, L. Q., Zhou, T. C., Gan,
Y. M., et al. Spatial and temporal patterns of soil erosion in the
Tibetan Plateau from 1984 to 2013 [J]. Chinese Journal of Applied and
Environmental Biology, 2018, 24(2): 245–253.
[12]
Karydas, C. G., Panagos, P.,
Gitas, I. Z. A classification of water erosion models according to their
geospatial characteristics [J]. International Journal of Digital Earth,
2014, 7(3): 229–250.
[13]
Batista, P. V. G., Davies, J.,
Silva, M. L. N., et al. On the evaluation of soil erosion models: are we
doing enough? [J] Earth-Science Reviews, 2019, 197: 102898.
[14]
Zhang, Y. T., Xiao, H. B., Nie,
X. D., et al. Evolution of research on soil erosion at home and abroad
in the past 30 years—based on bibliometric analysis [J]. Acta Pedologica
Sinica, 2020, 57(4): 797–810.
[15]
Schürz, C., Mehdi, B., Kiesel,
J., et al. A systematic assessment of uncertainties in large-scale soil
loss estimation from different representations of USLE input factors-a case
study for Kenya and Uganda [J]. Hydrology and Earth System Sciences,
2020, 24(9): 4463–4489.
[16]
Huang, Y. Z., Xin, Z. B., Gao,
G. Y., et al. Soil erosion assessment dataset of the Qinghai-Xizang
Plateau based on the RUSLE model analysis (1981–2018) [J/DB/OL]. Digital
Journal of Global Change Data Repository, 2025.
https://doi.org/10.3974/geodb.2025.06.05.V1.
[17]
GCdataPR Editorial Office. GCdataPR
data sharing policy [OL]. https://doi.org/10.3974/dp.policy.2014.05
(Updated 2017).
[18] Funk,
C. C., Peterson, P. J., Landsfeld, M. F., et al. A quasi-global
precipitation time series for drought monitoring [J/DB/OL]. USGS Professional
Paper Data, 2014. https://data.chc.ucsb.edu/products/ CHIRPS-2.0.
[19]
Yang,
K., He, J., Tang, W. J., et al. China meteorological forcing dataset
v1.6 (1979–2018) [DB/OL].National Tibetan Plateau/Third Pole Environment Data Center, 2019.
https://doi.org/10.11888/AtmosphericPhysics.tpe. 249369.file.
[20]
Balsamo, G., Albergel, C.,
Beljaars, A., et al. ERA-Interim/Land: a global land surface reanalysis
data set [J/DB/OL]. Hydrology and Earth System Sciences, 2015.
https://doi.org/10.5194/hess-19-389-2015.
[21]
Hengl, T., Mendes de Jesus, J.,
Heuvelink, G. B. M., et al. SoilGrids-global gridded soil information [J/DB/OL].
ISRIC World Soil Information, 2017.
https://files.isric.org/soilgrids/former/2017-03-10/.
[22]
Jarvis, A., Guevara, E.,
Reuter, H. I., et al. Hole-filled seamless SRTM data V4 [J/DB/OL]. International
Centre for Tropical Agriculture (CIAT), 2008.
http://srtm.csi.cgiar.org.
[23]
Tucker, C. J., Pinzon, J. E.,
Brown, M. E., et al. An extended AVHRR-8 km NDVI dataset compatible with
MODIS and SPOT vegetation NDVI data [J/DB/OL]. International Journal of Remote Sensing, 2005, 26(20): 4485–4498.
[24]
Kamel, D., Alfredo, H., MODAPS
SIPS. MOD13Q1 MODIS/Terra Vegetation Indices 16-Day L3 Global 250m SIN Grid [J/DB/OL].
NASA LP DAAC, 2015. http://doi.org/10.5067/MODIS/MOD13Q1.006.
[25]
Lin, J. K., Guan, Q. Y., Tian,
J., et al. Assessing temporal trends of soil erosion and sediment
redistribution in the Hexi Corridor region using the integrated RUSLE-TLSD
model [J]. Catena, 2020, 195: 104756.
[26]
Hou, X. Y. Vegetation Atlas of
China [DB/OL]. Resource and Environment Science Data Platform, 2001. https://www.resdc.cn/data.aspx?DATAID=122.
[27]
Wischmeier, W. H., Smith, D. D.
Predicting Rainfall Erosion Losses: A Guide to Conservation Planning [M]. U.S.
Department of Agriculture, Agriculture Handbook No. 537, 1978.
[28]
Li, S. C., Zhang, Y. L., Wang,
Z. F., et al. Mapping human influence intensity in the Tibetan Plateau
for conservation of ecological service functions [J]. Ecosystem Services,
2018, 30: 276–286.
[29]
Zhang, W. B., Xie, Y., Liu, B.
Y. Rainfall erosivity estimation using daily rainfall amounts [J]. Geographical
Science, 2002, 22(6): 705–711.
[30]
Xie,
Y., Yin, S. Q., Liu, B. Y., et al. Models for estimating daily rainfall
erosivity in China [J]. Journal of Hydrology, 2016, 535: 547–558.
[31]
Yin, S., Xie, Y., Liu, B., et
al. Rainfall erosivity estimation based on rainfall data collected over a
range of temporal resolutions [J]. Hydrology and Earth System Sciences,
2015, 19(10): 4113–4126.
[32]
Sharpley,
A. N., Williams, J. R. EPIC-Erosion/Productivity Impact Calculator: 1. Model Documentation
[M]. USDA Technical Bulletin, 1990.
[33]
Torri, D., Poesen, J. W. A.,
Borselli, L. Predictability and uncertainty of the soil erodibility factor
using a global dataset [J]. Catena, 1997, 31(1–2): 1–22.
[34]
Panagos, P., Meusburger, K.,
Ballabio, C., et al. Soil erodibility in Europe: a high-resolution
dataset based on LUCAS [J]. Science of the Total Environment, 2014, 479–480(1):
189–200.
[35]
Moore, I. D., Burch, G. J.
Physical basis of the length-slope factor in the Universal Soil Loss Equation [J].
Soil Science Society of America Journal, 1986, 50(5): 1294–1298.
[36]
Desmet, P., Govers, G. A GIS
procedure for automatically calculating the USLE LS factor on topographically
complex landscape units [J]. Journal Soil and Water Conservation, 1996,
51(5): 427–433.
[37]
Böhner,
J., Selige, T. Spatial prediction of soil attributes using terrain analysis and
climate regionalization [OL]. In SAGA-Analyses and
modelling applications. Goltze, 2006. https://mediatum.ub.tum.de/doc/ 1304675/file.pdf.
[38]
Panagos, P., Borrelli, P.,
Meusburger, K., et al. Estimating the soil erosion cover-management
factor at the European scale [J]. Land Use Policy, 2015, 48: 38–50.
[39]
Majhi, A., Shaw, R., Mallick,
K., et al. Towards improved USLE-based soil erosion modelling in India:
a review of prevalent pitfalls and implementation of exemplar methods [J]. Earth-Science
Reviews, 2021, 221: 103786.
[40]
Huang, Y., Xin, Z., Gao, G., et
al. Increasing lateral transport of soil and carbon on the Tibetan Plateau [J].
Catena, 2024, 239: 107901.