Global Drought Experimental Dataset Development and
Analysis using Multi-Scenario Fusion Methods (2015–2100)
CUI Jingwen1,2 LIU Yangxiaoyue1* XI Yongshi3 ZHAO Guanfeng4
1. Institute of Geographic Sciences and Natural Resources
Research, Chinese Academy of Sciences, Beijing 100101, China;
2. University of Chinese
Academy of Sciences, Beijing 100049, China;
3. Xizang Autonomous Region
Agro-products Quality and Safety Inspection and Testing Center, Lhasa 850000,
China;
4. Xizang Autonomous Region
Agricultural Technology Extension Service Center, Lhasa 850000, China
Abstract: Global climate change
is intensifying droughts in terms of frequency, spatial coverage, and severity,
making them a prominent environmental challenge that threatens the stability of
natural ecosystems and human society. To establish a reliable global multi-scenario
future drought prediction dataset, this study adopts 18 Earth system models
from the Coupled Model Intercomparison Project Phase 6 (CMIP6), selecting 4
core climate variables — precipitation (mm/month), moisture in the upper
portion of the soil column (% volumetric), near-surface air temperature (℃), and potential evapotranspiration
(PET, mm/month). Based on unified temporal and spatial resolutions, 4
representative drought indices were calculated: the Standardized Precipitation
Evapotranspiration Index (SPEI), the Drought Severity Index (DSI), the
Temperature Condition Index (TCI), and the Standardized Soil Moisture Index
(SSMI). By validating the predictive performance of each index against 5 major
historical drought events, DSI and SSMI were found to perform best in
characterizing drought intensity and its spatial distribution, and could
reasonably reproduce the spatiotemporal evolution of future droughts. In terms
of numerical interpretation, lower SPEI, SSMI, and DSI values indicate more
severe drought, with values below −1.0, −1.5, and −2.0 indicating at least
moderate drought, at least severe drought, and extreme drought, respectively.
Lower TCI values indicate greater heat stress, with TCI < 50% indicating
high heat stress. The dataset covers monthly values of the four drought indices
under the SSP1-2.6, SSP2-4.5, SSP3-7.0, and SSP5-8.5 scenarios from 2015 to
2100, at a spatial resolution of 0.5°, archived in .tif format, and consists of
16,512 data files with data size of 7.45 GB (compressed into 8 files, 4.86 GB).
Keywords: drought prediction; multi-scenario projections;
drought indices; global; data fusion
DOI: https://doi.org/10.3974/geodp.2026.05.05
Dataset Availability Statement:
The dataset
supporting this paper was published and is accessible through the Digital Journal of
Global Change Data Repository at:
https://doi.org/10.3974/geodb.2026.05.02.V1.
1 Introduction
As a typical natural hazard, drought has shown
trends of increasing frequency, expanding extent and intensifying severity
under global climate change, and has become an important climatic risk factor
affecting ecosystem health, agricultural production, water resource security
and the sustainable development of regional socio-economic systems[1–3]. With the intensification of global
warming, the continued rise in air temperature interacts with changes in the spatiotemporal patterns of precipitation, making
drought events more complex and uncertain
and imposing higher demands on the scientific assessment and accurate
moni- toring of drought[4].
To characterize
the evolution of drought and its multidimensional impacts more comprehensively,
the academic community has developed a variety of drought indices, which are
widely used in drought identification, monitoring and risk assessment. Among
these, the Standardized Precipitation Evapotranspiration Index (SPEI), the
Drought Severity Index (DSI), the Temperature Condition Index (TCI) and the
Standardized Soil Moisture Index (SSMI) are representative. SPEI integrates the
effects of precipitation and potential evapotranspiration and is therefore more
sensitive to the influence of temperature change on the water balance[5]. SSMI
mainly assesses soil moisture deficits and is commonly regarded as an important
indicator of agricultural drought[6]. TCI is based on remotely sensed land
surface temperature (LST) data and assesses vegetation thermal stress, making
it applicable to large-scale and high-frequency drought monitoring[7]. DSI,
in turn, can more compre- hensively
reflect the ecological and hydrological responses during drought events. Each
of these four indices has its own strengths, and their combined use can improve
the timeliness and accuracy of drought identification and enhance the capacity
to respond to different drought types.
In recent years,
the Coupled Model Intercomparison Project Phase 6 (CMIP6) has provided abundant
climate simulation data for drought monitoring research[8,9].
Compared with traditional observational and reanalysis datasets (e.g., ERA5,
CRU and GPCC), CMIP6 offers advantages such as broader global coverage, longer
temporal span, richer variables and scientifically designed scenarios, and can
provide climate projections under a range of socio-economic development
pathways. The Shared Socioeconomic Pathways in CMIP6 (SSP1-2.6, SSP2-4.5,
SSP3-7.0 and SSP5-8.5) cover a range of future scenarios from low to high
emissions and are suitable for analyzing drought risk under multi-scenario
comparison.
Although drought
indices and CMIP6 data have been widely applied in various studies, a global
drought monitoring dataset that systematically integrates multi-source drought
indices with CMIP6 multi-scenario climate data is still lacking. To some
extent, this has limited cross-comparison among drought indices, risk
assessment across different regions, and multi-perspective analysis and
integrated interpretation of drought trends under future climate change
scenarios. Therefore, based on the four drought indices SPEI, DSI, TCI and
SSMI, and combining CMIP6 historical simulations with future climate scenario
data, this study constructs a dataset with global coverage, multiple
spatiotemporal scales and a unified processing workflow, aiming to provide a
high-quality basic data product for research on the spatiotemporal evolution of
drought, risk assessment and decision support under climate change. The release
of this dataset will provide data support for global drought monitoring
research and will also serve as an important reference for research on extreme
climate responses and for the development of regional climate adaptation
strategies.
2 Metadata of the Dataset
Table 1 summarizes the metadata for Global drought
experimental dataset using multi-scenario fusion
methods (2015–2100)[10]. It includes the dataset title, authors, geographic coverage, year
of the dataset, temporal resolution, spatial resolution, dataset files, etc.
Table 1 Metadata
summary for Global drought experimental dataset using multi-scenario fusion
methods (2015–2100)
|
Item
|
Description
|
|
Dataset full name
|
Global drought
experimental dataset using multi-scenario fusion methods (2015–2100)
|
|
Dataset short name
|
GlobalDrought_2015-2100
|
|
Authors
|
Cui, J. W.,
Institute of Geographic Sciences and Natural Resources Research, Chinese
Academy of Sciences; University of Chinese Academy of Sciences, jingwencui99@gmail.com
Liu, Y. X. Y., Institute of Geographic Sciences and Natural Resources
Research, Chinese Academy of Sciences, lyxy@lreis.ac.cn
Xi, Y. S., Xizang
Autonomous Region Agro-products Quality and Safety Inspection and Testing
Center, yongshi.x@163.com
Zhao,
G. F., Xizang Autonomous Region Agricultural Technology Extension Service
Center, 284470203@qq.com
|
|
Geographical region
|
Global (90° N to
60° S)
|
|
Year
|
2015–2100
|
|
Temporal
resolution
|
month
|
|
Spatial
resolution
|
0.5°×0.5°
|
|
Data format
|
.tif
|
|
Data size
|
7.45 GB
|
|
Data files
|
Monthly values of four
representative drought indices (TCI, SPEI, DSI, and SSMI) predicted for
2015–2100 under the SSP1-2.6, SSP2-4.5, SSP3-7.0, and SSP5-8.5 scenarios
|
|
Foundations
|
National Natural
Science Foundation of China (42571539); Ministry of Science and
Technology of P. R. China (2022YFF0711603)
|
|
Computing
environment
|
Python 3.10
|
|
Data publisher
|
Global Change Research Data Publishing & Repository,
http://www.geodoi.ac.cn
|
|
Address
|
No. 11A, Datun Road, Chaoyang District,
Beijing 100101, China
|
|
Data sharing
policy
|
(1) Data
are openly available and can be freely downloaded via the Internet; (2) End
users are encouraged to use Data
subject to proper citation; (3) Users, who are by definition also value-added
service providers, are welcome to redistribute Data subject to written permission from the GCdataPR Editorial
Office and the issuance of a Data
redistribution license; and (4) If Data
are used to compile new datasets, the “ten percent principle” should be
followed such that Data records
utilized should not surpass 10% of the new dataset contents, while sources
should be clearly noted in suitable places in the new dataset[11]
|
|
Communication and searchable system
|
DOI, CSTR,
Crossref, DCI, CSCD, CNKI, SciEngine, WDS, GEOSS, PubScholar, CKRSC, OARL
|
3 Methods
3.1 Data Sources
Under
the four Shared Socioeconomic Pathway scenarios (SSP1-2.6, SSP2-4.5, SSP3-7.0
and SSP5-8.5), this study selected 4 key variables from 18 CMIP6 models for
drought index calculation and distinguished the model sources by variable.
Precipitation (mm/month), moisture in the upper portion of the soil column (%
volumetric) and near-surface air temperature (℃) were provided by the following
16 models: ACCESS-CM2 (Commonwealth Scientific and Industrial Research
Organization, Australia), BCC-CSM2- MR (Beijing Climate Center, China
Meteorological Administration), CAMS-CSM1-0 (Chinese Academy of Meteorological
Sciences), CanESM5-CanOE (Canadian Centre for Climate Modelling and Analysis),
CESM2 (National Center for Atmospheric Research, USA), CMCC-CM2-SR5 (Centro
Euro-Mediterraneo sui Cambiamenti Climatici, Italy), CNRM-CM6-1-HR (Centre
National de Recherches Météorologiques, France), CNRM- ESM2-1 (Centre National
de Recherches Météorologiques, France), KACE-1-0-G (National Institute of
Meteorological Sciences, Korea Meteorological Administration), MIROC6 (Japan
Agency for Marine-Earth Science and Technology), MIROC-ES2L (Japan Agency for
Marine-Earth Science and Technology), MPI-ESM1-2-LR (Max-Planck-Institut für
Meteorologie, Germany), MRI-ESM2-0 (Meteorological Research Institute, Japan),
NorESM2-MM (Norwegian Climate Center, Norway), TaiESM1 (Academia Sinica, Taiwan,
China) and UKESM1-0-LL (Met Office Hadley Centre, UK); potential
evapotranspiration (PET, mm/month) was provided by CNRM-CM6-1 (Centre National
de Recherches Météorologiques, France), IPSL-CM6A-LR (Institut Pierre-Simon
Laplace, France) and CNRM-ESM2-1 (Centre National de Recherches
Météorologiques, France). All datasets were harmonized to a spatial resolution
of 0.5°×0.5° and a monthly temporal resolution to ensure comparability across
models and variables.
3.2 Technical Workflow
This
study aims to develop a stable and reliable CMIP6-based global drought
projection data product. First, all gridded datasets were converted to TIFF
format and standardized to a spatial resolution of 0.5°×0.5° and a monthly
temporal resolution. To improve the robustness of each variable, pixel-wise
ensemble means were calculated across the available climate models, subject to
a minimum threshold for the number of valid models. Specifically, at least 8
valid models were required for variables available from 16 models, while at
least 2 valid models were required for variables available from 3 models.
Pixels that did not meet the corresponding threshold were assigned a NoData
value of −9999. Second, 4 drought indices were calculated, and drought severity
categories were defined according to the corresponding index values. Third, the
performance of the four drought indices was evaluated against documented severe
drought events to assess their ability to reproduce observed drought
conditions.
3.3 Drought Index Calculation
This
study calculated 4 drought indices, including SPEI, SSMI, TCI, and DSI.
3.3.1 SPEI
 (1)
where
S is the water balance value (mm/month), P is the precipitation
(mm/month), PET is the potential evapotranspiration (mm/month).
 (2)
where
Scumul represents the cumulative water balance over the
selected time scale (mm/month), n represents the time scale (e.g., n=3
for 3 months), Si is the water balance value for the i-th
month (mm/month).
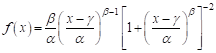 (3)
where
f(x) represents the probability density function of the
cumulative water balance, x is the
cumulative water balance value (mm/month), α, β, and γ are
the scale parameter (mm/month), the shape parameter (dimensionless), and the
location parameter (mm/month), respectively. These parameters were estimated
using maximum likelihood.
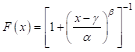 (4)
where
F(x) represents the cumulative probability for a given Scumul
(dimensionless).
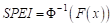 (5)
|
Table 2 Classification of drought and wetness
severity based on SPEI values
|
|
SPEI value
|
Category
|
|
SPEI > 2.0
|
Extremely wet
|
|
1.5 < SPEI ≤ 2.0
|
Very wet
|
|
1.0 < SPEI ≤ 1.5
|
Wet
|
|
–1.0 ≤ SPEI ≤ 1.0
|
Normal
|
|
–1.5 ≤ SPEI < –1.0
|
Moderate drought
|
|
–2.0 ≤ SPEI < –1.5
|
Severe drought
|
|
SPEI < –2.0
|
Extreme drought
|
where
Φ−1 is the inverse of the standard normal distribution (probit
function), SPEI values follow a standard normal distribution with a mean
of 0 and a standard deviation of 1. The SPEI values are classified to
determine drought or wetness severity based on the following thresholds. SPEI
values are interpreted according to the classification in Table 2.
3.3.2 SSMI
 (6)
where
X represents the soil moisture value at a specific time step (%), and μ
refers to the mean of the entire time series (%), σ is the standard
deviation of the entire time series (%).
 (7)
where
N is the total number of time steps (dimensionless), and Xᵢ is
the soil moisture value at the i-th time step (%).
 (8)
|
Table 3 Classification of drought and wetness
severity based on SSMI values
|
|
SSMI
value
|
Category
|
|
SSMI > 2.0
|
Extremely wet
|
|
1.5 < SSMI ≤ 2.0
|
Very wet
|
|
1.0 < SSMI ≤ 1.5
|
Wet
|
|
–1.0 ≤ SSMI ≤ 1.0
|
Normal
|
|
–1.5 ≤ SSMI < –1.0
|
Moderate drought
|
|
–2.0 ≤ SSMI < –1.5
|
Severe drought
|
|
SSMI < –2.0
|
Extreme drought
|
The SSMI values are interpreted according
to Table 3.
3.3.3 TCI
TCI
is a widely used drought indicator based on land surface temperature (LST), and
is designed to quantify thermal stress levels on vegetation within specific
regions. The TCI reflects the relative position of current surface temperature
within its historical range, providing valuable insights into the impact of
heat stress on vegetation.
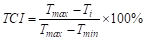 (9)
where
Ti refers to the LST (℃) at time i. Tmax
is the maximum LST during the study period, and Tmin is the
minimum LST (℃) during the same period.
The TCI
values range from 0% to 100%, providing a direct measure of heat stress on
vegetation. High TCI values (TCI≥50%): Indicate that the current
temperature is closer to the historical minimum, suggesting low heat stress,
which is beneficial for vegetation growth. Low TCI values (TCI<50%):
Indicate that the current temperature is closer to the historical maximum,
reflecting severe heat stress that may inhibit vegetation growth.
3.3.4 DSI
 (10)
where
X is the water balance value (mm/month), P is the precipitation
(mm/month), PET is the potential evapotranspiration (mm/month). This
represents the net water available in the system after accounting for losses
due to evapotranspiration.
 (11)
where
X is the current value of water balance (mm/month). μ is the
long-term mean of the variable (mm/month), and σ is the long-term
standard deviation of the variable (mm/month). Table 4 presents the
classification of drought and wetness severity based on DSI values.
(12)
(13)
4 Data Results and Validation
|
Table 4
Classification of drought and wetness severity based on DSI values
|
|
DSI value
|
Drought
classification
|
|
DSI ≤ –2.0
|
Extreme drought
|
|
–2.0 < DSI ≤ –1.5
|
Severe drought
|
|
–1.5 < DSI ≤ –1.0
|
Moderate drought
|
|
–1.0 < DSI ≤ 1.0
|
Normal condition
|
|
DSI > 1.0
|
Wet condition
|
4.1 Dataset Composition
The
dataset includes monthly global drought data for 2015 to 2100 predicted under
the SSP1-2.6, SSP2-4.5, SSP3-7.0, and SSP5-8.5 scenarios using four drought
indices. The spatial resolution is 0.5° and files are named as
ssp126_yyyy.mm_DSI.tif.
4.2 Data Validation
This
study examined 5 high-profile drought events in recent years: the severe
drought in Europe in 2022, the prolonged drought in the Horn of Africa from
2020 to 2023, the “megadrought” in central Chile since 2010, the historic
drought in the western United States in 2022, and the extreme drought in Southern
China in 2022. Under the four Shared Socioeconomic Pathway (SSP) scenarios, we
conducted a comprehensive analysis of these events using 4 drought indices:
SPEI, TCI, DSI and SSMI. The results show marked differences among the indices.
Compared with SPEI and TCI, DSI and SSMI perform better in identifying the
severity and spatial extent of major droughts. Although SPEI can distinguish a
spectrum of drought categories from normal to extreme, it often underestimates
the actual intensity and affected area. TCI assesses heat stress using
near-surface air temperature but does not account for key hydrometeorological
factors such as precipitation and soil moisture. Its classification scheme is
relatively simple, typically limited to “high” and “low” heat-stress levels,
resulting in weaker performance for complex or compound droughts. By contrast,
DSI and SSMI yield more stable and accurate results. In these cases, their
assessments align closely with in situ observations and media reports,
indicating stronger practical applicability. These findings underscore the
importance of selecting appropriate drought indices in the context of climate
change. Given their consistent performance across regions and emission scenarios,
we recommend DSI and SSMI as core tools for global drought monitoring to
enhance drought risk management and support the development of local response
strategies.
4.3 Data Results Analysis
Using July 2030 as an
example of the CMIP6 global drought projection data product, Figure 1 presents
the global drought projections derived from different drought indices under the
four CMIP6 Shared Socioeconomic Pathway (SSP) scenarios (SSP1-2.6, SSP2-4.5,
SSP3-7.0 and SSP5-8.5). As shown in Figure 1, for a given drought index, the
global spatial distributions under the four SSP scenarios in July 2030 are
broadly similar, although regional differences in drought severity are evident.
By contrast, the spatial patterns differ markedly among the drought indices.
DSI and SSMI display relatively distinct regional
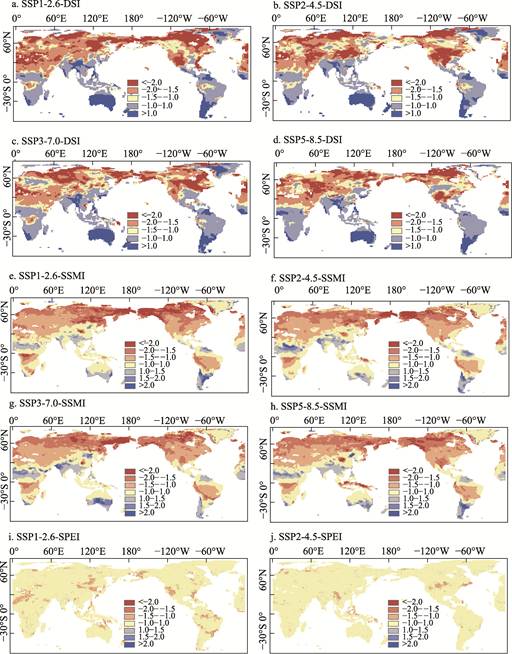
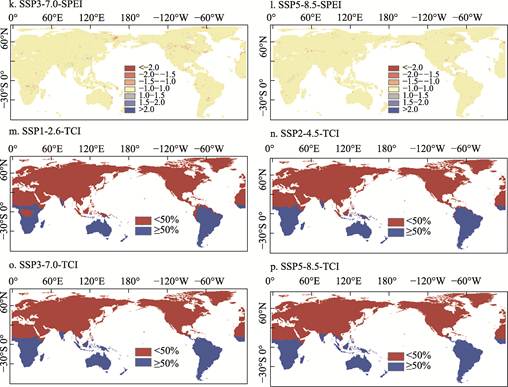
Figure
1 Maps of the global drought prediction
data of four drought indices under different scenarios (July 2030)
patterns, SPEI
shows comparatively limited spatial variation, and TCI yields a more
generalized distribution defined by high and low heat-stress categories.
Overall, this example provides an intuitive illustration of the global spatial
characteristics represented by the dataset across different scenarios and
drought indices.
5 Discussion and Conclusion
Drought has become
a pressing global climate and environmental challenge. Advancing drought
research is essential for improving early-warning capabilities and safeguarding
ecological and socioeconomic sustainability. Long-term, high-quality global
drought data are critical for understanding drought patterns, and reliable
future-scenario datasets are indispensable for accurately assessing its
spatiotemporal evolution under climate change. From a data-fusion perspective,
this study integrates 4 drought indices under SSP1-2.6, SSP2-4.5, SSP3-7.0 and
SSP5-8.5, combining outputs from multiple CMIP6 models, to produce a global
monthly drought projection dataset for the period 2015–2100 at a spatial
resolution of 0.5°×0.5°. Validation against 5 major drought events indicates
that DSI and SSMI better capture drought severity and spatial extent,
suggesting that the dataset can effectively characterize future global drought
patterns and their evolving trends.
Author Contributions
Liu,
Y. X. Y. conducted the overall design for the dataset development; Cui, J. W.
collected and processed the data; Xi, Y. S. designed the models and algorithms;
Zhao, G. F. performed the data validation; Cui, J. W. wrote the data paper.
Conflicts
of Interest
The authors declare no conflicts of
interest.
References
[1]
Allen, C. D., Macalady, A. K.,
Chenchouni, H., et al. A global overview of drought and heat-induced
tree mortality reveals emerging climate change risks for forests [J]. Forest
Ecology and Management, 2010, 259(4): 660–684.
[2]
Lesk, C., Rowhani, P.,
Ramankutty, N. Influence of extreme weather disasters on global crop production
[J]. Nature, 2016, 529(7584): 84–87.
[3]
He, X. G., Pan, M., Wei, Z. W.,
et al. A global drought and flood catalogue from 1950 to 2016 [J]. Bulletin
of the American Meteorological Society, 2020, 101(5): E508–E535.
[4]
Wang, L., Chen, W., Fu, Q., et
al. Super droughts over East Asia since 1960 under the impacts of global
warming and decadal variability [J]. International Journal of Climatology,
2022, 42(9): 4508–4521.
[5]
Vicente-Serrano, S. M.,
Beguería, S., López-Moreno, J. I. A multiscalar drought index sensitive to
global warming: the standardized precipitation evapotranspiration index [J]. Journal
of Climate, 2010, 23(7): 1696–1718.
[6]
Wang, W., Wang, P., Cui, W. A
comparison of terrestrial water storage data and multiple hydrological data in
the Yangtze River basin [J]. Advances in Water Science, 2015, 26(6):
759–768.
[7]
Kogan, F. N. Application of
vegetation index and brightness temperature for drought detection [J]. Advances
in Space Research, 1995, 15(11): 91–100.
[8]
Eyring, V., Bony, S., Meehl, G.
A., et al. Overview of the coupled model intercomparison project phase 6
(CMIP6) experimental design and organization [J]. Geoscientific Model
Development, 2016, 9(5): 1937– 1958.
[9]
Tokarska, K. B., Stolpe, M. B.,
Sippel, S., et al. Past warming trend constrains future warming in CMIP6
models [J]. Science Advances, 2020, 6(12): eaaz9549.
[10] Cui, J. W., Liu, Y. X. Y., Xi, Y. S., et al. Global drought
experimental dataset using multi-scenario fusion methods (2015–2100) [J/DB/OL].
Digital Journal of Global Change Data Repository, 2026. https://doi. org/10.3974/geodb.2026.05.02.V1.
[11] GCdataPR Editorial Office. GCdataPR
data sharing policy [OL]. https://doi.org/10.3974/dp.policy.2014.05 (Updated
2017).