30-m
Raster Dataset Development of Key Carbon Cycle Parameters for Terrestrial
Ecosystems in the Guangdong-Hong Kong-Macao Greater Bay Area (2001–2025)
YOU Jiakai1,2,3 ZHANG Yinghui1,2,3* HU Zhongwen1,2,3 GUO Shanxin4
WANG Jingzhe5 WU Guofeng1,2,3
1. School
of Architecture and Urban Planning, MNR Key Laboratory for Geo-Environmental
Monitoring of Great Bay Area, Shenzhen University, Shenzhen 518060, China;
2. Guangdong Key Laboratory of Urban Informatics,
Shenzhen 518060, China;
3. Shenzhen Key Laboratory of Spatial Smart Sensing
and Services, Shenzhen 518060, China;
4. Shenzhen Institute of Advanced Technology,
Chinese Academy of Sciences, Shenzhen 518055, China;
5. School of Artificial Intelligence, Shenzhen
Polytechnic University, Shenzhen 518055, China
Abstract:
Vegetation parameters are essential indicators
for characterizing regional ecological dynamics. They provide valuable
information for fine-scale ecological monitoring and for elucidating the
characteristics and variations of carbon sources and sinks in terrestrial
ecosystems. The Normalized Difference Vegetation Index (NDVI), Enhanced
Vegetation Index (EVI), Leaf Area Index (LAI), Fraction of Absorbed
Photosynthetically Active Radiation (FPAR), and Gross Primary Production (GPP)
collectively constitute the key parameters for characterizing the carbon cycle
of terrestrial ecosystems. Existing MODIS vegetation products exhibit
spatiotemporal discontinuity due to main-algorithm failures and contain mixed
pixels resulting from their 500-m spatial resolution. To address these
limitations, this study focuses on the Guangdong-Hong Kong-Macao Greater Bay
Area. Under the constraint of land cover consistency, the mSSA algorithm was
introduced to spatiotemporally reconstruct the areas affected by the main algorithm
failures across the five core MODIS vegetation-parameter products.
Subsequently, the annual maximum NDVI from Landsat was extracted to represent
spatial texture features. Spatial weight constraints were then applied to
downscale the reconstructed dataset. These procedures yielded a 30-m resolution
dataset of key terrestrial ecosystem carbon cycle parameters for the region
covering 2001–2025. The generated dataset was validated against standard MODIS
vegetation products. The validation results indicate a high consistency between
this dataset and the MODIS products. The coefficient of determination (R2)
for the vegetation parameters ranges from 0.729 to 0.941, and the fitting
slopes range from 0.82 to 0.96. The dataset includes the following components:
(1) boundary data for the Guangdong-Hong Kong-Macao Greater Bay Area; and (2)
key carbon cycle parameter data for terrestrial ecosystems within the region.
The latter comprises 8-day GPP, LAI, and FPAR datasets, alongside 16-day EVI
and NDVI datasets. The dataset is archived in .shp and .tif formats. It
consists of 4,893 data files with a total data volume of 1.01 TB.
Keywords: MODIS; vegetation
parameters; spatial downscaling; spatiotemporal reconstruction; high spatial
resolution
DOI: https://doi.org/10.3974/geodp.2026.05.08
Dataset Availability Statement:
The dataset supporting this paper
was published and is accessible through the Digital Journal of Global Change Data Repository
at: https://doi.org/10.3974/geodb.2026.03.10.V1.
1 Introduction
Vegetation
parameters are characteristic values derived from the combined calculation of
multispectral remote sensing data based on the spectral properties of
vegetation. They serve as a simple and effective empirical measure of land
surface vegetation conditions. These parameters hold significant application
value in fields such as land cover, environmental change, primary productivity
analysis, and terrestrial ecosystem carbon sinks. They act as a critical link
connecting the physical structure of land surface vegetation with its
physiological functions[1–3]. The Normalized Difference Vegetation
Index (NDVI)[4], Enhanced Vegetation Index (EVI)[5], Leaf
Area Index (LAI)[6,7], Fraction of Absorbed Photosynthetically
Active Radiation (FPAR)[8], and Gross Primary Production (GPP)[9]
collectively constitute the key parameter for characterizing the carbon cycle
of terrestrial ecosystems. This dataset serves as an important foundation for
fine-scale ecological monitoring in highly heterogeneous regions, such as the
Guangdong-Hong Kong-Macao Greater Bay Area, and for elucidating the
characteristics and variations of carbon sources and sinks[2]. To
date, various vegetation parameter products have been generated using satellite
remote sensing data. Among these, MODIS products are the most widely utilized[10–12].
However, factors such as cloud and precipitation interference can cause the
main retrieval algorithm to fail. When backup algorithms are subsequently
activated, they introduce anomalous fluctuations and biases into the long
time-series data[13]. Such spatiotemporal discontinuity restricts
the application potential of existing vegetation parameter products for
fine-scale temporal dynamic monitoring[8].
To address these
issues, previous studies have commonly used time-series reconstruction
algorithms or multi-source data-fusion techniques[14,15]. However,
algorithms such as HANTS, which are based on harmonic analysis, rely heavily on
the strict assumption of periodic vegetation variations. They have difficulty
characterizing irregular vegetation changes in highly heterogeneous regions[14].
Furthermore, spatiotemporal data-fusion techniques proposed by some scholars[16–18]
are often limited by the low revisit frequencies of polar-orbiting satellites.
This limitation makes it difficult to capture valid cloud-free reference
datasets, leading to the failure of fusion models due to a lack of effective
inputs[19,20]. Current methods are generally limited by the strict
phenological cycle presets of single pixels or by the bottleneck of acquiring
cloud-free reference images. They fail to fully exploit the co-evolutionary
characteristics among homogeneous pixels within highly heterogeneous land
surfaces.
In addition, MODIS
vegetation-parameter products with a 500-m spatial resolution are still
affected by mixed-pixel effects when characterizing the highly fragmented land
surface of the Greater Bay Area[22–24]. The complex land-use
patterns in this region results in the mixing of multiple land-use types within
a single coarse-resolution pixel. This mixed-pixel effect obscures the true
spatial heterogeneity of vegetation and introduces systematic biases into regional
ecological assessments. Consequently, it is difficult to support fine-scale
ecological monitoring requirements[22]. Therefore, there is an
urgent need to enhance the spatial representation of vegetation parameter
products through spatial downscaling techniques[22,25,26].
To this end, this
study selected the Guangdong-Hong Kong-Macao Greater Bay Area as the study
region. Under the constraint of land cover consistency, the mSSA algorithm was
introduced[27]. Optimal neighboring pixels were selected through
spatiotemporal quality weighting to achieve high-quality spatiotemporal
reconstruction for the areas affected by the main algorithm failures across the
five MODIS vegetation parameter products. Second, to address the spatial
mixed-pixel effect, the annual maximum NDVI from Landsat was extracted as a
texture feature to represent the spatial distribution of vegetation. This
feature was utilized as a spatial weight constraint to downscale the
reconstructed products. Ultimately, a 30-m spatial resolution dataset of key
terrestrial ecosystem carbon cycle parameters for the Greater Bay Area spanning
from 2001 to 2025 was constructed. This dataset provides data support for
regional ecosystem assessment and fine-scale management.
2 Metadata of the Dataset
The metadata
for the 30-m raster dataset of key carbon cycle parameters for terrestrial
ecosystems in the Guangdong-Hong Kong-Macao Greater Bay Area (2001–2025)[28]
are summarized in Table 1. The provided information includes the dataset name,
authors, geographical region, temporal coverage, temporal resolution, spatial
resolution, dataset composition, data publishing and sharing platform, and data
sharing policy.
3 Methods
3.1 Data Sources
(1)
Vegetation parameter data
The production of
this dataset relies on three standard MODIS products with a 500-m spatial
resolution: MOD17A2H[30], MOD15A2H[11], and MOD13Q1[31]. Specifically, MOD17A2H provides GPP data with an 8-day temporal
resolution. MOD15A2H provides LAI and FPAR data with an 8-day temporal
resolution. MOD13Q1 provides EVI and NDVI data with a 16-day temporal
resolution. Each product is equipped with an independent Quality Control (QC)
layer. These layers identify the retrieval algorithm type of the pixels and the
contamination status from clouds, aerosols, and snow/ice. They provide a
fundamental basis for the subsequent screening of high-quality observations.
(2) Land cover type
data
The MCD12Q1 product
was used as auxiliary land-cover data[32]. It provides surface- homogeneity
constraints during the spatiotemporal reconstruction process. The LC_Type3
classification scheme was adopted. 8 core vegetation types were extracted:
grasslands, shrublands, broadleaf crops, savannas, evergreen broadleaf forests,
deciduous broadleaf forests, evergreen needleleaf forests, and deciduous
needleleaf forests. Water bodies and non-vegetated areas were excluded. This
ensures that the algorithm extracts synergistic features among similar land
cover types.
(3) Spatial texture
feature reference data
The annual maximum
NDVI data derived from Landsat imagery at a 30-m spatial resolution, were
selected as the spatial texture feature reference data for the downscaling
algorithm[33]. These data characterize the optimal growth potential
of vegetation on an interannual scale and its fine spatial distribution
structure.
Table 1 Metadata summary of the 30-m raster
dataset of key carbon cycle parameters for terrestrial ecosystems in the
Guangdong-Hong Kong-Macao Greater Bay Area (2001–2025)
|
Items
|
Description
|
|
Dataset full name
|
30-m raster dataset of key carbon cycle parameters for terrestrial
ecosystems in the Guangdong-Hong Kong-Macao Greater Bay Area (2001–2025)
|
|
Dataset short name
|
GBA_VP
|
|
Authors
|
You, J. K., MNR Key Laboratory for Geo-Environmental Monitoring of
Great Bay Area, youjiakai2024@mails.szu.edu.cn
Zhang, Y. H., MNR Key Laboratory for Geo-Environmental Monitoring
of Great Bay Area, zyhui@szu.edu.cn
Hu, Z. W., MNR Key Laboratory for Geo-Environmental Monitoring of
Great Bay Area, zwhoo@szu.edu.cn
Guo, S. X., Shenzhen Institute of Advanced Technology, Chinese
Academy of Sciences, sx.guo@siat.ac.cn
Wang, J. Z., School of Artificial Intelligence, Shenzhen
Polytechnic University, jzwang@szpt.edu.cn
Wu, G. F., MNR Key Laboratory for Geo-Environmental Monitoring of
Great Bay Area, guofeng.wu@szu.edu.cn
|
|
Geographical region
|
Guangdong-Hong Kong-Macao Greater Bay
Area
|
|
Year
|
2001–2025
|
|
Temporal resolution
|
The LAI, FPAR, and GPP datasets have an 8-day temporal resolution,
whereas the NDVI and EVI datasets have a 16-day temporal resolution
|
|
Spatial resolution
|
30 m
|
|
Data format
|
.shp, .tif
|
|
Data size
|
1.01 TB
|
|
Data files
|
Boundary data of the Guangdong-Hong Kong-Macao Greater Bay Area;
Key terrestrial ecosystem carbon cycle parameter data for the Guangdong-Hong
Kong-Macao Greater Bay Area
|
|
Foundations
|
Shenzhen (JCYJ20220818101617037); National Natural Science
Foundation of China (42201347, 42401065); Guangdong Provincial Natural
Science Foundation (2026A1515010626)
|
|
Data computing environment
|
Python 3.12
|
|
Data publisher
|
Global Change Research Data
Publishing & Repository, http://www.geodoi.ac.cn
|
|
Address
|
No. 11A, Datun Road, Chaoyang
District, Beijing 100101, China
|
|
Data sharing policy
|
(1) Data
are openly available and can be free downloaded via the Internet; (2) End
users are encouraged to use Data
subject to citation; (3) Users, who are by definition also value-added
service providers, are welcome to redistribute Data subject to written permission from the GCdataPR Editorial
Office and the issuance of a Data
redistribution license; and (4) If Data
are used to compile new datasets, the “ten percent principle” should be
followed such that Data records
utilized should not surpass 10% of the new dataset contents, while sources
should be clearly noted in suitable places in the new dataset[29]
|
|
Communication and searchable system
|
DOI, CSTR, Crossref, DCI, CSCD, CNKI,
SciEngine, WDS, GEOSS, PubScholar, CKRSC, OARL
|
3.2 Algorithm
(1) Selection of main algorithm results
Based on the
QC layers of the vegetation-parameter products, strict data cleaning was
conducted on the original time series. Retrieval pixels affected by cloud cover
or high aerosol loading, as well as pixels generated by backup empirical
algorithms, were identified and removed. Only uncontaminated, high-quality
valid observations generated by the main retrieval algorithm were retained; all
other invalid pixels were uniformly marked as missing values. This procedure
facilitated subsequent spatiotemporal reconstruction of areas where the main
algorithm failed.
(2) mSSA-based
spatiotemporal reconstruction algorithm considering land cover types
To address
the missing spatiotemporal data caused by main algorithm failures, the mSSA
algorithm was introduced for spatiotemporal continuity reconstruction. To
prevent the introduction of exogenous noise from heterogeneous surfaces, strict
land cover consistency constraints were applied during the reconstruction
process. For any missing pixel, the algorithm searches for valid neighboring
pixels with the same land cover type within its dynamic spatial window. A
comprehensive spatiotemporal weight ( )
is then calculated:
 (1)
where denotes
the number of valid observations of the neighboring pixel in the time series,
and
 denotes
the Chebyshev distance from the neighboring pixel to the central pixel. p
and q are hyperparameters adjusting the spatiotemporal importance. The
top K pixels of the same type with the highest comprehensive weight S
are selected to construct a multiple time-series matrix. The mSSA is then
utilized to extract common features, predict, and fill the missing values of
the central pixel. This completes the high-quality spatiotemporal
reconstruction of areas where the main algorithm failed.
(3) Spatial
weight-based downscaling algorithm
To address
the limitation that MODIS vegetation parameter products with a 500-m spatial
resolution cannot meet the requirements of fine-scale land surface monitoring,
a spatial- weight-based downscaling algorithm was adopted in this study. During
the spatial downscaling process, obtaining strictly time-matched, cloud-free,
single-date Landsat imagery is highly challenging due to long revisit cycles
and frequent cloud and precipitation cover[34,35]. To resolve this
issue, the physical rationale and basic assumption of the proposed algorithm
are as follows: although the absolute spectral reflectance of vegetation
exhibits significant phenological cycle fluctuations within a year, the
relative spatial distribution characteristics (i.e., spatial texture features)
of heterogeneous land surface vegetation within the same region remain stable
over an annual cycle[36]. Therefore, the annual maximum NDVI from
Landsat for the corresponding year was utilized as a high-resolution reference
image. Fine texture features at a 30-m spatial resolution were extracted and
transferred into the 500-m MODIS products.
First, the
30-m resolution Landsat reference image was aggregated to a 500-m resolution to
generate a background field image, denoted as  .
Second, a spatial conversion coefficient,
 ,
was calculated using the MODIS vegetation parameters reconstructed by the mSSA
algorithm (
 )
and the aggregated background field image. This coefficient quantifies
the numerical correspondence between dynamic parameters and the static base map
at the coarse resolution scale, reflecting the spatial texture details of the
land surface:
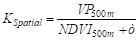 (2)
where
 is an infinitesimally small value added
to prevent a zero denominator. To eliminate obvious block boundaries generated
by the coarse-resolution grid and ensure the spatial continuity of the
reconstructed results, bilinear interpolation was applied to .
This ensures a smooth transition of the conversion coefficient between adjacent
pixels. Finally, the 30-m reference image (
 )
was multiplied by the smoothed spatial coefficient. This yields the final 30-m
spatial resolution key terrestrial ecosystem carbon cycle parameter products,
which preserve fine textures and are free of boundary artifacts:
 (3)
3.3 Technical
Route
The
dataset was developed in 3 main stages: data preprocessing, spatiotemporal
reconstruction, and spatial downscaling (Figure 1). First, pixels contaminated
by clouds, snow, and aerosols, together with retrieval results from backup
algorithms, were removed using the QC information from the MODIS
vegetation-parameter products. Only high-quality pixels processed by the main
algorithm were retained. At the same time, land-cover types from MCD12Q1 were
used as spatial constraints to exclude water bodies and non-vegetated areas.
Second, for areas with main-algorithm failures and missing data, a
comprehensive weight was calculated from observation quality and spatial
distance. Optimal pixels within neighborhoods of the same vegetation type were
selected to construct a multiple time-series matrix, which was input to the
mSSA model to extract common variation features and predict missing values.
This step generated a spatiotemporally seamless product at 500-m spatial
resolution. Finally, annual maximum NDVI from Landsat was used as a
high-resolution reference image, and the 500-m products were downscaled using
the spatial texture features provided by this reference image. The final
product is a spatiotemporally seamless 30-m dataset of key carbon-cycle
parameters (NDVI, EVI, LAI, FPAR, and GPP) for the Greater Bay Area from 2001
to 2025.
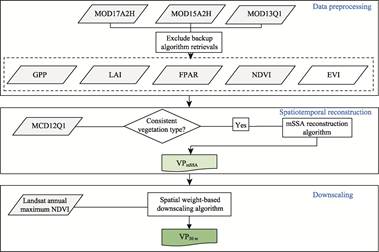
Figure 1 Flowchart of the dataset development
3.4 Data Validation Method
To verify
the accuracy of the dataset, correlation and error analyses were employed to
evaluate the processing results. Specifically, the coefficient of determination
(R2) and root mean square error (RMSE) were calculated to
examine the correlation and evaluate the errors between the standard MODIS
vegetation parameter products and the generated Greater Bay Area dataset:
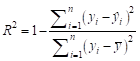 (4)
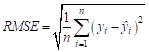 (5)
where  represents the total number of samples;
 denotes
the values of the MODIS dataset products;
 denotes the corresponding values of the
generated 30-m spatial resolution key terrestrial ecosystem carbon cycle
parameter dataset for the Greater Bay Area; and
 is the mean value of the MODIS dataset
products.
4 Data Results and Validation
4.1 Dataset Composition
The 30-m
raster dataset of key carbon cycle parameters for terrestrial ecosystems in the
Guangdong-Hong Kong-Macao Greater Bay Area (2001–2025)
mainly comprises 5 core parameters covering 2001–2025: GPP, LAI, and FPAR at an
8-day temporal resolution, and EVI and NDVI at a 16-day temporal resolution.
The directory 30m_XX represents the dataset for vegetation parameter XX and
contains subfolders such as GBA_XX_30m_ Downscaled_2001, which represents the
XX parameter dataset for 2001. Each subfolder contains data files named
according to the convention GBA_XXXX_30m_YYYYMMDD. tif, where YYYY, MM, and DD
represent the year, month, and day, respectively. For example,
GBA_NDVI_30m_20010101.tif represents NDVI data for the period beginning on
January 1, 2001 (Table 2).
Table
2 Main files of the dataset
|
Folder name
|
File names
|
Data description
|
Data
format
|
Number
of data
|
Data
size
|
|
30m_NDVI
|
GBA_NDVI_30m_YYYYMMDD
|
NDVI data file for YYYY/MM/DD. No scaling
factor is required
|
.tif
|
574
|
136 GB
|
|
30m_EVI
|
GBA_EVI_30m_
YYYYMMDD
|
NDVI data file for YYYY/MM/DD. No scaling
factor is required
|
.tif
|
573
|
137 GB
|
|
30m_LAI
|
GBA_LAI_30m_
YYYYMMDD
|
NDVI data file for YYYY/MM/DD. No scaling
factor is required
|
.tif
|
1,145
|
281 GB
|
|
30m_FPAR
|
GBA_FPAR_30m_YYYYMMDD
|
NDVI data file for YYYY/MM/DD. No scaling
factor is required
|
.tif
|
1,144
|
278 GB
|
|
30m_GPP
|
GBA_GPP_30m_
YYYYMMDD
|
GPP data file for YYYY/MM/DD. The unit is kg C·m–2. Data are missing due to the corruption of
official source data in 2022
|
.tif
|
1,150
|
294 GB
|
4.2 Data Validation
Figure 2
presents pixel-by-pixel comparisons between the 30-m gridded dataset of key
terrestrial ecosystem carbon-cycle parameters for the Greater Bay Area (2001–2025),
aggregated to 250-m and 500-m spatial resolutions, and the original MODIS
dataset for four periods. The downscaled dataset maintains a strong numerical
correlation with the original data. Across all seasons, the fitted lines for
the five parameters closely follow the 1:1 line.
The accuracy of each parameter exhibits
certain seasonal differences. NDVI, EVI, and GPP demonstrate high stability in
all seasons. Their R2 values are maintained above 0.865,
reaching a maximum of 0.941. The corresponding RMSE values are at extremely low
levels. The RMSE values for NDVI and EVI are generally stable below 0.09. The
RMSE for GPP is below 0.0054 kg C·m–2. The slopes of the fitted lines are
concentrated between 0.91 and 0.96. In contrast, the fitting accuracy of LAI
and FPAR exhibits some seasonal fluctuations. In winter and spring, the R2
values of both parameters remain at high levels. However, in summer and autumn,
their correlations slightly weaken. The R2 of LAI decreases
to 0.789, and the RMSE increases to 0.480. The R2 of FPAR
decreases to 0.729, and the RMSE increases to 0.1017. Nevertheless, the overall
regression slopes for both parameters remain between 0.82 and 0.92. These
results indicate that the dataset reasonably responds
numerically
to the changes in land surface heterogeneity caused by seasonal transitions
while preserving the spatial distribution patterns of the original observation
data.
To further quantify the ability of the downscaling
algorithm to restore land-surface spatial heterogeneity, independent
cross-validation of the 30-m Greater Bay Area dataset was performed using 10-m
Sentinel-2 imagery. Directly deriving advanced parameters such as LAI and FPAR
from standard Sentinel-2 products can introduce systematic errors. Therefore,
this validation focused on NDVI and EVI, which directly characterize vegetation
canopy features.
Figure 3 shows the scatter density
distributions and linear regression results between the Greater Bay Area 30-m
spatial resolution NDVI and EVI datasets and the aggregated Sentinel-2 data.
During winter (DOY 001), when vegetation is relatively sparse, the Greater Bay
Area products exhibit high consistency with Sentinel-2. The R2
of NDVI reaches 0.758, with an RMSE of 0.1245. The R2 of EVI
is 0.535, with an RMSE of 0.1168. In autumn (DOY 289), when vegetation cover in
the south is high, the correlation between the two vegetation parameters is
slightly lower than in winter. The R2 values for NDVI and EVI
are 0.690 and 0.529, respectively. Overall, a large number of pixels are
clustered around the 1:1 diagonal line. The slopes of the fitted lines are
maintained between 0.61 and 0.74, and the intercepts are small. This indicates
that the Greater Bay Area 30-m spatial resolution dataset successfully restores
spatial details and numerical distributions consistent with the Sentinel-2
sensor at the 30-m scale.
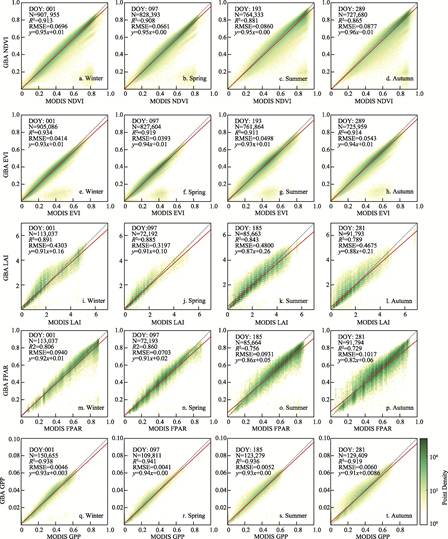
Figure 2 Scatter plots for
validation between the dataset GBA_VP and the original MODIS dataset
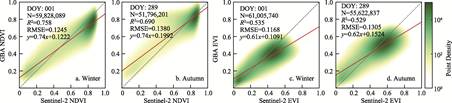
Figure 3 Scatter
plots for cross-validation between the dataset GBA_VP and Sentinel-2
observation data
4.3 Data Results Analysis
(1) Spatial distribution of key terrestrial
ecosystem carbon cycle parameters in the Greater Bay Area
Figure 4 shows the multi-year mean spatial distributions of the five key
terrestrial ecosystem carbon-cycle parameters in the study area for January,
April, July, and October during 2001–2025. The five parameters exhibit highly
consistent spatial patterns. High-value areas are mainly concentrated in
peripheral mountainous and hilly regions, including Zhaoqing, Huizhou, and
Jiangmen, whereas low-value areas are mainly distributed in the urban agglomeration
around the Pearl River Estuary, including Guangzhou, Shenzhen, Dongguan, Foshan,
Zhongshan, Hong Kong, and Macao. The 30-m data reveal the boundaries of
local-scale features such as intra-urban green spaces and river networks. In
terms of intra-annual variation, all five parameters show clear seasonality.
Values are relatively low in January, increase markedly in April, and reach
their annual maxima in July. In October, values decrease relative to July but
generally remain higher than those in January and April.
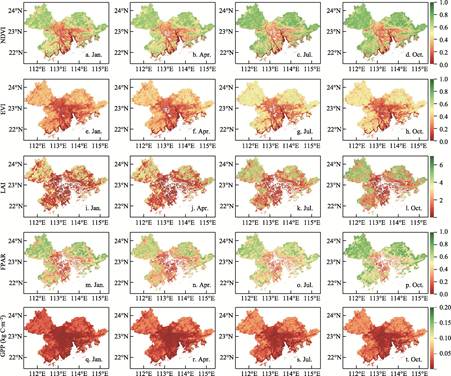
Figure 4 Multi-year average spatial distribution
of key terrestrial ecosystem carbon cycle parameters in the Guangdong-Hong
Kong-Macao Greater Bay Area (2001–2025)
(2) Temporal variation of key terrestrial
ecosystem carbon cycle parameters in the Greater Bay Area
Figure 5
illustrates the temporal variations in the five key terrestrial ecosystem
carbon cycle parameters (NDVI, EVI, LAI, FPAR, and GPP) in the Greater Bay Area
from 2001 to 2025. On an intra-annual scale, all five parameters exhibit highly
consistent, periodic seasonal fluctuations. The time-series curves are
continuous. Between 2001 and 2025, all five parameters show statistically
significant linear increasing trends. Specifically, the annual growth rates for
NDVI, EVI, and FPAR are 0.0050, 0.0038, and 0.0050, respectively. The annual
growth rates for LAI and GPP are 0.0266 and 0.0004 kg C·m–2,
respectively.
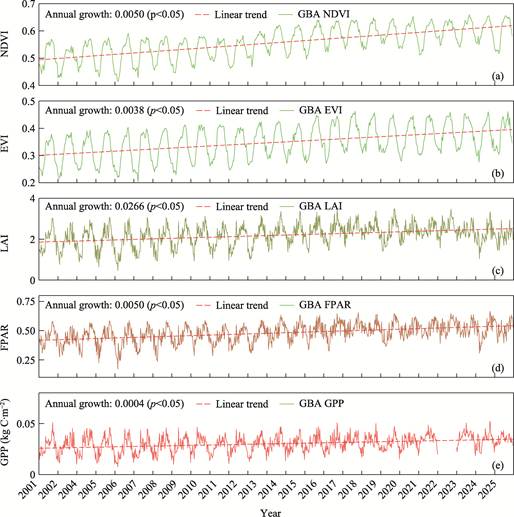
Figure 5 Temporal variations of key terrestrial
ecosystem carbon cycle parameters in the Greater Bay Area (2001–2025)
(3) Spatiotemporal reconstruction and
downscaling effects of key terrestrial ecosystem carbon cycle parameters in the
Greater Bay Area
Figure 6 compares local
spatial details of the five core vegetation parameters in the original MODIS
images, the spatiotemporally reconstructed images, and the final key
terrestrial ecosystem carbon-cycle parameter dataset for the Greater Bay Area.
The original images contain obvious data gaps (white pixels in the figure). In
the spatiotemporally reconstructed images, missing pixels are effectively
filled and spatial continuity is restored. In the final Greater Bay Area
dataset, the spatial resolution is improved to 30 m, recovering land-surface
texture and fine boundary features of land-cover objects.
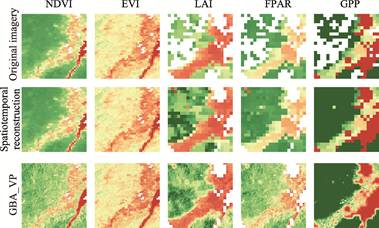
Figure 6 Comparison of local spatial
reconstruction and downscaling of key terrestrial ecosystem carbon cycle
parameters in the Greater Bay Area
5 Discussion and Conclusions
MODIS
vegetation parameter products have played a fundamental role in global
ecological and climate-change research. However, in regions with high
heterogeneity and intensive human disturbance, such as the Guangdong-Hong
Kong-Macao Greater Bay Area, their coarse 500-m
spatial resolution and frequent cloud and precipitation contamination lead to
severe mixed-pixel effects and data discontinuities. This study selected the
Greater Bay Area as the research region. Under strict land-cover constraints,
the mSSA spatiotemporal reconstruction algorithm was introduced. A
spatial-weight-based downscaling model was constructed in synergy with the fine
spatial texture features extracted from the annual maximum NDVI of Landsat.
Specifically, addressing the issue of inconsistent observation times between
Landsat and MODIS in multi-source spatiotemporal data fusion, the annual
maximum NDVI was utilized as a relatively stable, static spatial constraint
base map. By calculating spatial conversion coefficients, these stable spatial
texture features were mapped onto the coarse MODIS pixels[16].
Consequently, high-quality downscaling was achieved in the cloudy and rainy
southern regions, which lack high-frequency, cloud-free Landsat imagery. Thus,
a spatiotemporally continuous dataset of five key terrestrial ecosystem carbon
cycle parameters (NDVI, EVI, LAI, FPAR, and GPP) with a 30-m spatial
resolution, spanning from 2001 to 2025, was produced.
The pixel-by-pixel
validation results using the original MODIS observation data indicate that this
downscaled dataset enhances the expression capability of land surface texture
details while preserving the basic pattern of large-scale spatial distribution.
The overall fitting accuracy demonstrates high reliability. The R2
values of NDVI, EVI, and GPP remain stable above 0.865 year-round. It should be
noted that the fitting accuracy of LAI and FPAR exhibits phenology-driven
seasonal fluctuations. During summer and autumn, when vegetation canopy closure
reaches its peak, the correlation of both parameters experiences a certain
degree of attenuation. This attenuation is constrained by the saturation effect
of optical remote sensing signals and the nonlinear scattering of complex
canopy structures. Their R2 values decrease to 0.789 and
0.729, respectively. However, their linear regression slopes remain within a
reasonable range above 0.82. This dataset mitigates the limitations of existing
coarse-resolution products when applied to highly fragmented land surfaces. The
five key carbon cycle parameters provided offer finer underlying data support
for carbon sink estimation and dynamic ecosystem monitoring in the Greater Bay
Area.
Author
Contributions
You, J. K., Zhang, Y. H. and Wu, G. F. conceptualized the overall design
for dataset development. You, J. K. and Guo, S. X. collected and processed the
data. You, J. K. and Zhang, Y. H. designed the models and algorithms. Hu, Z. W.
and Wang, J. Z. conducted the data validation. You, J. K. and Zhang, Y. H.
wrote the data paper.
Conflicts
of Interest
The authors
declare no conflicts of interest.
References
[1]
Xue,
J. R., Su, B. F. Significant remote sensing vegetation indices: a review of
developments and applications [J]. Journal
of Sensors, 2017, 2017(1): 1353691.
[2]
Bannari,
A., Morin, D., Bonn, F., et al. A
review of vegetation indices [J]. Remote Sensing
Reviews, 1995, 13(1–2): 95–120.
[3]
Liu, Z. T., Wang, S. J., Fang, C. L. Spatiotemporal
evolution and influencing mechanism of ecosystem service value in the
Guangdong-Hong Kong-Macao Greater Bay Area [J]. Acta Geographica Sinica,
2023, 33(6): 1226–1244.
[4]
Pettorelli,
N., Vik, J. O., Mysterud, A., et al.
Using the satellite-derived NDVI to assess ecological responses to
environmental change [J]. Trends in
Ecology & Evolution, 2005, 20(9): 503–510.
[5]
Jiang,
Z. Y., Huete, A. R., Didan, K., et al.
Development of a two-band enhanced vegetation index without a blue band [J]. Remote Sensing of Environment, 2008,
112(10): 3833–3845.
[6]
Fang,
H. L., Baret, F., Plummer, S., et al.
An overview of global leaf area index (LAI): methods, products, validation, and
applications [J]. Reviews of Geophysics,
2019, 57(3): 739–799.
[7]
Liu, Y., Liu, R. G., Liu, L. Y., et al.
Current status and perspectives of Leaf Area Index retrieval from optical
remote sensing data [J]. Journal of Geo-Information Science, 2013,
15(5): 734–743.
[8]
Zhang,
Y. H., Fang, H. L., Wang, Y., et al.
Variation of intra-daily instantaneous FAPAR estimated from the geostationary
Himawari-8 AHI data [J]. Agricultural and
Forest Meteorology, 2021, 307: 108535.
[9]
Zhang,
Y. H., Hu, Z. W., Wang, J. Z., et al.
Temporal upscaling of MODIS instantaneous FAPAR improves forest gross primary
productivity (GPP) simulation [J]. International
Journal of Applied Earth Observation and Geoinformation, 2023, 121: 103360.
[10]
Zhang, X., Friedl, M. A., Schaaf, C. B., et al. Monitoring vegetation phenology
using MODIS [J]. Remote Sensing of
Environment, 2003, 84(3): 471–475.
[11]
Myneni, R. B., Hoffman, S., Knyazikhin, Y., et al. Global products of vegetation
leaf area and fraction absorbed PAR from year one of MODIS data [J]. Remote Sensing of Environment, 2002,
83(1–2): 214–231.
[12]
Liu, L., Zhang, Y. H., Hu, Z. W., et al.
MODIS global Leaf Area Index product reprocessing dataset (2001–2021) [J]. Journal
of Global Change Data & Discovery, 2023, 7(3): 242–251.
https://doi.org/10. 3974/geodp.2023.03.02.
[13]
Meraner,
A., Ebel, P., Zhu, X. X., et al.
Cloud removal in Sentinel-2 imagery using a deep residual neural network and
SAR-optical data fusion [J]. ISPRS
Journal of Photogrammetry and Remote Sensing, 2020, 166: 333–346.
[14]
Shen, H. F., Li, X. H., Cheng, Q., et al. Missing information
reconstruction of remote sensing data: a technical review [J]. IEEE Geoscience and Remote Sensing Magazine,
2015, 3(3): 61–85.
[15]
Zhu,
X. L., Cai, F. Y., Tian, J. Q., et al.
Spatiotemporal fusion of multisource remote sensing data: literature survey,
taxonomy, principles, applications, and future directions [J]. Remote Sensing, 2018, 10(4): 527.
[16]
Zhu,
X. L., Chen, J., Gao, F., et al. An
enhanced spatial and temporal adaptive reflectance fusion model for complex
heterogeneous regions [J]. Remote Sensing
of Environment, 2010, 114(11): 2610–2623.
[17]
Gao, F., Masek, J., Schwaller, M., et al. On the blending of the Landsat
and MODIS surface reflectance: predicting daily Landsat surface reflectance
[J]. IEEE Transactions on Geoscience and
Remote Sensing, 2006, 44(8): 2207–2218.
[18]
Zhu,
X. L., Helmer, E. H., Gao, F., et al.
A flexible spatiotemporal method for fusing satellite images with different
resolutions [J]. Remote Sensing of
Environment, 2016, 172: 165–177.
[19]
Shen,
H. F., Wu, J. A., Cheng, Q., et al. A
spatiotemporal fusion based cloud removal method for remote sensing images with
land cover changes [J]. IEEE Journal of
Selected Topics in Applied Earth Observations and Remote Sensing, 2019,
12(3): 862–874.
[20]
Emelyanova,
I. V., Mcvicar, T. R., van Niel, T. G.,
et al. Assessing the accuracy of blending Landsat– MODIS surface
reflectances in two landscapes with contrasting spatial and temporal dynamics:
a framework for algorithm selection [J]. Remote
Sensing of Environment, 2013, 133: 193–209.
[21]
Xiong, C., Wu, Z., Zeng, Z. Y., et al.
Spatiotemporal evolution of forest landscape pattern in Guangdong- Hong
Kong-Macao Greater Bay Area based on “Spatial Morphology-Fragmentation-Aggregation”
[J]. Acta Ecologica Sinica, 2023, 43: 3032–3044.
[22]
Chen, X., Wang, D. W., Chen, J., et al. The mixed pixel effect in land surface phenology: a
simulation study [J]. Remote Sensing of Environment, 2018,
211: 338–344.
[23]
Tao,
X., Liang, S. L., He, T., et al.
Estimation of fraction of absorbed photosynthetically active radiation from
multiple satellite data: model development and validation [J]. Remote Sensing of Environment, 2016,
184: 539–557.
[24]
Zheng, W. H., Hu, Z. W., Zhang, Y. H., et al. Spatiotemporal dynamic of
surface water bodies using dense Landsat time-series data in Guangdong-Hong
Kong-Macao Greater Bay Area from 1990 to 2020 [J]. Environmental Ecology,
2025, 7(1): 53–64.
[25]
Hu, Z.
W., Chu, Y. Q., Zhang, Y. H., et al.
Scale matters: How spatial resolution impacts remote sensing based urban green
space mapping? [J]. International Journal
of Applied Earth Observation and Geoinformation, 2024, 134: 104178.
[26]
Hsieh,
P. F., Lee, L. C., Chen, N. Y. Effect of spatial resolution on classification
errors of pure and mixed pixels in remote sensing [J]. IEEE Transactions on Geoscience and Remote Sensing, 2001, 39(12):
2657–2663.
[27]
Oropeza,
V., Sacchi, M. Simultaneous seismic data denoising and reconstruction via
multichannel singular spectrum analysis [J]. Geophysics, 2011, 76(3): V25–V32.
[28]
You,
J. K., Zhang, Y. H., Hu, Z. W., et al. 30-m raster dataset of key carbon
cycle parameters for terrestrial ecosystems in the Guangdong-Hong Kong-Macao
Greater Bay Area (2001–2025) [J/DB/OL]. Digital Journal of Global Change
Data Repository, 2026. https://doi.org/10.3974/geodb.2026.03.10.V1.
[29]
GCdataPR Editorial Office.
GCdataPR data sharing policy [OL]. https://doi.org/10.3974/dp.policy.2014.05
(Updated 2017).
[30]
Running,
S. W., Zhao, M. Daily GPP and annual NPP (MOD17A2/A3) products NASA Earth
Observing System MODIS land algorithm [J]. MOD17
User’s Guide, 2015, 2015: 1–28.
[31]
Huete,
A., Didan, K., Miura, T., et al.
Overview of the radiometric and biophysical performance of the MODIS vegetation
indices [J]. Remote Sensing of
Environment, 2002, 83(1): 195–213.
[32]
Sulla-Menashe, D., Gray, J. M., Abercrombie, S.
P., et al. Hierarchical mapping of
annual global land cover 2001 to present: the MODIS Collection 6 Land Cover
product [J]. Remote Sensing of
Environment, 2019, 222: 183–194.
[33]
Wulder,
M. A., Roy, D. P., Radeloff, V. C., et
al. Fifty years of Landsat science and impacts [J]. Remote Sensing of Environment, 2022, 280: 113195.
[34]
Onojeghuo,
A. O., Blackburn, G. A., Wang, Q. M., et
al. Rice crop phenology mapping at high spatial and temporal resolution
using downscaled MODIS time-series [J]. GIScience
& Remote Sensing, 2018, 55(5): 659–677.
[35]
Li, X.
Q., Peng, Q. Y., Shen, R. Q., et al.
Long-term reconstructed vegetation index dataset in China from fused MODIS and
Landsat data [J]. Scientific Data,
2025, 12(1): 152.
[36]
Holben, B. N. Characteristics of maximum-value composite
images from temporal AVHRR data [J]. International
Journal of Remote Sensing, 1986, 7(11): 1417–1434.