Yearly/250-m Raster Dataset Development of Ecosystem Quality Index
(EQI) of China (2007–2024)
QING Ao1,2*
1. Institute of Geographic Sciences and Natural Resources Research,
Chinese Academy of Sciences, Beijing 100101, China;
2. University of Chinese
Academy of Sciences, Beijing 100049, China
Abstract: The
Ecosystem Quality Index (EQI) serves as a critical indicator for characterizing
the structural integrity and functional status of ecosystems, holding
significant application value in ecological monitoring and territorial spatial
optimization. However, existing EQI datasets are often limited by either
insufficient temporal coverage or coarse spatial resolution. To address these
limitations, this study developed an annual 250-m resolution EQI dataset for
China spanning 2007–2024, following the Technical specification for
investigation and assessment of national ecological status—ecosystem quality assessment (HJ 1172—2021). Multi-source remote sensing products,
including Fractional Vegetation Cover (FVC), Leaf Area Index (LAI), and Gross
Primary Productivity (GPP), were integrated to construct the dataset. The
dataset is archived in .tif format. It comprises 54 data files with a total
volume of 31.3 GB (compressed into 9 files, 6.55 GB). The results indicate that
China’s EQI exhibited a significant
overall increasing trend from 2007 to 2024. Spatially, relatively high EQI
values were primarily observed in southern and southwestern China, whereas
lower values were concentrated in northwestern China and certain alpine
regions. This dataset supported the completion of the author’s
Master degree of Engineering thesis.
Keywords: Ecosystem Quality Index (EQI); Fractional Vegetation
Cover (FVC); Leaf Area Index (LAI); Gross Primary Productivity (GPP); Master degree of Engineering thesis
DOI: https://doi.org/10.3974/geodp.2026.04.03
Dataset Availability Statement:
The dataset
supporting this paper was published and is accessible through the Digital Journal of Global Change Data
Repository at:
https://doi.org/10.3974/geodb.2026.03.02.V1.
1 Introduction
Ecosystem quality is an important measure of the structural integrity
and functional status of regional ecosystems, and its variation is directly
related to ecological security and sustainable
development capacity. With China’s ongoing efforts to achieve its “dual-carbon”
goals and promote territorial spatial optimization, high-resolution and
long-term assessments
of
ecosystem quality have become increasingly important for ecological management
and environmental decision-making. Existing studies have frequently relied on
single indicators, such as Normalized Difference Vegetation Index (NDVI) or
Gross Primary Productivity (GPP), to evaluate ecosystem conditions. However,
these indicators often fail to comprehensively capture both the structural and
functional characteristics of ecosystems[1–4]. In addition, existing
ecosystem quality datasets are generally constrained by limited temporal
continuity or insufficient spatial resolution, restricting their applicability
in long-term ecological monitoring and large-scale environmental assessments[5,6].
To address these
limitations, the Ministry of Ecology and Environment of P. R. China issued the Technical
specification for investigation and assessment of national ecological status—ecosystem
quality assessment (HJ 1172—2021)[7], which proposes the Ecosystem
Quality Index (EQI) based on Fractional Vegetation Cover (FVC), Leaf Area Index
(LAI), and Gross Primary Productivity (GPP). Through the integration of
multiple indicators, this approach provides a more comprehensive representation
of ecosystem structural characteristics and ecological functioning. In this
context, utilizing multi-source remote sensing data, this study developed a
250-m resolution EQI dataset for China covering the period from 2007 to 2024,
aiming to provide a unified and standardized data foundation for investigating
long-term spatiotemporal dynamics of ecosystem quality.
2 Metadata of the Dataset
The metadata of Yearly/250-m
raster dataset of Ecosystem Quality Index (EQI) of China (2007–2024)[8] is summarized in Table 1. It includes the dataset full name,
short name, authors, year of the dataset, temporal resolution, spatial
resolution, data format, data size, data files, data publisher, and data
sharing policy, etc.
Table 1 Metadata
summary of the Yearly/250-m raster dataset of Ecosystem Quality Index (EQI) of
China (2007–2024)
|
Items
|
Description
|
|
Dataset full name
|
Yearly/250-m raster dataset of Ecosystem
Quality Index (EQI) of China (2007–2024)
|
|
Dataset short name
|
eqi_2007_2024
|
|
Author
|
Qing, A., Institute of Geographic Sciences and
Natural Resources Research, Chinese Academy of Sciences,
qingao23@mails.ucas.ac.cn
|
|
Geographical region
|
China
|
|
Year
|
2007–2024
|
|
Temporal resolution
|
Year
|
|
Spatial resolution
|
250 m
|
|
Data format
|
.tif
|
|
|
|
Data size
|
6.55 GB (compressed)
|
|
|
|
Data files
|
Annual EQI raster data from 2007 to 2024
|
|
Data publisher
|
Global Change
Research Data Publishing & Repository, http://www.geodoi.ac.cn
|
|
Address
|
No. 11A, Datun Road, Chaoyang District,
Beijing 100101, China
|
|
Data sharing policy
|
(1) Data are openly available and can be free downloaded via the
Internet; (2) End users are encouraged to use Data subject to citation; (3) Users, who are by definition also
value-added service providers, are welcome to redistribute Data subject to written permission
from the GCdataPR Editorial Office and the issuance of a Data redistribution license; and (4) If Data are used to compile new datasets, the “ten percent principle”
should be followed such that Data
records utilized should not surpass 10% of the new dataset contents, while
sources should be clearly noted in suitable places in the new dataset[9]
|
|
Communication and
searchable system
|
DOI, CSTR, Crossref, DCI, CSCD, CNKI,
SciEngine, WDS, GEOSS, PubScholar, CKRSC, OARL
|
3 Methods
3.1 Algorithm
The Ecosystem Quality Index (EQI) is used to
comprehensively characterize the structural and functional status of regional
ecosystems and serves as an important indicator of overall ecosystem quality.
According to the HJ 1172—2021, ecosystem quality assessment is based on 3 key
remote sensing indicators, namely FVC, LAI, and GPP, and achieves a
quantitative characterization of ecosystem quality through a multi-indicator
integrated approach. In this study, raster grids with a spatial resolution of
250 m were adopted as the fundamental assessment units. An automated processing
workflow was developed using Python to enable batch calculations of EQI,
resulting in the generation of an annual 250-m resolution EQI dataset for China
covering the period from 2007 to 2024.
(1) Data
acquisition and indicator system construction
Multi-source remote sensing datasets of FVC,
LAI, and GPP were collected to establish the indicator system for ecosystem
quality assessment. FVC represents the proportion of the vertically projected
area of components, including leaves, stems, and branches, relative to the
total area of a statistical unit, primarily reflecting the horizontal
structural characteristics of vegetation. LAI is defined as the ratio of total
leaf area to unit ground area and is widely used to characterize the complexity
of vegetation vertical structure. GPP refers to the total amount of organic
carbon fixed through photosynthesis by green plants per unit area and unit time
and mainly reflects vegetation photosynthetic activity and ecosystem
productivity. Regarding data sources, the FVC dataset with a spatial resolution
of 250 m was obtained from the National Tibetan Plateau Data Center. The LAI dataset (250 m)
and GPP dataset (500 m) were derived from the Global Land Surface Satellite
(GLASS) products.
(2) Data
preprocessing
Systematic preprocessing procedures were
conducted for all multi-source remote sensing datasets prior to EQI
calculation. First, data completeness checks were conducted to identify missing
values, which were then supplemented. At the same time, abnormal values were
removed and scale conversions were performed to minimize uncertainties
associated with remote sensing retrieval errors. Second, annual maximum
composite values were generated at the pixel scale based on the original
time-series data. Subsequently, raster tiles were mosaicked and clipped using
the national boundary of China to produce spatially continuous datasets
covering the entire study area.
(3) Spatial
consistency processing
Because the FVC, LAI, and GPP datasets
differed in spatial resolution and projection system, spatial consistency
processing was required prior to index calculation. Using the FVC dataset as
the reference, the LAI and GPP datasets were reprojected and resampled to
ensure consistency in coordinate reference system, spatial resolution (250 m),
and spatial extent among all datasets.
To eliminate differences in measurement units
and value ranges among indicators, the Min-Max normalization method recommended
in HJ 1172—2021 was applied:
 (1)
(1)
where  is the
original indicator value,
is the
original indicator value,  and
and  are the minimum and maximum values of the indicator within
the study area, and
are the minimum and maximum values of the indicator within
the study area, and  is the normalized value. Following
normalization, all indicators were transformed to a standardized range of 0–1,
thereby improving comparability among variables and facilitating subsequent
integration into the EQI framework.
is the normalized value. Following
normalization, all indicators were transformed to a standardized range of 0–1,
thereby improving comparability among variables and facilitating subsequent
integration into the EQI framework.
(4) Calculation of
the Ecosystem Quality Index
Following data preprocessing and indicator
standardization, the Ecosystem Quality Index was constructed in accordance with
the methodology specified in HJ 1172—2021. EQI was calculated at the pixel
scale as follows:
 (2)
(2)
where  is the EQI of pixel
  ,
,  is the normalized Fractional Vegetation Cover of pixel ,
  and
and  are the
normalized Leaf Area Index and Gross Primary Productivity of pixel , respectively.
are the
normalized Leaf Area Index and Gross Primary Productivity of pixel , respectively.
3.2 Technical Route
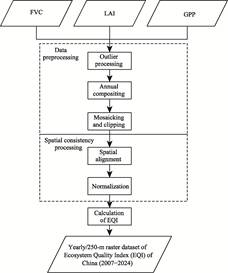
Figure 1 outlines the dataset workflow. LAI,
GPP, and FVC are acquired, checked for completeness and outliers. Annual
maximum composites and spatial mosaicking/cropping generate baseline data.
Multi-source data are then unified in projection, resolution, and extent, and
normalized. Finally, EQI is calculated per HJ 1172—2021 to produce the 250-m
annual China EQI dataset (2007–2024).
Figure
1 Flowchart
of the dataset development
4 Data Results
4.1 Dataset Composition
The Yearly/250-m raster dataset
of Ecosystem Quality Index (EQI) of China (2007–2024) covers the entire
territory of China and is archived in .tif format. Pixel values range from 0 to
100, with higher values indicating better ecosystem quality. The dataset has an
annual temporal resolution and includes annual EQI raster products from 2007 to
2024. In total, the dataset comprises 54 data files, which are compressed into
9 archive files to facilitate data storage.
4.2 Data Products
4.2.1 Temporal
Characteristics of the EQI of China
From 2007 to 2024, the EQI of
China exhibited a stable and significant increasing trend over time (Figure 2a).
Linear regression analysis yielded a slope of 0.193 per year, indicating a
steady increase in ecosystem quality throughout the study period. The
coefficient of determination (R2) was 0.739, suggesting that
the temporal variable explained approximately 73.9% of the interannual
variation in EQI, and the trend showed strong consistency. Furthermore, the
trend was highly significant (p = 4.87×10⁻⁶), confirming a
statistically robust increase in ecosystem quality over time. To further
characterize temporal variations in the distribution of EQI, annual boxplots
were constructed using raster data from 2007 to 2024 (Figure 2b). The results
show a gradual increase in the median EQI throughout the study period,
consistent with the trend observed for the mean value. This finding indicates
that ecosystem quality improved not only at the average level but also across
the overall distribution.
Regarding distributional variability, the interquartile
range (P25–P75) exhibited only minor fluctuations over time, and its width
remained generally stable throughout the study period. This suggests that
interannual changes in EQI were primarily manifested as an overall upward shift
in ecosystem quality rather than substantial changes in distributional
dispersion. Overall, the EQI dataset showed a significant, stable, and
low-volatility increasing trend from 2007 to 2024. The strong temporal
consistency observed in the dataset highlights its suitability for long-term
ecological monitoring, trend detection, and ecosystem change assessment.
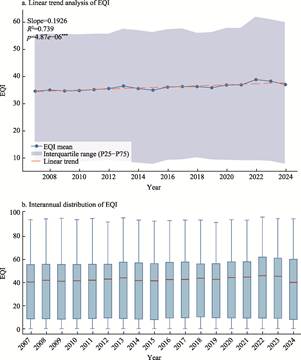
Figure 2 Temporal characteristics of the EQI of
China (2007–2024)
4.2.2 Spatial
Characteristics of the EQI of China
From the perspective of spatial distribution,
the EQI in China in 2024 exhibited pronounced regional heterogeneity (Figure 3).
Overall, higher EQI values were concentrated in southern and southwestern China, whereas lower values
were predominantly observed in northwestern and certain high-altitude regions.
Central and eastern China showed evident transitional characteristics, while
parts of northeastern China formed localized high-value clusters. To further
characterize the interprovincial spatial pattern of EQI in 2024, the mean EQI
values were calculated and ranked for each province (Figure 4). Across 34
provinces of China, the mean EQI was 50.22, with a standard deviation of 16.28,
a coefficient of variation of 32.42%, and a range of 59.75, indicating
substantial spatial heterogeneity at the provincial scale.
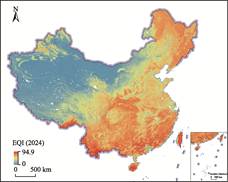
Figure 3 Spatial distribution map of the EQI of
China (2024)
At the provincial level, high-value regions
were primarily concentrated in southern and southwestern China, where
ecological background conditions are relatively favorable. The top-ranked
provinces in terms of mean EQI were Hainan (70.49), Taiwan (70.24), Fujian
(68.41), Guangxi (68.38), and Yunnan (66.36). In Hainan, pixels in the 60–80
and 80–100 classes accounted for 48.33% and 30.54%, respectively, indicating a
clear dominance of high-value areas. In Taiwan, pixels in the 80–100 interval
accounted for 45.78%, showing a marked concentration of high-value areas. In
Fujian and Guangxi, the proportions of pixels in the 60–80 interval reached
71.10% and 66.92%, respectively, further indicating a pronounced clustering of
high EQI values. Overall, southern and southwestern China formed a spatially
continuous belt of high EQI values, indicating relatively high ecosystem
quality in these regions.
In contrast, low-value areas were mainly
distributed in northwestern China and certain high-altitude regions. Provinces
with relatively low mean EQI included Xinjiang (10.74), Xizang (18.04), Qinghai
(20.66), Gansu (23.57), and Ningxia (25.97). Among them, pixels in the 0–20
class accounted for 82.60% in Xinjiang and 69.41% in Xizang, while
corresponding proportions were 55.28% in Qinghai and 54.81% in Gansu,
indicating a clear dominance of low-value pixels and generally poor ecosystem
quality. In Ningxia, the proportion of pixels in the 0–20 class reached 45.18%.
Inner Mongolia had a mean EQI of 31.83, with 35.79% of pixels falling within
the 0–20 class, further indicating that arid, semi-arid, and alpine regions in Northern
China are predominantly characterized by low to moderately low EQI levels.
Notably,
central and eastern China exhibited clear transitional characteristics. For
example, the mean EQI values of Hubei, Anhui, Liaoning, and Henan were 57.84,
55.68, 56.22, and 54.26, respectively, placing them at a moderately high level
nationwide. Their pixel distributions were mainly distributed in the 40–60 and
60–80 classes. In addition, within northeastern China, Heilongjiang (61.39) and
Jilin (59.34) showed relatively high
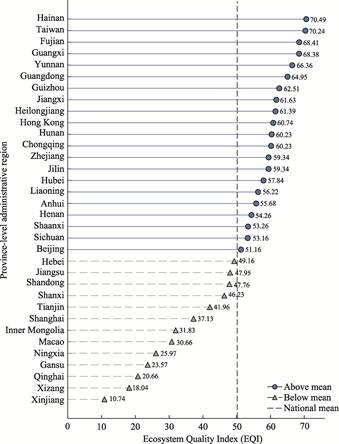
Figure 4 Interprovincial differences
in the EQI of China (2024)
EQI levels, indicating that parts of
northeastern China constitute another distinct high-value region,
differentiated from the low-value zones in northwestern China.
4.2.3 Distribution
Structure Analysis of China’s EQI
To characterize the overall distribution
structure of the EQI in China in 2024, this study constructed the probability
density function (PDF) and cumulative distribution function (CDF) based on
raster pixel values (Figure 5). The results show that EQI values in 2024 ranged
from 0.00 to 94.90, with a mean of 36.95, a median of approximately 39.93, a
standard deviation of 25.78, and first and third quartiles (P25 and P75) of
7.89 and 59.87, respectively. Overall, the EQI distribution spanned a wide
range, indicating pronounced spatial heterogeneity in ecosystem quality across
China.
From the perspective of the probability
density distribution, EQI did not follow a simple unimodal normal distribution.
Instead, it exhibited a pattern characterized by a pronounced concentration in
the low-value range alongside a broad spread across medium-to-high values.
Binned statistics show that approximately 27.55% of pixels fell within the 0–10
interval, indicating that low-value pixels accounted for a considerable
proportion nationwide. Meanwhile, about 48.15% of pixels were distributed
within the 40–80 interval, among which the 40–60 and 60–80 intervals accounted
for 25.14% and 23.01%, respectively. This suggests that the EQI distribution in
China is primarily concentrated in the medium to moderately high range, despite
the presence of a substantial low-value component.
From the cumulative distribution function,
the CDF curve rose rapidly in the low-value range, continued to increase
steadily in the medium-value range, and gradually flattened in the high-value
range. Quantitatively, approximately 75.21% of pixels had EQI values not
exceeding 60, about 90.16% did not exceed 70, and about 98.21% did not exceed
80, whereas only 1.79% of pixels fell within the 80–100 interval. This
indicates that although high-EQI areas exist in localized regions, their
spatial extent is limited, and high values primarily constitute the upper tail
of the overall distribution.
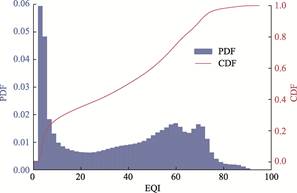
Figure 5
Probability density function and cumulative distribution function of the
EQI of China (2024)
5 Discussion and Conclusion
Based on the HJ 1172—2021,
this study developed a 250 m resolution dataset of the EQI for China
(2007–2024) by integrating multi-source remote sensing data, including FVC,
LAI, and GPP. This dataset covers the period from 2007 to 2024 and spatially
encompasses the entire territory of China, enabling continuous characterization
of spatiotemporal dynamics in ecosystem quality at a national scale. In the
temporal dimension, the national mean EQI exhibited a stable upward trend
during 2007–2024. The interannual median showed a consistent increase, while
the interquartile range remained relatively stable, indicating overall temporal
consistency and robustness of the dataset. In the spatial dimension, EQI
exhibited a persistent pattern characterized by relatively high values in
southern and southwestern China, lower values in northwestern China and certain
high-altitude regions, and transitional zones across central and eastern China.
Pronounced interprovincial heterogeneity was also evident. In terms of distribution
structure, EQI demonstrated a combined pattern of strong concentration in
low-value regions and wide dispersion across medium-to-high value ranges,
reflecting substantial spatial heterogeneity in ecosystem quality across China.
Overall, this dataset provides a standardized, long-term, and high-resolution
representation of ecosystem quality dynamics in China. It can serve as a
fundamental basis for continuous monitoring of ecosystem conditions,
identification of regional disparities, assessment of ecological conservation
and restoration outcomes, and support for territorial spatial planning and
environmental decision-making.
Despite these strengths, several limitations remain.
First, the construction of EQI relies on remote sensing inputs such as FVC,
LAI, and GPP, and its accuracy is influenced by uncertainties in the original
datasets, as well as preprocessing steps including gap filling, resampling, and
cross-scale harmonization. Error propagation across multi-source data
integration may therefore introduce uncertainty into the final results. Second,
the dataset is currently constructed at an annual scale, which is suitable for
long-term trend analysis and large-scale spatial pattern characterization, but
is less capable of capturing seasonal dynamics and short-term variability.
Third, due to the limited availability of comparable national-scale EQI
products, external validation and inter-product benchmarking remain
constrained. Future research could further improve the dataset in 2 respects.
First, extending the dataset to seasonal or sub-annual scales would enable a
more detailed characterization of ecosystem dynamics. Second, integrating
additional independent observations would support more comprehensive validation
and regional applicability assessments. This dataset supported the completion
of the author’s Master degree of Engineering thesis, under the guidance of Associate Professor HAN Mengyao.
Acknowledgements
I am deeply grateful to my supervisor, Associate Professor Han, M. Y.,
for her invaluable guidance and support during the writing of this thesis.
Conflicts of Interest
The authors
declare no conflicts of interest.
References
[1]
Huang, S, Tang, L. N., Hupy, J.
P., et al. A commentary review on the use of normalized difference
vegetation index (NDVI) in the era of popular remote sensing [J]. Journal of
Forestry Research, 2021, 32(1): 1–6.
[2]
Liao, Z. Z., Zhou, B. H., Zhu, J. Y., et al. A critical
review of methods, principles and progress for estimating the gross primary
productivity of terrestrial ecosystems [J]. Frontiers in Environmental
Science, 2023, 11: 1093095.
[3]
Cui, L. L., Chen, Y. H., Yuan,
Y., et al. Comprehensive evaluation system for vegetation ecological
quality: a case study of Sichuan ecological protection redline areas [J]. Frontiers
in Plant Science, 2023, 14.
[4]
Liu, P., Ren, C. Y., Yu, W. S.,
et al. Exploring the ecological quality and its drivers based on annual
remote sensing ecological index and multisource data in Northeast China [J]. Ecological
Indicators, 2023, 154: 110589.
[5]
Wang, J. B., Chen, X., Ouyang,
X. H., et al. A dataset of ecological quality indexes of terrestrial
eco-systems in China from 2000 to 2018 [J]. China Scientific Data, 2023,
8(3).
[6]
Liu, H. M., Lu, J. Y., Li, X. C., et al. Evaluating
human-nature relationships at a grid scale in China, 2000–2020 [J]. Habitat
International, 2025, 156: 103282.
[7]
Ministry of Ecology and
Environment of P. R. China. Technical specification for investigation and
assessment of national ecological status——ecosystem quality assessment (HJ
1172—2021) [S]. Beijing: Standards Press of China, 2021.
[8]
Qing, A. Yearly/250-m raster dataset of Ecosystem Quality Index (EQI)
of China (2007–2024) [J/DB/OL]. Digital Journal of Global Change Data Repository, 2026.
https://doi.org/10.3974/geodb.2026.03.02.V1.
[9]
GCdataPR Editorial Office. GCdataPR data sharing policy [OL].
https://doi.org/10.3974/dp.policy.2014.05 (Updated 2017).