LIU Rong1,2 WANG Zhenbo1*
1. Institute of Geographic Sciences and Natural
Resources Research, Chinese Academy of Sciences, Beijing 100101, China;
2. University
of Chinese Academy of Sciences, Beijing 100049, China
Abstract: We constructed a dataset of industrial Green Total Factor
Productivity (GTFP) and environmental constraint drag indices for 25 core riverside
cities along the Yangtze River Economic Belt (YREB), covering the period from
2000 to 2022. Based on the directional distance function (DDF) and the global
Malmquist-Luenberger (GML) index, we employ a
three-tier progressive measurement system to isolate environmental constraint
effects: baseline TFP (excluding water environment variables),
water-constrained GTFPw (incorporating industrial water inputs and
water pollution emissions), and water-energy
dual-constrained GTFPwe (incorporating industrial electricity
inputs). All three tiers share identical directional vectors, global production
technology frontiers, and returns-to-scale specifications, differing only in
terms of their input-output variable sets. Consequently, the differences
between cumulative productivity indices exclusively reflect changes in these
variable sets. Based on this, we constructed 2 constraint drag indices: the Water
Environment Drag Index (WEDI), which quantifies the deviations in productivity
growth trajectory attributable to water-environment constraints, and the Energy
Consumption Drag Index (ECDI), which measures the drag effect associated with
energy consumption beyond water constraints. The dataset comprises 575 records
(25 cities×23 years) encompassing 6 core variables: GTFP and its decomposition
indices (Technical Change index (TC); Efficiency Change index (EC)), cumulative
productivity indices, WEDI, and ECDI. Empirical calculations reveal that
basin-wide GTFPwe
increased at an average annual rate of 1.80%, with technical progress as the
primary driver of industrial green transformation. WEDI exhibited a distinct
inverted U-shaped evolution, peaking at 0.074 in 2012 before fluctuating
downward. Its 3-year rolling average became negative in the 2018–2020 window, with the “green crossing”
firmly established at the turn of 2020–2021,
indicating a shift in regional water governance from a “drag period” to a
“dividend period”. Urban heterogeneity was prominent: during 2020–2022, WEDI turned negative in 17 cities and
remained positive in 8. The dataset comprises: (1) industrial GTFP and drag
index data under baseline, water-constrained, and water-energy dual-constrained specifications; (2) spatial
information for the 25 cities; and (3) the input-output panel data used for the
calculations. The dataset is archived in .xlsx format, and consists of one file
with data size of 214 KB. This dataset supported the first author’s doctoral
thesis in Science.
Keywords: industrial Green Total Factor
Productivity; Yangtze River Economic Belt; Global Malmquist- Luenberger index;
Water Environment Drag Index; Energy Consumption Drag Index; doctoral thesis in Science
DOI: https://doi.org/10.3974/geodp.2026.05.03
Dataset Availability Statement:
The dataset
supporting this paper was published and is accessible through the Digital Journal of
Global Change Data Repository at: https://doi.org/10.3974/geodb.2026.04.08.V1.
1 Introduction
Industrial Green Total Factor
Productivity (GTFP) is a key indicator for evaluating the efficiency of
industrial green transformation. By incorporating resource consumption and
environmental pollution into the production function, the GTFP effectively
distinguishes “genuine economic growth” from “environmental overdraft”[1,2].
Since the implementation of the strategy of “stepping up conservation of the
Yangtze River and stopping its over development” in 2016, core riverside cities
within the Yangtze River Economic Belt (YREB) have faced increasingly stringent
environmental regulations. Consequently, the scientific measurement of
industrial green transformation efficiency has become a critical requirement
for policy evaluation and path optimization[3,4]. Existing GTFP
measurement methodologies can be categorized primarily into the data
envelopment analysis (DEA) and stochastic frontier analysis (SFA) paradigms[5–8],
and have produced several regional or sectoral GTFP datasets. Research using
these approaches has established an important foundation for understanding
industrial green growth.
However, from the
perspective of supporting the strategic evaluation of “stepping up conservation”
along the YREB, existing datasets present 3 main limitations.
First, constraint
effects are insufficiently isolated. Most studies concurrently incorporate
multiple environmental constraints (e.g., water pollution, air pollution, and
carbon emissions) into a single composite model[7,8]. The resulting
GTFP thus captures an aggregated effect of all constraints, making it
impossible to isolate the marginal contribution of individual constraints.
Consequently, core policy questions remain unaddressed, such as “How large is
the productivity drag exclusively caused by water pollution constraints?” or
“Which cities have successfully converted water governance costs into
efficiency dividends?”
Second, basin
characteristics are inadequately characterized. The YREB is a representative
water-sensitive basin where water pollution control is the priority task under
the overarching protection strategy. However, existing datasets primarily focus
on carbon emissions or air pollutants as undesirable outputs and lack
measurements and index formulations tailored to water-environment constraints.
Third, the coverage
of policy cycles is incomplete. Most datasets only cover post-2010 periods,
failing to capture the full policy evolution cycle since 2000, which ranges
from the extensive growth during the 10th Five-Year Plan, to energy
conservation during the 11th and 12th Plans, and finally to comprehensive basin
protection during the 13th and 14th Plans. This limitation precludes the
identification of long-term trends, structural inflection points, and policy
lag dynamics.
To address these challenges, the present study
constructed the Dataset of industrial Green Total Factor Productivity and Water
Environment Drag Index for core riverside cities in the Yangtze River Economic
Belt (2000–2022)[9]. Utilizing a directional distance function (DDF)
and global Malmquist-Luenberger (GML) index framework, we employed a three-tier
progressive measurement system to isolate environmental constraint effects:
Tier 1 baseline TFP excludes water environment variables; Tier 2
water-constrained GTFPw incorporates industrial water inputs and
water pollution emissions; and Tier 3 water-energy dual-constrained GTFPwe
further incorporates industrial energy inputs. By calculating cumulative index
differencing across these tiers, the dataset provides 2 drag indices: the Water
Environment Drag Index (WEDI), which quantifies the net productivity effect of
water environment constraint, and the Energy Consumption Drag Index (ECDI),
which measures the additional effect of energy inputs superimposed on water
constraints.
The key
innovations of this dataset include: isolating constraint effects via model
structural differencing rather than regression controls, thereby avoiding
multicollinearity issues; proposing the novel WEDI metric to quantify the
independent productivity drag of water pollution and map city-level transitions
from “compliance cost periods” to “regulatory dividend periods”; capturing
complete policy dynamics across a 23-year longitudinal series, revealing an
inverted U-shaped trajectory of WEDI and identifying the turn of 2020–2021 as a
critical inflection point for green industrial transformation in the YREB.
2 Metadata of the Dataset
The metadata of the Dataset of industrial
Green Total Factor Productivity and Water Environment Drag Index for core riverside
cities in the Yangtze River Economic Belt (2000–2022)[9] including
the dataset name, authors, geographic region, year of the dataset, data format,
data size, data files, data publisher, are summarized in Table 1.
Table 1 Metadata summary of the
Dataset of industrial Green Total Factor Productivity
and Water Environment Drag Index for core riverside cities in the Yangtze River
Economic Belt (2000–2022)
|
Items
|
Description
|
|
Dataset full name
|
Dataset of industrial Green Total Factor Productivity
and Water Environment Drag Index for core riverside cities in the Yangtze
River Economic Belt (2000–2022)
|
|
Dataset short name
|
Ind.GTFP_YREB_2000-2022
|
|
Authors
|
Liu, R., Institute of Geographic Sciences and Natural
Resources Research, CAS; University of Chinese Academy of Sciences,
liur.20b@igsnrr.ac.cn
Wang, Z. B., Institute of Geographic Sciences and
Natural Resources Research, CAS, wangzb@igsnrr.ac.cn
|
|
Geographical region
|
25 core riverside cities along the YREB: 3 upstream
cities (Chongqing, Luzhou, and Yibin); 9 midstream cities (Jiujiang, Wuhan,
Huangshi, Yichang, Ezhou, Jingzhou, Huanggang, Xianning, and Yueyang); 13
downstream cities (Shanghai, Nanjing, Suzhou, Wuxi, Nantong, Yangzhou,
Zhenjiang, Taizhou, Wuhu, Ma’anshan, Tongling, Anqing, and Chizhou)
|
|
Year
|
2000–2022
|
|
Temporal resolution
|
Year
|
|
Data format
|
.xlsx
|
|
|
|
Data size
|
214 KB
|
|
|
|
Data files
|
Industrial GTFP and drag index data for 25 core
cities; spatial information for 25 core cities; raw input-output panel data
used for the calculations
|
|
Computing environment
|
Stata 18, Python 3.9
|
|
Data publisher
|
Global Change
Research Data Publishing & Repository, http://www.geodoi.ac.cn
|
|
Address
|
No. 11A, Datun Road, Chaoyang District,
Beijing 100101, China
|
|
Data sharing policy
|
(1) Data
are openly available and can be free downloaded via the Internet; (2) End
users are encouraged to use Data
subject to citation; (3) Users, who are by definition also value-added
service providers, are welcome to redistribute Data subject to written permission from the GCdataPR Editorial
Office and the issuance of a Data
redistribution license; and (4) If Data
are used to compile new datasets, the “ten percent principle” should be
followed such that Data records
utilized should not surpass 10% of the new dataset contents, while sources
should be clearly noted in suitable places in the new dataset[10]
|
|
Communication
and searchable system
|
DOI, CSTR, Crossref, DCI,
CSCD, CNKI, SciEngine, WDS, GEOSS, PubScholar, CKRSC, OARL
|
3 Methods
3.1
Data Sources and Preprocessing
This study used a panel dataset of 25 core riverside
cities along the YREB, spanning from 2000–2022, comprising 575 items (25 cities×23 years). Raw data were primarily
extracted from the China City Statistical Yearbook (2001–2023) and local
municipal statistical bulletins. The key indicators encompass 3 dimensions.
Basic input variables
(included in Tiers 1–3): Labor input, year-end number of industrial employees
(104 persons); capital input, net value of industrial fixed assets
(108 CNY), calculated at 2000 constant
prices using the perpetual inventory method; intermediate input, operating
costs (108 CNY), deflated to 2000 constant prices using provincial
industrial producer price indices (PPIs).
Resource input variables (progressively
incorporated): Water resource input, industrial water consumption (104
tons), incorporated in Tier 2 (GTFPw) and Tier 3 (GTFPwe).
Energy input, industrial electricity consumption (108 kWh),
incorporated only in Tier 3 (GTFPwe). Industrial electricity
accounts for approximately 30% of the total terminal industrial energy
consumption in the YREB. Backed by abundant hydropower generation (e.g., the
Three Gorges Dam and the Jinsha River cascade hydropower stations), electricity
is the predominant form of clean energy in the regional industrial sector. A
comparison of GTFPw and GTFPwe reveals whether cities
incurred excessive energy costs when complying with water pollution
regulations.
Output variables: desirable output, gross
industrial output value (108 CNY),
calculated at 2000 constant prices; undesirable outputs, industrial wastewater
discharge (104 tons) and industrial chemical oxygen demand (COD)
emissions (tons), incorporated in Tiers 2 and 3.
The collected data were preprocessed,
including missing value imputation: linear interpolation was used for rare
missing values (<2% of total sample); outlier screening: the 3σ
rule was applied to identify
extreme outliers, which were replaced by linear interpolation from adjacent
years (<1% of total sample); price deflation: all nominal monetary values
were converted to real terms using provincial PPI series, with 2000 as the base
year.
3.2 Algorithm
3.2.1 Three-Tier
Progressive Measurement Framework
A three-tier progressive measurement
framework was established to isolate environmental constraint effects within a
unified DDF framework. All three tiers share a global production technology
frontier constructed from the pooled 575 observations. Cumulative index
differencing was employed to isolate the marginal effects of each constraint
(Table 2).
All
three tiers share identical command configurations, directional vectors, global
Table
2 Structure of the three-tier progressive
measurement system
|
Tier
|
Efficiency indicator
|
Input variables
|
Desirable output
|
Undesirable outputs
|
|
Tier 1
|
Baseline TFP
|
Labor,
capital, intermediate inputs
|
Gross industrial
output
|
Placeholder constant
|
|
Tier 2
|
GTFPw
|
Labor, capital,
intermediate
inputs, industrial water
|
Gross
industrial output
|
Industrial wastewater, COD
|
|
Tier 3
|
GTFPwe
|
Labor, capital,
intermediate
inputs, industrial water,
industrial electricity
|
Gross
industrial output
|
Industrial wastewater,
COD
|
Note: Bold text
highlights variables newly added or substituted at each tier. Tier 1 excludes
water environment variables; however, the DDF specification requires non-empty
dimension definitions. To maintain computational homogeneity across all tiers,
a placeholder constant was introduced into the undesirable output set,
identical across all decision-making units (DMUs) and thereby conveying zero
cross-sectional variation.
production technology
specifications, and constant returns to scale (CRS) assumptions, and differ
exclusively in their variable sets. Tier 1 (baseline TFP) serves as a benchmark
containing no environmental information. Tier 2 (GTFPw) incorporates
industrial water consumption and water pollutant emissions to measure green
efficiency under water constraints. Tier 3 (GTFPwe) adds energy
inputs to evaluate efficiency under dual water- energy constraints. Accordingly,
moving from Tier 1 to Tier 2 adds industrial water to the inputs and replaces
the placeholder constant in the undesirable outputs with 2 actual emissions,
whereas moving from Tier 2 to Tier 3 is a pure addition on the input side. The
marginal effect of each constraint is thus identified by differencing the
cumulative indices: WEDI is the difference between the cumulative TFP and GTFPw
indices, and ECDI is the difference between the cumulative GTFPw and
GTFPwe indices. Sequential decomposition depends on the order of
inclusion; water is prioritized because water pollution governance represents
the primary constraint on industrial transformation along the Yangtze River.
3.2.2 Global Malmquist-Luenberger (GML) Index Model
To facilitate
dynamic cross-period comparisons under desirable and undesirable outputs, this
study adopted the DDF and Malmquist-Luenberger (ML) index
framework proposed by Chung, et al.[11], integrated with Oh’s[12]
global production technology approach. Computations were performed using the
gtfpch command in Stata[13].
Let the
input vector be  , the desirable output vector be
 , and the undesirable output vector be
 . The global production possibility set PG (x) is
defined as:
 (1)
This set strictly
satisfies the weak disposability assumption of undesirable outputs (that
reducing pollution requires sacrificing desirable outputs) and the
null-jointness assumption (that pollution is an inevitable byproduct of
production). The global frontier utilizes data from all sample periods as a
unified reference, avoiding linear programming infeasibility and “spurious
technical regress”.
The global directional output
distance function is formulated as:
 (2)
where g=(gy,
gb) is the directional
vector, and  represents
the maximum proportional expansion of desirable outputs and the contraction of
undesirable outputs along this vector. In this study, the directional vector is
specified as
 . With factor inputs held constant, desirable outputs
expand proportionally according to their own scale, while undesirable outputs
contract proportionally. This formulation inherently aligns with the core
imperative of China’s industrial green transformation: to synergistically
advance economic efficiency growth and pollution reduction without incurring
additional factor resource consumption. The corresponding linear programming
model is formulated as follows:
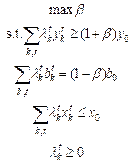
where  is the
intensity variable, and x0, y0, and b0
denote the inputs and outputs of the DMU under evaluation. Undesirable output
constraints are subject to strict equality constraints to reflect weak
disposability. No summation constraint (
 ) is imposed,
conforming to constant returns to scale (CRS). The GML index from period t
to t+1 is defined as:
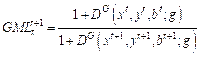 (3)
GML>1
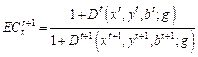
denotes GTFP growth, while GML<1 denotes decline. The GML index is
multiplicatively decomposed into technical EC and TC:
 (4)
 (5)
 (6)
where  denotes the DDF benchmarked against contemporaneous
production technology in period t. An index value of EC>1 indicates
that actual production is approaching the contemporaneous frontier,
representing an “efficiency catch-up effect” driven by managerial and
allocative optimization; TC>1 signifies an outward shift of the contemporaneous
technology frontier toward the global frontier, reflecting a “frontier
expansion effect” driven by green technological innovation. Because the
decomposition of EC and TC relies on contemporaneous technology as a
reference—in which each annual reference set contains only 25 Decision- Making
Units (DMUs)—its discriminatory resolution is inherently lower than that of the
global technology framework benchmarked across all pooled observations.
Consequently, these decomposed components are primarily suitable for evaluating
longitudinal trends.
3.2.3 Construction of Derived Drag Indices
(1) Cumulative Productivity
Index
Taking 2000 as the base year (=1), cumulative indices
are constructed by sequential multiplication of the GML index (where GMLi,t−1 is the GML index of city i from period t−1 to t):
 (7)
Because all three cumulative
indices are normalized to 1 in the base year, their baseline difference is
identically 0. Differences between cumulative indices therefore track deviations
in growth trajectories across accounting frameworks rather than static
distances between frontiers.
(2) Water Environment Drag Index (WEDI)
WEDIi,t=TFP Indexi,t
− Indexi,t (8)
WEDI quantifies the deviation in growth trajectory
caused by switching the water environment variables from non-informative to
informative. WEDI > 0 indicates that water pollution constraints impose a
net productivity drag. WEDI < 0 suggests that water pollution costs have
been absorbed or converted into green innovation dividends. The year WEDI
transitions from positive to negative marks the structural shift from a “drag
period” to a “dividend period”.
(3) Energy Consumption Drag Index (ECDI)
ECDIi,t=Indexi,t − Indexi,t (9)
ECDI quantifies the additional effect of further
accounting for the energy constraint on top of the water environment
constraint. ECDI>0 indicates that energy inputs impose a productivity drag
in addition to water constraints. ECDI<0 indicates that energy efficiency
gains yield net positive dividends, signaling synergistic water-energy
governance.
It should be noted that both indices are directional
diagnostics of the net effect of environmental constraints; they are not
equivalent to the shadow prices of pollutants, and their magnitudes should not
be interpreted on a cardinal basis.
4 Data Results
4.1 Dataset Composition
The dataset comprises 3 main data structures:
(1) A panel dataset containing calculated baseline TFP, GTFPw, GTFPwe,
efficiency decomposition components (EC, TC), cumulative productivity series,
WEDI, and ECDI for 25 riverside cities for the period 2000–2022; (2) Spatial
attribute data that define urban geographical locations and basin
regionalization (upstream, midstream, downstream); (3) Raw input-output
economic and environmental panel data used during computation.
4.2 Basin-Wide Productivity Dynamics
Calculation
results from 575 observations indicate that all three cumulative productivity
indices showed upward trends over the 2000–2022 period. Average annual growth
rates were 1.80% for baseline TFP, 1.84% for water-constrained GTFPw,
and 1.80% for water-energy dual-constrained GTFPwe. Growth measured
after accounting for the water environment constraint was slightly higher than
the baseline, whereas further accounting for the energy constraint brought it
back to roughly the baseline level (cumulative index of 1.479 in 2022 vs. 1.480
for the baseline), the latter reflecting the offsetting of water environment
dividends by energy costs. From a driver perspective (Figure 1), green
technological progress (TC) served as the primary engine of industrial green
transformation (efficiency catch-up dominated in the upstream cities). Over
2000–2022, cumulative GTFPwe increased by 47.9%, with both technical
change and efficiency change contributing positively, aligning with the Porter
Hypothesis[14], which holds that moderate environmental regulation
can stimulate technological innovation and managerial improvement in firms,
shifting the production frontier outward.
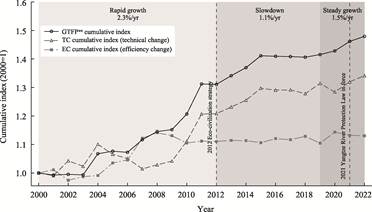
Figure
1 Temporal evolution of GTFPwe
in core riverside cities along the YREB (2000–2022)
Across the full sample,
the mean WEDI value was 0.0198, indicating that water environment constraints
exerted a slight overall drag on industrial productivity. However, its
substantial standard deviation (0.1703) and wide range (1.5159) underscore
pronounced urban heterogeneity. The mean ECDI value was −0.0073 with a standard
deviation of 0.0552, suggesting that the additional drag effect of energy
constraints was relatively modest and, on average, net negative (yielding productivity
dividends from energy-efficiency improvements), although city-level divergence
remained evident.
4.3 Spatial-Temporal Evolution of the Water
Environment Drag Index (WEDI)
The WEDI exhibited a representative inverted
U-shaped trajectory (Figure 2), tracing a complete cycle of industrial water
pollution (from accumulation and surge to substantial abatement) along the
YREB.
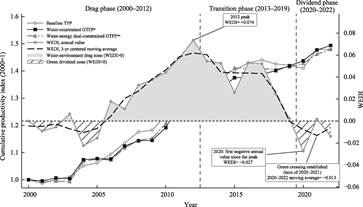
Notes: The left axis shows cumulative productivity
indices with 2000 as the base year (=1); the right axis shows WEDI=cumulative
TFP index–cumulative GTFPw index. Positive WEDI values indicate that
the water-environment constraint drags on industrial productivity, and negative
values indicate that it has turned into a green dividend. The three-year moving
average is centered, with truncated windows at the end points.
Figure
2 Dynamic trajectory of industrial
productivity and the WEDI
Phase 1 (2000–2012): The drag phase. WEDI fluctuated slightly around 0
during 2000–2005, rose steadily from 2006 onward, and peaked at 0.0736 in 2012,
reflecting an escalating productivity drag imposed by water pollution
constraints. This period coincided with accelerated industrialization across riverside
cities, characterized by the swiftexpansion of heavy chemical industries and underinvestment
in water pollution control. Consequently, the upward trend in WEDI quantifies
the economic penalty imposed by the region’s legacy “pollute first, treat
later” development model.
Phase 2 (2013–2019): The transition phase.
WEDI fluctuated downward from 0.0736 in 2012 to 0.0023 in 2019, approaching 0.
During this phase, landmark policies, including the Action Plan for Prevention
and Control of Water Pollution (“Water Ten Plan”, 2015) and the Yangtze River Conservation
Strategy (2016), were successively promulgated, considerably intensifying
environmental regulatory pressure. Industrial enterprises responded by
deploying cleaner production technologies and closed-loop water recirculation
systems, shifting water governance paradigms from end-of-pipe treatment to
source reduction. This decline was non-monotonic: after dropping to 0.0259 in
2015, WEDI temporarily rebounded to 0.0529 in 2016 and 0.0521 in 2017, then
resumed a downward trajectory from 2018 onward. This two-stage
“rebound-then-decline” pattern reflects the temporal lag in innovation offsets,
with immediate compliance costs preceding full technological adaptation.
Phase 3
(2020–2022): The dividend phase. The official implementation of the Yangtze
River Protection Law (2021) signaled a deepening phase of the basin-wide
protection strategy. Annual WEDI metrics contained noise from single-year data
fluctuations, turning negative in 2020 (−0.027) for the first time since the
peak, rebounding to near 0 in 2021 (+0.002), and then dropping back into
negative territory in 2022 (−0.014). To reduce transient noise, this study
employed a 3-year rolling average as the analytical benchmark: the rolling WEDI
turned negative in the 2018–2020 window (−0.0002),
declined to −0.008 in 2019–2021, and further fell to −0.013 in 2020–2022. The
“green crossing” was firmly established at the turn of 2020–2021. A negative
WEDI indicates that cumulative productivity evaluated under water constraints
exceeds that measured under baseline conditions, confirming that the dividends
of green technological innovation have surpassed environmental compliance costs.
4.4 Spatial-Temporal Evolution of the Energy
Consumption Drag Index (ECDI)
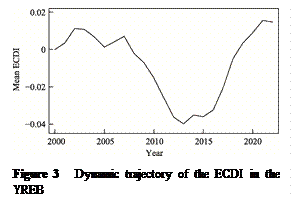 ECDI exhibited a U-shaped trajectory (Figure 3), displaying a clear
mirror-image symmetry to the inverted U-shaped WEDI curve. During 2000–2007,
ECDI fluctuated between 0 and 0.0113 (peaking in 2002 and standing at 0.0071 in
2007), indicating an additional productivity drag from energy inputs. From 2008
to 2013, fueled by stringent energy-saving and emissions-reduction targets
under the 11th and 12th Five-Year Plans, widespread industrial technological
retrofitting drove ECDI to a trough of −0.0398, thereby converting
energy-efficiency gains into net productivity dividends. From 2014 to 2018,
this dividend narrowed as the ECDI increased back to −0.0050. In 2019, ECDI
turned positive (+0.0034) and rose to 0.0155 in 2021 before reaching 0.0147 in
2022, indicating diminishing marginal returns from conventional energy-saving
techniques and the emergence of energy penalties associated with advanced water
treatment.
The inverse symmetry between the inverted U-shaped WEDI
and the U-shaped ECDI— both featuring structural inflection points around
2013—highlights the systemic complexity of industrial green transformation.
Water pollution control inherently demands negative entropy input, which
requires free energy consumption (predominantly industrial electricity). While
the fluctuating decline of WEDI (2013–2022) confirms the efficacy of basin
water governance, the delayed rebound of
ECDI (2019–2022) reveals that when water governance relies heavily on
energy-intensive treatment technologies, the green dividends from water
environment improvements will be offset by energy-consumption costs. The
mirror-image relationship between WEDI and ECDI shows that green transformation
cannot be pursued as a single-objective optimization but must be managed as a
multi-constraint systemic equilibrium.
4.5 Urban Heterogeneity: Three Transformation Paths
based on WEDI
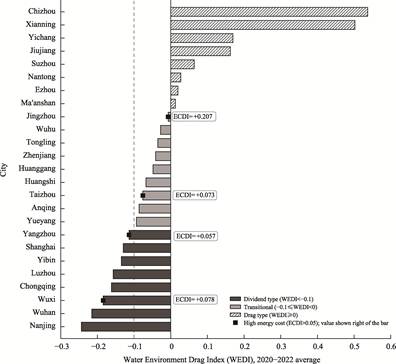
To smooth out single-year fluctuations, the 25 core cities were
categorized into 3 transformation pathways based on their 3-year average WEDI
over the 2020–2022 period (Figure 4). Notably, the cross-sectional dispersion
of ECDI was much lower than that of WEDI (with |ECDI| < 0.01 across most
cities, representing approximately 1/7 of WEDI’s average magnitude), rendering
ECDI insufficient as an independent classification dimension. Urban paths were
thus strictly defined by WEDI, with ECDI serving as an auxiliary
Figure
4 Mean WEDI of core riverside cities in the YREB
(2020–2022)
indicator of energy penalties.
(1) Dividend type (WEDI<−0.1; 8 cities)
Nanjing, Wuhan, Wuxi, Chongqing, Luzhou,
Yibin, Shanghai, and Yangzhou all successfully converted water environment
governance into net productivity dividends. With a group mean WEDI of −0.167,
water constraints in these cities no longer acted as a drag but instead drove
productivity growth by forcing technological innovation. Divergent
transformation mechanisms can be observed among these cities: Shanghai and
Wuhan leveraged forward-looking high-tech industrial layouts to drive
productivity via frontier technological innovation, whereas interior cities
such as Luzhou and Yibin may have benefited from latecomer advantages and the
effective absorption of advanced technologies and management practices.
Notably, Wuxi (ECDI=0.0775) and Yangzhou
(ECDI=0.0566) incurred high energy penalties while realizing water governance
dividends, indicating their potential reliance on energy-intensive wastewater
treatment technologies such as membrane filtration and deep denitrification.
(2) In-transition
type (−0.1≤WEDI<0; 9 cities)
Yueyang, Anqing,
Taizhou, Huangshi, Huanggang, Zhenjiang, Tongling, Wuhu, and Jingzhou all
exhibited WEDI values between −0.1 and 0, indicating the dissipation of the
water pollution drag. Their group mean WEDI of −0.054 suggests that these
cities are undergoing a structural transition from the “compliance cost period”
to the “regulatory dividend period”.
Among them,
Taizhou (ECDI=0.0726) and Jingzhou (ECDI=0.2073) displayed pronounced energy
penalties. Jingzhou, in particular, recorded the highest ECDI in the entire
sample (0.2073), suggesting possible overreliance on energy-intensive water
treatment technologies and highlighting the need for technological pathway
optimization.
(3) Drag type
(WEDI≥0; 8 cities)
Ma’anshan, Ezhou,
Nantong, Suzhou, Jiujiang, Yichang, Xianning, and Chizhou remain subject to a
productivity drag due to water pollution constraints. Their group mean WEDI was
0.187, indicating that water governance investments have not yet fully
translated into green productivity gains. Xianning (WEDI=0.5022) and Chizhou
(WEDI=0.5374) experienced severe drag, with WEDI values exceeding 0.5.
For major
manufacturing hubs such as Suzhou and Nantong, this situation may reflect the
duality of the “scale effect”: while large-scale production enhances energy
efficiency through economies of scale, the substantial volume of industrial
activity generates considerable absolute water consumption and pollutant
discharges, exerting persistent pressure on the local water environment.
5 Discussion and Conclusion
This
study constructed a dataset of industrial GTFP and the water environment drag
index for core riverside cities along the YREB (2000–2022). By employing a
three-tier progressive measurement framework, this study advances the existing
literature in 2 key ways. First, it transitions from single-constraint
efficiency evaluation to multilayer constraint decoupling. By progressively
incorporating water pollution and energy consumption constraints, the framework
quantifies the marginal productivity effects of distinct environmental factors.
Second, it shifts from static productivity measurement to dynamic mechanism
identification. By proposing the WEDI and the ECDI, the dataset isolates the
independent drag effects of water pollution and energy consumption and maps the
basin-wide transition from the “compliance cost period” to the “regulatory
dividend period”.
The empirical
results reveal that urban heterogeneity is the most prominent spatial feature.
During 2020–2022, 17 cities turned WEDI-negative (dividend and in-transition
types), while 8 cities remained positive (drag type), and the cumulative GTFPwe
index differed 2.11-fold between the highest (Luzhou, 1.840) and lowest
(Chizhou, 0.873) cities. Green technological progress served as the primary
engine driving industrial green transformation. WEDI’s inverted U-shaped
evolution (peaking in 2012 before fluctuating downward) marks the shift in
regional water governance from a drag period to a dividend period.
Concurrently, the U-shaped trajectory of ECDI (reaching a trough in 2013 before
rising) reveals the emerging energy penalty associated with advanced water
treatment.
This dataset
provides robust empirical support for 3 major research domains.
(1) Environmental policy
evaluation: tracing the longitudinal trajectory of WEDI enables the evaluation
of the structural impacts and lag effects of landmark policies, such as the
Yangtze River Conservation Strategy (2016) and the Yangtze River Protection Law
(2021).
(2) Regional green
pathway optimization: Spatial classification based on WEDI provides empirical
evidence for tailored policy design across dividend, in-transition, and drag
cities.
(3) Water-energy nexus
research: The inverse symmetry between WEDI and ECDI quantifies the energy
tradeoff of water governance and identifies cities with high energy costs
(Wuxi, Yangzhou, Taizhou, and Jingzhou), establishing a solid empirical
foundation for water-energy nexus studies.
Although the
dataset was carefully designed and processed, it has several limitations.
First, the dataset is currently aggregated at the overall industrial level
without sub-sectoral breakdown (e.g., chemical, metallurgical, or electronic
manufacturing), which limits the ability to generate fine-grained sectoral
insights. Second, to characterize constraint penalties, this dataset uses index
differencing within a unified DDF framework (WEDI and ECDI) to evaluate the
impacts on macro-efficiency. While well-suited for analyzing macro-level
longitudinal trends and spatial patterns, future research can leverage the dual
relationship of the DDF to derive shadow prices for specific pollutants,
thereby deepening investigations of micro-mechanisms. Third, the spatial scope
covers 25 core riverside cities rather than all 110 cities at the prefecture
level and above in the YREB, constraining basin-wide comprehensiveness.
This dataset supported the discovery of the first author’s doctoral
thesis in Science.
Author Contributions
Liu, R. designed the overall
research, collected and processed the data, performed data visualization, and
drafted the initial manuscript. Wang, Z. B. provided conceptual guidance,
reviewed and edited the manuscript, and secured project funding.
Acknowledgments
The authors express their
sincere gratitude to Dr. Zhou, Y. K. for continuous and
selfless assistance throughout the manuscript submission process. Gratitude is
also extended to Dr. Zhao, L. F. for providing formatting references and
valuable constructive comments on earlier drafts.
Conflicts
of Interest
The
authors declare no conflicts of interest.
References
[1] Chen, S. Y. Green industrial
revolution in China: a perspective from the change of Environmental Total
Factor Productivity (1980–2008) [J]. Economic Research Journal, 2010,
45(11): 21–34.
[2] Lu, L. W., Song, D. Y.,
Huang, C. Measurement of urban green total factor productivity in the Yangtze
River Economic Belt: a case study of 108 cities in the Yangtze River Economic
Belt [J]. Urban Problems, 2017(1): 61–67.
[3] Outline of the development
plan for the Yangtze River Economic Belt [Z]. 2016.
[4] Huang, L., Wu, C. Q. Industrial
green development efficiency and spatial driven mechanism in cities of the
Yangtze River Economic Belt [J]. China Population, Resources and
Environment, 2019, 29(8): 40–49.
[5] Chen, C. F. China’s industrial
Green Total Factor Productivity and its determinants: an empirical study based
on ML index and dynamic panel data model [J]. Statistical Research, 2016,
33(3): 53–62.
[6] Yin, L. H., Meng, X.
Q., Wu, C. Q. The impact of environmental regulation on the Green Total Factor Productivity
of manufacturing in the Yangtze River Economic Belt [J]. Reform,
2022(3): 101–103.
[7] Yuan, Y. J., Xie, R. H.
Research on the effect of environmental regulation to industrial restructuring—
empirical test based on provincial panel data of China [J]. China Industrial
Economics, 2014(8): 57–69.
[8] Wu, Z. J., Wu, N. J. Research
on the measurement, decomposition and influencing factors of Green Economic Efficiency in the Yangtze River Economic
Belt: based on super-efficiency SBM-ML-Tobit model [J]. Urban
Problems, 2021(1): 52–62, 89.
[9] Liu, R., Wang, Z. B.
Dataset of industrial Green Total Factor Productivity and Water Environment Drag
Index for core riverside cities in the Yangtze River Economic Belt (2000–2022)
[J/DB/OL]. Digital Journal of Global Change Data Repository, 2026.
https://doi.org/10.3974/geodb.2026.04.08.V1.
[10] GCdataPR Editorial Office. GCdataPR
data sharing policy [OL]. https://doi.org/10.3974/dp.policy.2014.05 (Updated
2017).
[11] Chung, Y. H., Färe, R., Grosskopf,
S. Productivity and undesirable outputs: a directional distance function
approach [J]. Journal of Environmental Management, 1997, 51(3): 229–240.
[12] Oh, D. H. A global
Malmquist-Luenberger productivity index [J]. Journal of Productivity
Analysis, 2010, 34(3): 183–197.
[13] Wang, D. P., Du, K. R., Zhang, N.
Measuring technical efficiency and total factor productivity change with
undesirable outputs in Stata [J]. The Stata Journal, 2022, 22(1): 103–124.
[14] Porter,
M. E., van der Linde, C. Toward a new conception of the
environment-competitiveness relationship [J]. Journal of Economic
Perspectives, 1995, 9(4): 97–118.