Development of the Global
Urban FBR 10-m Grid Dataset (2023)
ZHAO Lifeng1,2
TIAN Li1,2* YANG Yang3 WANG Zhenbo1,2
1.
Institute of Geographic Sciences and Natural Resources Research, Chinese
Academy of Sciences, Beijing 100101, China;
2. College of Resources and Environment, University
of Chinese Academy of Sciences, Beijing 100049, China;
3. College of Computer Science, Beijing University
of Technology, Beijing 100124, China
Abstract:
The spatial distribution and
structural characteristics of urban forests are key prerequisites for linking
the implementation of SDG 11 (Sustainable Cities and Communities) and SDG 13
(Climate Action). To overcome the limitations of conventional indicators in
defining spatial boundaries, enabling intercity comparability, and
characterizing intracity equity, this study used 10-m resolution ESRI land-use
data (2023) and a 1-km moving window to construct the Forest-to-Built-up Area
Ratio (FBR), thereby generating a 2023 FBR dataset for 978 cities worldwide.
This indicator focuses on the physical spatial extent of urban built-up areas,
eliminates differences in city size by expressing forest land relative to
impervious surface, and quantifies spatial heterogeneity at the pixel scale.
The dataset is archived in .tif format and consists of 978 files, totaling 53.5
GB (compressed into 3 files, totaling 1.92 GB). This dataset supported the completion of the first
author’s Master of Science thesis in Resources and Environment.
Keywords: Forest-to-Built-up Area Ratio
(FBR); urban built-up area; spatial heterogeneity; global dataset; 10-m
resolution; Master of Science thesis
DOI: https://doi.org/10.3974/geodp.2026.02.02
Dataset Availability Statement:
The dataset
supporting this paper was published and is accessible through the Digital Journal of
Global Change Data Repository at:
https://doi.org/10.3974/geodb.2025.11.06.V1.
1
Introduction
The ecosystem services provided by urban
forests are substantially greater than those provided by other forms of green infrastructure[1,2]. Developing urban
forests is therefore an important pathway for urban systems to advance SDG 11
(make cities and human settlements inclusive, safe, resilient and sustainable)
and SDG 13 (take urgent action to combat climate change and its impacts). However,
over the past decade, urban tree cover has declined on every continent except
Europe[3]. Moreover, climate warming has intensified the urban heat
island effect and significantly reduced the carbon sequestration efficiency of
trees[4]. Urban forests therefore face multiple risks, including
area loss and quality degradation. Against this background, scientifically
quantifying the spatial distribution and structural characteristics of urban
forests is essential for linking the implementation of SDG 11 and SDG 13.
Currently, a variety of indicators and
methods are used to quantify the amount of urban forests, mainly including
coverage-based indicators and area-based indicators. Coverage-based indicators[5]
(e.g., canopy cover and tree cover) are widely used to assess urban heat island
mitigation effects[6] because they are closely related to
climate-regulation indicators such as land surface temperature and thermal
comfort. Area-based indicators (e.g., forest cover area and green-space area)
provide intuitive quantitative evidence for forest resource monitoring and the
assessment of green and sustainable development[7–9]. These studies
have laid an important foundation for understanding the ecological functions of
urban forests. However, from the perspective of supporting SDG 11 (Sustainable
Cities and Communities) and SDG 13 (Climate Action), existing indicators still have
2 limitations. First, spatial boundaries are defined inconsistently. Most
studies use administrative units or natural boundaries as statistical units[10–12],
making it difficult to accurately capture the interaction between forest land
and the built environment within the physical urban area, whereas SDG 11
emphasizes the sustainability of “cities and human settlements”, and the core
spatial unit of concern should therefore be
the urban built-up area in which residents actually conduct their daily
activities. Second, comparability and spatial refinement remain insufficient.
Absolute indicators such as coverage and area are strongly affected by city size
and natural background conditions, making cross-city and cross-regional
comparisons difficult. At the same time, traditional indicators usually remain
at the level of citywide averages[7,8] and cannot reveal the spatial
heterogeneity of forest distribution or issues of intracity equity, even though
these are key dimensions of “inclusiveness” and “safety” in SDG 11.
To address the above challenges, this study
constructed the urban Forest-to-Built-up Area Ratio (FBR) using ESRI 10-m
land-use data. This indicator has 3 main advantages. First, in terms of spatial
scope, it focuses precisely on the physical urban entity. City boundaries that
this study adopted were extracted from urban built-up areas, thereby excluding
interference from suburban areas and non-urban built environments. Second, in
terms of comparability, it removes scale effects across cities. By expressing forest
land relative to impervious surface, it minimizes the influence of city size
and enables cities of different sizes and development stages to be compared on
a consistent basis. Third, in terms of scale, it enables fine-grained
characterization of spatial heterogeneity, thereby supporting quantitative
analysis of the equity and balance of ecological space distribution within
cities.
2
Metadata of the Dataset
Information on the dataset name, authors,
geographic region, temporal coverage, dataset composition, data publishing and
sharing service platform, and sharing policy for the Global urban FBR 10-m grid
dataset (2023)[13] is provided in Table 1.
3 Methods
3.1 Data Sources
The 2018 boundary data for 978 global cities used in
this study were sourced from the FROM-GLC group at Tsinghua University[15], and subsequently from a version processed by CHEN Bin and
colleagues at the University of Hong Kong for a specific study[16]. Based on the 30-m resolution Global Artificial Impervious
Area (GAIA) product, the dataset provides global urban boundaries (GUB), which
defines the physical spatial extent of cities[15].
Table 1 Metadata summary of the Global urban FBR
10-m grid dataset (2023)
|
Item
|
Description
|
|
Dataset
full name
|
Global
urban FBR 10-m grid dataset (2023)
|
|
Dataset
short name
|
UrbanFBR
|
|
Authors
|
Zhao, L.
F., Institute of Geographic Sciences and Natural Resources Research, Chinese
Academy of Sciences, University of Chinese Academy of Sciences,
zhaolifeng23@mails.ucas.ac.cn
Tian, L.,
Institute of Geographic Sciences and Natural Resources Research, Chinese
Academy of Sciences, University of Chinese Academy of Sciences,
tianli@igsnrr.ac.cn
Yang, Y.,
College of Computer Science, Beijing University of Technology,
yangyang@emails.bjut.edu.cn
Wang, Z.
B., Institute of Geographic Sciences and Natural Resources Research, Chinese
Academy of Sciences, University of Chinese Academy of Sciences,
wangzb@igsnrr.ac.cn
|
|
Geographical
region
|
Global
|
|
Year
|
2023
|
|
Data
format
|
.tif
|
|
Data size
|
1.92 GB (after compressed)
|
|
Data
files
|
FBR grid
data for 978 cities
|
|
Data computing environment
|
Python,
ArcGIS, QGIS, Google Earth
|
|
Data
publisher
|
Global
Change Research Data Publishing & Repository, http://www.geodoi.ac.cn
|
|
Address
|
No. 11A,
Datun Road, Chaoyang District, Beijing 100101, China
|
|
Data
sharing policy
|
(1)
Data
are openly available and can be free downloaded via the Internet; (2) End
users are encouraged to use Data subject to citation; (3)
Users, who are by definition also value-added service providers, are welcome
to redistribute Data subject to written permission from the GCdataPR
Editorial Office and the issuance of a Data redistribution license; and
(4) If Data are used to compile new datasets, the “ten percent
principal” should be followed such that Data records utilized should not
surpass 10% of the new dataset contents, while sources should be clearly
noted in suitable places in the new dataset[14]
|
|
Communication
and
searchable
system
|
DOI,
CSTR, Crossref, DCI, CSCD, CNKI, SciEngine, WDS, GEOSS, PubScholar, CKRSC
|
On this basis, this study
further optimized the boundary data in 3 respects: first, spatial features
sharing common boundaries were merged; second, areas where the built-up area
boundaries showed obvious deviations from Google Earth high-resolution
satellite imagery were corrected; third, misclassified boundary units and
built-up area boundary units containing no forest land were removed. The
spatial extent data for forest land and impervious surface used in this study
were derived from the 2023 ESRI 10-m resolution land-use product.
3.2 Methods
The pixel-level
Forest-to-Built-up Area Ratio (FBR) was calculated for each pixel using a
moving window based on the ESRI land-use data at a spatial resolution of 10 m
by 10 m. The moving window was defined as a square centered on the target pixel
with a side length of approximately 2 km; that is, the perpendicular distance
from the central pixel to each of the four window edges was about 1 km. This
1-km threshold was set with reference to the typical service radius of the
“15-minute living circle” in urban studies, with the aim of capturing the
proportional relationship between forest land and the built environment within
residents’ daily activity range.
 (1)
(1)
Where  is the number of
pixels classified as trees within the moving window corresponding to pixel i
in city j;
is the number of
pixels classified as trees within the moving window corresponding to pixel i
in city j;  is the number of
pixels classified as built area within the moving window corresponding to pixel
i in city j.
is the number of
pixels classified as built area within the moving window corresponding to pixel
i in city j.  denotes the FBR
for pixel i in city j. A smaller
denotes the FBR
for pixel i in city j. A smaller  indicates less
forest land and more built-up surface within the 1-km range of pixel i
in city j; a larger indicates more
forest land within the 1-km range of pixel i in city j;
indicates less
forest land and more built-up surface within the 1-km range of pixel i
in city j; a larger indicates more
forest land within the 1-km range of pixel i in city j;  indicates that
the 1-km range around pixel i is entirely covered by forest land.
indicates that
the 1-km range around pixel i is entirely covered by forest land.
4 Data
Results
4.1 Dataset Composition
The dataset contains FBR grid data for 978 cities. Each file
is named after the principal administrative division to which the corresponding
city belongs. The dataset is archived in .tif format and consists of 978 files,
totaling 53.5 GB (compressed into 3 files, 1.92 GB).
4.2 Data Results Analysis
The FBR values within the urban built-up areas of
978 cities worldwide show significant spatial heterogeneity and regional
clustering. Overall, high-FBR areas (≥0.13) are mainly concentrated in the mid-
to high-latitude regions of the Northern Hemisphere and in some humid tropical
regions, whereas low-FBR areas (0.00–0.05) are widely distributed across arid
and semi-arid regions of the mid- and low-latitudes and in some densely
populated areas undergoing rapid urbanization. This pattern indicates that the
trade-off between forest retention and construction intensity within cities is
strongly constrained by the broader geographical context.
At
the global scale, FBR exhibits distinctly different spatial patterns across
continents and subregions. First, North America shows a pronounced east-west
differentiation. Urban agglomerations in the eastern and southeastern United
States generally exhibit high FBR values (≥0.26), corresponding closely to the
favorable hydrothermal conditions of this region; By contrast, cities in the
central and western United States and in Mexico generally have low FBR values
because of arid climatic constraints. Europe displays clear latitudinal
zonality, with urban FBR increasing from south to north across the continent. Cities
on the Scandinavian Peninsula, in Eastern Europe, and in the Russian Federation
largely fall within the highest value range (≥0.26), reflecting low building
density and abundant urban green space against the background of high-latitude
coniferous and broadleaf forest zones. By contrast, cities along the
Mediterranean coast of Southern Europe have relatively low FBR values, mostly
between 0.02 and 0.12. Asia, in turn, shows a complex and strongly polarized
pattern. Under the combined influence of population density and urbanization
processes, urban clusters in South Asia (e.g., India) are almost entirely
dominated by low FBR values (0.00–0.05), highlighting the extreme compression
of forest space by high-intensity impervious surface expansion. By contrast,
East Asia, especially China, shows a pattern of higher values in the south and
lower values in the north. Cities in Southern China and Japan, influenced by
the subtropical monsoon climate and mountain-water urban morphology, have
significantly higher FBR values than cities in North China and the northwestern
inland region. In South America, Africa, and Oceania, cities along the South
American coast and in Southern Brazil exhibit relatively high FBR values;
African cities generally have low FBR values, especially in North Africa and
parts of sub-Saharan Africa, reflecting an arid climatic conditions and
unplanned urban sprawl; and cities along the eastern and southern coasts of
Australia and in New Zealand generally have high FBR levels.
Based on the 10-m
resolution spatial FBR data, the standard deviation of log-transformed FBR (SD_ln(FBR))
was calculated for each of the 978 cities to measure intracity spatial
heterogeneity. This indicator essentially reflects the degree of imbalance in
the interactive distribution of green ecological space and built-up space
within cities.
Overall, the
spatial pattern of SD_ln(FBR) across the 978 cities worldwide is broadly
consistent with that of FBR. Areas of high heterogeneity (SD_ln(FBR) ≥ 0.36) are concentrated in specific
economies or geographic locations, whereas areas of low heterogeneity
(SD_ln(FBR) ≤0.05) occur as large contiguous zones in some developing countries
and arid climate regions. This pattern indicates substantial differences among
cities worldwide in the equity and balance of intra-urban greening.
By comparing the spatial distributions
across continents and countries, together with Figure 1, several typical
patterns of intracity landscape heterogeneity can be identified. The first is
the “low-total-amount, low-heterogeneity” homogeneous ecologically deficient
zone represented by South Asia and the Middle East. Most cities on the Indian
subcontinent and in the arid regions of the Middle East and North Africa fall
within the lowest FBR range (0.00–0.05) in Figure 1 and also exhibit very low standard deviations
(≤0.05) in Figure 2. This double-low pattern means that these cities not only
lack forest land overall, but also display a highly homogeneous scarcity of
forest across the entire urban built-up area. The second is the
“high-total-amount, high-heterogeneity” spatial polarization zone represented
by parts of North America, Latin America, and Southern Chinese cities. Cities
in the eastern half of the United States, the southeastern coast, the coastal
urban clusters of South America (e.g., Brazil), and southern and southeastern
coastal China generally exhibit high absolute FBR values (≥0.26) in Figure 1, indicating strong
forest endowments; However, these cities
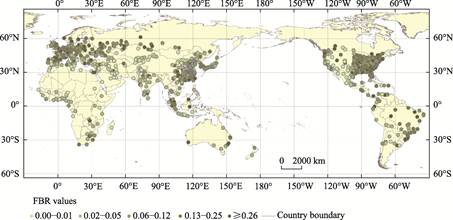
Figure 1 Spatial distribution map of
FBR within the urban built-up areas of 978 cities worldwide
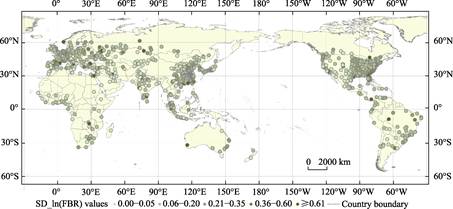
Figure 2 Spatial distribution map of FBR spatial
heterogeneity within the urban built-up areas
of 978 cities worldwide
also
show very high spatial heterogeneity (≥0.36) in Figure 2. This coupled pattern clearly reveals issues of
spatial justice within cities. In addition, there are “medium-low-total amount,
high-heterogeneity” zones represented by East Asia and Northern Chinese cities,
as well as “high-total-amount, medium-low-heterogeneity” zones represented by
high-latitude Europe and some cities in Oceania.
5 Discussion
and Conclusions
This study constructed the global urban FBR.
Based on 10-m resolution land-use data and a 1-km moving window, this indicator
offers 2 improvements. First, it shifts from representing absolute quantities
to characterizing relative relationships. FBR focuses on the proportional
structure between forest land and built-up surface, and more accurately
reflects the interaction and trade-off between ecological space and built-up
space in the urban human-land system. Second, it shifts from citywide averages
to the fine pixel scale, enabling the simultaneous characterization of forest
extent and spatial heterogeneity, and providing data support for urban typology
and pattern analysis. The results show that the global distribution of urban
forest land is dominated by “high-total-amount, high-heterogeneity” spatial
polarization zones and “low-total-amount, low-heterogeneity” homogeneous
ecologically deficient zones.
Although
this dataset was designed and processed with great care, it still has several
limitations. First, in terms of temporal consistency, the core dependent
variable of the dataset is based on land use data for 2023, whereas the
reference year of the urban boundary data is 2018, resulting in a temporal
mismatch. It should be noted that this version of the urban boundary data was
the latest publicly available and most widely used version worldwide at the
time of dataset development[17–20], and it was adopted in this study
to maintain comparability and consistency with mainstream research.
Second, This dataset is subject to error propagation arising from the accuracy
of the 2023 ESRI 10-m resolution land-use product. At the time of dataset
development, the ESRI 10-m land-use product was the highest-resolution globally
covered dataset available for large-scale land-use research. To demonstrate the
reliability of this product, this study randomly placed 100 validation sample
points within the spatial extent of forest land and 100 within the spatial
extent of impervious surface for each of the 978 global city boundaries. The
accuracy assessment results show that the overall classification accuracy
exceeded 85%, and most misclassified samples were located along the edges of
the corresponding land-cover classes, a phenomenon mainly constrained by
spatial resolution. This dataset supported the completion of the first
author’s thesis for a degree of Master of Science in Resources and Environment.
Author Contributions
Zhao, L. F.
contributed to the overall design, data collection and processing, data
visualization, manuscript writing, and formatting; Tian, L. contributed to the
overall design, data collection, content review, and revision; Yang, Y.
contributed to data collection and processing; Wang, Z. B. contributed to the
overall design.
Acknowledgements
The
authors would like to express their sincerest gratitude to Professor Liu, C.
and Associate Professor Shi, R. X. We thank them for their valuable academic
guidance throughout the revision of this dataset. The constructive suggestions
provided by the two experts at key stages, including the optimization of the
dataset calculation and classification methods, validation of the scientific
rigor of the dataset, and refinement of the scientific questions, played a
crucial role in improving the quality and rigor of this study. The authors are
deeply grateful for their insight and generous assistance.
Conflicts of Interest
The authors declare no conflicts of
interest.
References
[1]
Zhou, Y., Wang, J. The composition
and assembly of soil microbial communities differ across vegetation cover types
of urban green spaces [J]. Sustainability, 2023,
15(17): 13105.
[2]
Zhou,
Z., Fang, P., Dong, L., et al. Urban vegetation types and bryophyte
diversity: why woodlands matter [J]. Journal of
Forestry Research, 2025, 36(1): 65.
[3]
Nowak, D., Greenfield, E. The
increase of impervious cover and decrease of tree cover within urban areas
globally (2012–2017) [J]. Urban Forestry & Urban Greening,
2020, 49: 126638.
[4]
Meineke, E., Youngsteadt, E.,
Dunn, R., et al. Urban warming reduces aboveground carbon storage [J]. Proceedings
of the Royal Society B-Biological Sciences, 2016, 283(1840):
20161574.
[5]
Vogt, M. Refined wilding and urban
forests: conceptual guidance for a more significant urban green space type [J].
Forests, 2025, 16(7): 1087.
[6]
Chen, T., Singh, V., Zhang, S.,
et al. A city-scale mapping tool for assessing effects of urban greenery
and morphologies on thermal comfort: a case study in Singapore [J]. Building
and Environment, 2026, 287: 113760.
[7]
Xiao, L., Mokhtar, N.,
Sulaiman, M., et al. Enhancing urban sustainability through green infrastructure:
spatiotemporal analysis of green space and forest coverage in Sichuan
(2002–2022) [J]. Sustainability, 2025, 17(11): 5135.
[8]
Muhoza,
J., Zhou, W. Urban land expansion and spatiotemporal dynamics of urban green spaces
in Africa [J]. Sustainability, 2025, 17(7):
2880.
[9]
Chen, R., Cui, X., Lei, Y.
Coordination analysis of urban forest and urban development level: a case study
of the Yangtze River Delta Urban Agglomeration, China [J]. Sustainability,
2023, 15(20): 15165.
[10]
Cobbinah,
P., Asibey, M., Azumah, A. Urban forest and the question of
planning-sustainability inadequacy [J]. Cities,
2023, 140: 104453.
[11]
Wang, Y. N., Zhou, Z. G., Zhu,
W. H., et al. Influence of urbanization intensity on urban forest
landscape pattern [J]. Shandong Forestry Science and Technology, 2021,
51(5): 29–35+48.
[12]
Zhong, J. L., Li, X., Liu, W., et
al. Effects of urbanization intensity on forest vegetation characteristics
and landscape pattern indices in Nanchang [J]. Chinese Journal of Ecology,
2024, 43(8): 2285–2294.
[13]
Zhao, L. F., Tian, L., Yang,
Y., et al. Global urban FBR 10-m grid dataset (2023) [J/DB/OL]. Digital Journal of Global Change Data Repository, 2025. https://doi.org/10.3974/geodb.2025.11.06.V1.
[14]
GCdataPR Editorial Office.
GCdataPR data sharing policy [OL]. https://doi.org/10.3974/dp.policy.2014.05
(Updated 2017).
[15]
Li, X., Gong, P., Zhou, Y., et
al. Mapping global urban boundaries from the global artificial impervious
area (GAIA) data [J]. Environmental Research Letters, 2020, 15(9):
094044.
[16]
Chen, B., Wu, S., Song, Y., et
al. Contrasting inequality in human exposure to greenspace between cities
of Global North and Global South [J]. Nature Communications, 2022,
13(1): 4636.
[17]
Li, Y., Svenning, J., Zhou, W.,
et al. Green spaces provide substantial but unequal urban cooling globally
[J]. Nature Communications, 2024, 15(1): 7108.
[18]
Wei, L., Liu, Z., Zhou, Y., et
al. Global urban green spaces in the functional urban areas: spatial
pattern, drivers and size hierarchy [J]. Urban Forestry & Urban
Greening, 2025, 107: 128770.
[19]
Bille, R., Jensen, K.,
Buitenwerf, R. Global patterns in urban green space are strongly linked to
human development and population density [J]. Urban Forestry & Urban
Greening, 2023, 86: 127980.
[20]
Wu, S., Chen, B., Webster, C., et
al. Improved human greenspace exposure equality during 21st century
urbanization [J]. Nature Communications, 2023, 14(1): 6460.