Analysis of the Dataset
Conducted from Three in Situ Soil-Atmosphere Sites in the Qinghai Section of Qilian Mountains National Park
(2022.7–2024.6)
BAI Lili1,2
WANG 3,4* LUO 3 NIU 3 YANG 3 3 3
1.
College of Geographical Science, Qinghai Normal University, Xining 810008,
China;
2.
College of Resources, Environment and Life Sciences, Ningxia Normal University,
Guyuan 756000, China;
3.
College of Life Science, Qinghai Normal University, Xining 810008, China;
3. Provincial Key
Laboratory of Biodiversity Formation Mechanism and Comprehensive Utilization in
Qinghai- Xizang Plateau, Xining 810008, China
Abstract:
The Qilian
Mountains National Park is a crucial ecological functional area in Northwest
China. Real-time monitoring of key environmental elements within its ecosystem
is of great significance for exploring the responsiveness and adaptive changes
of the ecological environment in the Qinghai section of Qilian Mountains
National Park under climate change. This study selected coniferous forests
(foot of the mountain), alpine shrubs (mid-slope), and alpine meadows (base of the mountain
top) in Qinghai section of Qilian Mountains National Park as monitoring sites
for key environmental elements (soil-atmosphere). Meteorological equipment (i.e., EE181
temperature and humidity sensors, CSD sunshine duration sensors, and CS650 soil
moisture/temperature/ conductivity sensors) was installed in each vegetation
type to collect real-time data such as solar radiation, wind speed, atmospheric
temperature and humidity, as well as soil temperature and humidity. This
constitutes the dataset of key environmental elements (soil-atmosphere) for the Qinghai section of the Qilian
Mountains National Park (2022.7–2024.6). The dataset includes: (1) Position data of of the
monitoring sites; (2) Key environmental element data from the three monitoring
sites, including atmospheric elements (air temperature and humidity, atmospheric
pressure, wind speed and direction, total sunshine duration, etc.) and soil
parameters (soil temperature, soil moisture, and soil electrical conductivity).
The data cover the period from July 2022 to June 2024, on a daily time scale.
The dataset is archived in .shp and .xlsx formats, comprising 8 data files,
with a total data volume of 809 KB (compressed into one file, 686 KB).
Keywords: Qilian Mountains
National Park; Qinghai section; key environmental factors (soil-atmosphere);
July 2022–June 2024
DOI: https://doi.org/10.3974/geodp.2026.02.10
Dataset Availability Statement:
The dataset
supporting this paper was published and is accessible through the Digital
Journal of Global Change Data Repository at:
https://doi.org/10.3974/geodb.2025.10.09.V1.
1 Introduction
Land surface properties are a critical factor influencing
regional climate. As a distinct landform type, mountainous areas exhibit
pronounced regional characteristics in climate variation[1]. Within
mountain ecosystems, the distribution of meteorological factors is highly
complex due to rugged terrain, significant elevation variations, and the
influence of slope aspect and gradient. As a result, climatic elements such as
temperature and wind speed exhibit distinct patterns of variation with altitude
across different regions[2]. For instance, atmospheric pressure and
temperature decrease with increasing elevation, whereas solar and ultraviolet
radiation intensify at higher altitudes. Additionally, other environmental
factors such as precipitation, wind speed, and evapotranspiration are also
influenced by elevational gradients, collectively shaping the complex climatic
patterns of mountainous regions[3].
The Qilian Mountains, located in an important climate
transition zone of our country, have a wide altitude range and complex terrain.
The meteorological elements within its territory are highly diverse. Under the
background of global climate change, the Qilian Mountains, as a typical fragile
ecological area and an important climate-sensitive area in our country, are
extremely sensitive to environmental changes[4]. So far, there have
been relatively few studies on the climatic aspects of the Qilian Mountains.
This study focused on the mountain foot (coniferous forests), mountain mid-slope
(alpine shrubs), and mountain top base (alpine meadows) areas of the Qinghai
section of the Qilian Mountains National Park. Small-scale meteorological
equipment was set up in each type of sample area to conduct long-term,
continuous climate observation research on the vertical distribution
characteristics of the mountain ecosystem environment. The main objective was
to explore the temporal and spatial variation characteristics of key
environmental elements between the land and the atmosphere in the Qilian
Mountains ecosystem region (Figure 1), and to reveal the regional environment
of the Qilian Mountains and its response to climate warming, providing
important real-time data for the protection of the Qilian Mountains ecosystem
environment.
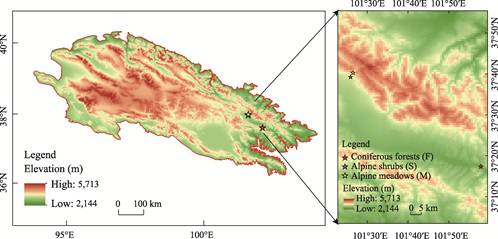
Figure 1 Location map of
environmental monitoring plots for three vegetation types
2 Metadata of the Dataset
The name, authors, geographical region, year of the dataset,
dataset composition, data publishing and sharing service platform, and data
sharing policy of the Dataset conducted from three in situ
soil-atmosphere sites of Qilian Mountains National Park (2022.7– 2024.6)[5] are shown in Table 1.
Table
1 Metadata
summary of the Dataset conducted from three in situ soil-atmosphere
sites of Qilian Mountains National Park (2022.7–2024.6)
|
Items
|
Description
|
|
Dataset full name
|
Dataset
conducted from three in situ soil-atmosphere sites of Qilian Mountains
National Park (2022.7–2024.6)
|
|
Dataset short name
|
ElementsSoilAtmosQinghaiQilian
|
|
Authors
|
Bai, L. L., Qinghai Normal University, 2534061194@qq.com
Wang, W. Y., Qinghai Normal University, wangwy0106@163.com
Luo, Q., Qinghai Normal University, 576303872@qq.com
Niu, F. Y., Qinghai Normal University, 960287126@qq.com
Yang, F. K., Qinghai Normal University, fangkun_yang@163.com
Ma, Y. M., Qinghai Normal University, 1281804224@qq.com
Wang, Y. X., Qinghai Normal University,
1340235967@qq.com
|
|
Geographical region
|
The Qinghai section of Qilian Mountain National Park
|
|
Year
|
2022.7–2024.6
|
|
Data format
|
.shp, .xlsx
|
|
Data sizes
|
809 MB
|
|
Data files
|
Geo-location data of the sample sites; key
environmental element data from the 3 sites, including atmospheric elements
and soil parameters
|
|
Foundations
|
Ministry of
Science and Technology of P. R. China (2023YFF1304305); Natural Science
Foundation of Qinghai Province (2025-ZJ-969T); National Natural Science
Foundation of China (W2412148); Ministry of Education of P. R. China &
State Administration of Foreign Experts Affairs of P. R. China (D23029)
|
|
Data publisher
|
Global Change scientific research data publishing System
http://www.geodoi.ac.cn
|
|
Address
|
No. 11A, Datun Road, Chaoyang District, Beijing 100101, China
|
|
Data sharing policy
|
(1) Data
are openly available and can be free downloaded via the Internet; (2) End
users are encouraged to use Data
subject to citation; (3) Users, who are by definition also value-added
service providers, are welcome to redistribute Data subject to written permission from the GCdataPR Editorial
Office and the issuance of a Data
redistribution license; and (4) If Data
are used to compile new datasets, the “ten percent principal” should be
followed such that Data records
utilized should not surpass 10% of the new dataset contents, while sources
should be clearly noted in suitable places in the new dataset[6]
|
|
Communication and searchable system
|
DOI, CSTR, Crossref, DCI, CSCD, CNKI,
SciEngine, WDS, GEOSS, PubScholar, CKRSC
|
3 Data Monitoring Methodology
In mountain ecosystems, meteorological factors often exhibit
different characteristics from the foothills to the summit. Based on the
representativeness of the mountain range, in the vertical sampling zone of the
Qinghai section of the Qilian Mountains National Park, the foot of the mountain
(coniferous forests), the mid-slope (alpine shrubs), and the mountain top base
(alpine meadows) were selected as long-term real-time climate monitoring sites.
Small meteorological stations (equipped with EE181 temperature and humidity
sensors, CSD light duration sensors, and CS650 soil
moisture/temperature/conductivity sensors) were set up within each type of site
to collect real-time meteorological data such as light radiation, wind speed,
soil temperature and humidity.
4 Data Results
4.1 Dataset Composition
The dataset
includes: (1) Position data of the monitoring sites; (2) Key environmental
element data from the three monitoring sites, including atmospheric elements
(temperature and humidity, atmospheric pressure, atmospheric CO2 concentration,
atmospheric O2 concentration, wind speed and direction, total
sunshine duration) and soil parameters (soil temperature, soil moisture and
soil electrical conductivity at depths of 10 cm, 30 cm and 50 cm). The data
cover the period from July 2022 to June 2024, on a daily time scale.
4.2 Data Results Analysis
4.2.1 Atmospheric
Elements
The atmospheric
temperature gradually decreases with increasing altitude, following the
pattern of coniferous forests>alpine shrubs>alpine
meadows. During the periods of 2022.7– 2023.6 and 2023.7–2024.6, all of the
coniferous forest, alpine shrubbery, and alpine meadow showed that the lowest
temperature occurred in January and February, and the highest temperature
occurred in August. All of the coniferous forests, alpine shrubs, and alpine
meadows demonstrated that the average temperature during 2023.7–2024.6 was
higher than that during 2022.7–2023.6 (Figure 2).
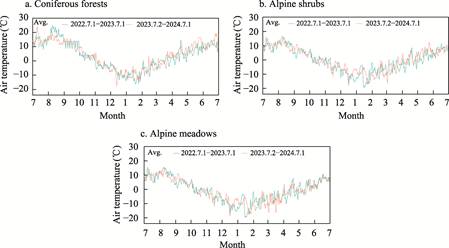
Figure 2 Inter-annual
variation characteristics of temperature
The
relative humidity of the atmosphere gradually decreases with increasing
altitude, following the pattern of coniferous forests > alpine shrubs >
alpine meadows. During the periods of 2022.7–2023.6 and 2023.7–2024.6, all the
coniferous forests, alpine shrubs and alpine meadows showed that the relative
humidity of the atmosphere was lower in spring (January–March) and higher in
autumn (August–October). During the period of 2022.7– 2023.6, the lowest
relative humidity of the coniferous forests occurred in January and the highest
in October; during the period of 2023.7–2024.6, the lowest relative humidity of
the coniferous forests occurred in January and the highest in September. During
the periods of 2022.7–2023.6 and 2023.7–2024.6, the lowest relative humidity of
the alpine shrubs and alpine meadows occurred in January and the highest in
August. All the coniferous forests, alpine shrubs and alpine meadows showed
that the relative humidity in 2023.7–2024.6 was lower than that in
2022.7–2023.6 (Figure 3).
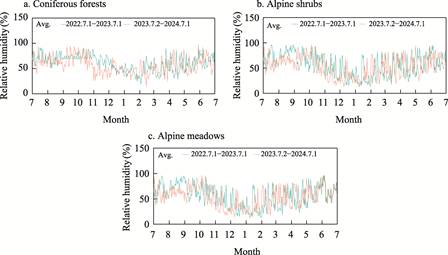
Figure 3 Inter-annual
variation characteristics of atmospheric relative humidity
The
saturated water vapor pressure in the atmosphere gradually decreases with
increasing altitude, following the pattern of coniferous forests > alpine
shrubs > alpine meadows. In the periods of 2022.7–2023.6 and 2023.7–2024.6,
all of the coniferous forests, alpine shrubs, and alpine meadows showed that
the atmospheric saturated water vapor pressure was lower during the Spring
Festival (January–March) and higher during the autumn (July–September). The
coniferous forests, alpine shrubs, and alpine meadows all showed that the
atmospheric saturated water vapor pressure
was the lowest in January and the highest in August (Figure 4).
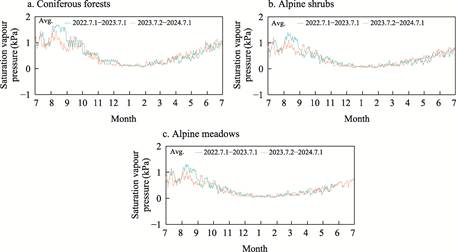
Figure 4 Interannual
variation characteristics of atmospheric saturation water vapor pressure
The atmospheric CO2 concentration gradually
decreases with increasing altitude, following the pattern of coniferous
forests>alpine shrubs>alpine meadows. There is no significant seasonal
difference in the atmospheric CO2 concentration between coniferous
forests and alpine shrubs. The atmospheric CO2 concentration in
alpine meadows is significantly higher in spring and summer (March–August) than
in autumn and winter (September–February of the following year) (Figure 5). The
atmospheric O2 concentration gradually decreases with increasing
altitude, following the pattern of coniferous forests > alpine shrubs >
alpine meadows. The seasonal dynamics of atmospheric O2
concentration in each vegetation type are all such that it is significantly
higher from April to November and then gradually decreases from December to
March of the following year. The alpine meadows and alpine shrubs both show a
single peak curve, with the maximum atmospheric O2 concentration
occurring in August and September (Figure 6).
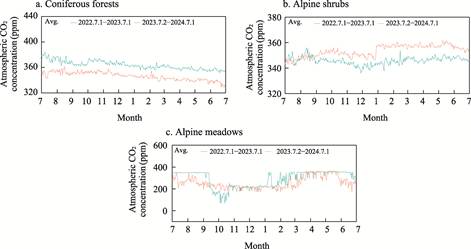
Figure 5 Inter-annual
variation characteristics of atmospheric CO2
concentration
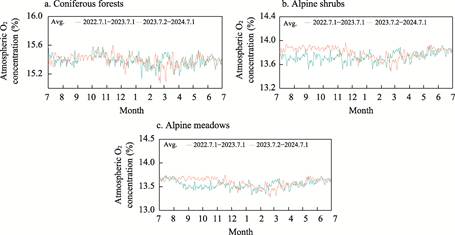
Figure 6 Inter-annual
variation characteristics of atmospheric O2 concentration
The month with the longest sunshine duration is June and
July, with the sunshine duration reaching over 11 h. The shortest sunshine
duration occurs in December, January, and February, with a duration of
approximately 7–9 h. The sunshine duration in other months is all above 10 h.
During the period from 2022.7 to 2023.6, the annual cumulative sunshine
duration was 2,177.49 h, and during the period from 2023.7 to 2024.6, the
annual cumulative sunshine duration was 2,349.81 h. The annual cumulative
sunshine duration from 2023.7 to 2024.6 was 172.32 h more than that from 2022.7
to 2023.6 (Figure 7). The wind direction is mostly southeast wind and east
wind, with relatively low wind speed, and there is no strong wind, with the
maximum wind speed not exceeding 5 m/s (Figure 8).
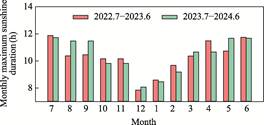
Figure 7
Inter-annual variation
characteristics of monthly sunshine duration
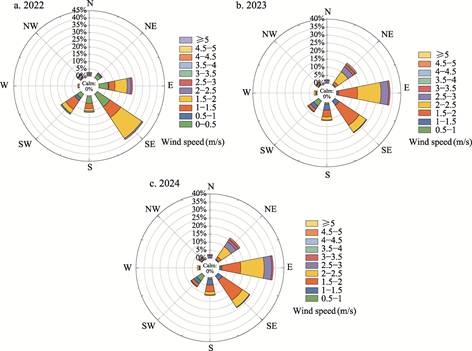
Figure 8 Inter-annual
variation characteristics of wind speed and wind direction
4.2.2 Three
Soil Parameters
The soil temperature in coniferous forests, alpine shrubs and
alpine meadows all showed an increase with the rise of atmospheric temperature,
reaching its maximum in August and then decreasing. In coniferous forests, the
soil temperature from 2023.7 to 2024.6 was lower than that from 2022.7 to
2023.6. In alpine shrublands, the surface (10 cm) soil temperature showed an
increase from 2023.7 to 2024.6 compared to 2022.7 to 2023.6. The deep soil (30
cm and 50 cm) showed a decrease from 2023.7 to 2024.6 compared to 2022.7 to
2023.6. In alpine meadows, the soil temperatures at 10 cm, 30 cm and 50 cm all
showed that 2023.7 to 2024.6 was significantly higher than 2022.7 to 2023.6
(Figure 9).
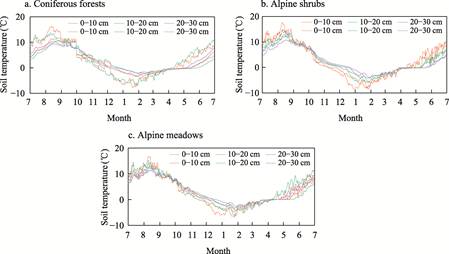
Figure 9 Annual variation
characteristics of soil temperature
The soil
volumetric moisture content is as follows: alpine shrubs>alpine meadows>
coniferous forests. The soil begins to thaw in mid-April to mid-May, and the
soil volumetric moisture content gradually increases. From mid-November to
mid-December, it gradually freezes from the surface to the underground, and the
soil volumetric moisture content drops rapidly. In the coniferous forests, the
soil volumetric moisture content at 30 cm is higher than that at the surface
(10 cm) and the deep layer (50 cm). There is little change in the soil layer
between the high-altitude shrubs. The soil volumetric moisture content at the
surface (10 cm) of the alpine meadows is higher than that in the middle layer
(30 cm) and the deep layer (50 cm). In the period from 2022.7 to 2023.6 and
from 2023.7 to 2024.6, all of the coniferous forests, alpine shrubs and alpine meadows
showed that the soil volumetric moisture content in January to April was
significantly lower than that in other months (Figure 10).
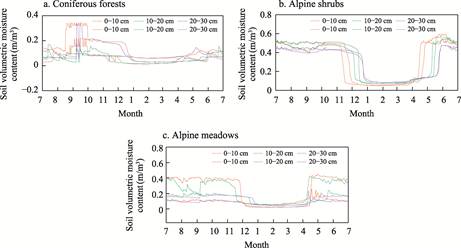
Figure 10 Inter-annual
variation characteristics of soil moisture content
The soil electrical conductivity and soil volumetric moisture
content show the same trend: alpine shrubs > alpine meadows > coniferous
forests. From January to April, the values of soil volumetric moisture content
and soil electrical conductivity were relatively low and stable. From May to
November, the soil volumetric moisture content and soil electrical conductivity
were relatively high but fluctuated greatly. After November, they dropped
rapidly. In the soil layer, the soil electrical conductivity of coniferous
forests and alpine shrubs was higher at 30 cm than at the surface (10 cm) and
deep soil (50 cm). The soil electrical conductivity at the surface (10 cm) of
alpine meadows was higher than that at the middle layer (30 cm) and deep layer
(50 cm) (Figure 11).
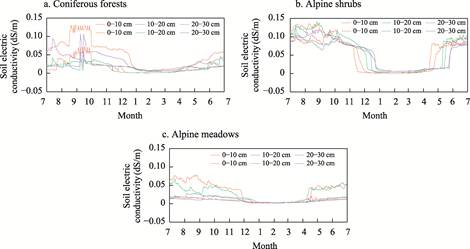
Figure 11 Inter-annual
variation characteristics of soil electrical conductivity
5
Discussion and Discussion
The Qilian Mountains are situated at the center of the
Eurasian continent, adjacent to the northern Xizang Plateau. Influenced by both
continental desert climate and alpine topography, the region exhibits a typical
alpine semi-arid climate[7]. Due to the complex terrain and special
geographical environment, the temperature in the Qinghai section of the Qilian
Mountains National Park shows significant temporal and spatial differences and
has a tendency towards warming and humidification[8]. Climate
warming will change the water and heat conditions within the original
ecosystem, increase the transpiration of above- ground vegetation, and reduce
the soil moisture content[9]. This study found that the longest
sunshine duration in the Qinghai section of the Qilian Mountains National Park
occurs in June and July, while the shortest sunshine duration occurs in
December, January and February of the following year. The predominant wind
directions are southeast wind and east wind, with relatively low wind speeds
and no strong winds, with the maximum wind speed not exceeding 5 m/s.
Atmospheric temperature, humidity, and saturation pressure difference are
related to the terrain and decrease spatially with the increase in altitude.
The distribution follows the pattern of coniferous forests>alpine
shrubs>alpine meadows. Coniferous forests, alpine shrubs, and alpine meadows
all show that the average air temperature during the period of 2023.7–2024.6 is
higher than that during the period of 2022.7–2023.6, which is consistent with
the research results of Yang, et al.[8]. The concentrations
of atmospheric CO2 and O2 both gradually decrease with
increasing altitude. The soil temperature in the Qinghai section of the Qilian
Mountains National Park gradually decreases with altitude, following the
pattern of coniferous forests>alpine shrubs>alpine meadows. The lowest
temperature occurs in January and February, while the highest temperature is in
August. Soil electrical conductivity and soil volumetric moisture content show
the same trend, with alpine shrubs>alpine meadows>coniferous forests. The
soil volumetric moisture content in alpine shrubs is higher, which is related
to the groundwater level in this area. The main influencing factor of soil
moisture in the Qinghai section of the Qilian Mountains National Park is the
groundwater level rather than atmospheric precipitation. Our research team
installed automatic meteorological observation equipment at different altitude
gradients in the Qinghai section of the Qilian Mountain National Park. They
conducted continuous and real-time monitoring of key meteorological elements in
the area, filling the gap in the research on the ecological effects of the
Qilian Mountains National Park in Qinghai under the trend of climate warming.
However, the feedback of mountain ecosystems to climate warming is time-lagged.
The temporal stability of this study may seem insufficient. In the future, our
research team will continue to conduct long-terms, continuous and multi-angle
investigations into the response of the Qilian Mountain ecosystem to global
climate warming, in order to understand the potential changes in high-altitude
ecosystems under the background of future climate warming and their patterns.
Author
Contributions
Bai, L. L. and Wang, W. Y. did the overall design for the
development of the dataset; Luo, Q., Niu, F. Y., Yang, F. K., Ma, Y. M.,
and Wang, Y. X.
collected and processed all the data; Bai, L. L. wrote the data paper.
Conflicts of Interest
The authors declare no conflicts of interest.
References
[1]
Liu, Y. Temporal-spatial
variation in climatic variables and ecological implications in the longitudinal
range-gorge region, Southwest China [D]. Kunming: Graduate University of
Chinese Academy of Sciences (Xishuangbanna Tropical Botanical Garden), 2008.
[2]
Körner, C. The use of
‘altitude’ in ecological research [J]. Trends in ecology and evolution,
2007, 22(11): 569–574.
[3]
Beniston,
M. Mountain weather and climate: a general overview and a focus on climatic
change in the Alps [J]. Hydrobiologia, 2006,
562(1): 3–16.
[4]
Rong, Z. L. Impacts of
climate change on dominant species distribution and vegetation patterns in the
Qilian Mountains [D]. Lanzhou: Lanzhou University, 2019.
[5]
Bai, L. L., Wang, W. Y., Luo, Q., et al. Dataset conducted from three in situ
soil-atmosphere sites of Qilian Mountains National Park (2022.7–2024.6)
[J/DB/OL]. Digital Journal of Global Change Data Repository,
2025. https://doi.org/10.3974/geodb.2025.10.09.V1.
[6]
GCdataPR Editorial Office.
GCdataPR data sharing policy [OL]. https://doi.org/10.3974/dp.policy.2014.05
(Updated 2017).
[7]
Zhao, Y. H. Response of
Qinghai Spruce (Picea crassifolia Kom.) to hydrothermal drivers in the
middle section of the Northern Qilian Mountains [D]. Lanzhou: Gansu
Agricultural University, 2018.
[8]
Yang, F., Zhang, W. T., Zhang,
F, M., et al. Climatic characteristics and changes in the Qilian
Mountains from 1961 to 2022 [J]. Arid Zone Research, 2024, 41(10):
1627–1638.
[9]
Zhang, Y. Responses of
vegetation-soil-microbial system to precipitation change and warming in Ningxia
Desert Steppe [D]. Yinchuan: Ningxia University, 2022.