Dataset
Development of Yearly Phenological Parameters During
Vegetation Growing Season in Northern Hemisphere based on Fengyun Satellites
Images (2011–2019)
WANG Ning1,2
WU Ling2 JIAO Quanjun1* HUANG Wenjiang1,3 ZHANG Bing1,3
1. State Key Laboratory of Remote Sensing and Digital Earth,
Aerospace Information Research Institute, Chinese Academy of Sciences, Beijing 100094,
China;
2. School of Artificial
Intelligence, China University of Geosciences, Beijing 100083, China;
3. University of Chinese
Academy of Sciences, Beijing 100049, China
Abstract: The vegetation growing season serves as a sensitive
indicator of terrestrial ecosystem responses to climate change. Accurate
monitoring of its key parameters is crucial for understanding
vegetation-environment interactions, assessing carbon sink capacity, and
evaluating the ecological impacts of global climate change. The yearly
phenological parameters during the vegetation growing season in the Northern Hemisphere
from Fengyun Satellites (from 2011 to 2019) were developed using a
double-baseline dynamic threshold method, integrated with long-term NDVI time
series data from Fengyun-3B satellite. The phenological parameters are the
start date, end date, and length of the growing season. The dataset includes:
(1) yearly vegetation growing season phenological parameters from 2011 to 2019;
(2) multi-year average growing season phenological parameters. It has a spatial
resolution of 0.05°. The
dataset is archived in .tif data format, and consists of 30 data files with
data size of 652 MB (compressed into one single file with 102 MB).
Keywords: Northern
Hemisphere; vegetation growing season; Fengyun
satellite; dynamic threshold method
DOI: https://doi.org/10.3974/geodp.2026.04.06
Dataset Availability Statement:
The dataset
supporting this paper was published and is accessible through the Digital
Journal of Global Change Data Repository at:
https://doi.org/10.3974/geodb.2025.12.05.V1.
1 Introduction
Vegetation
phenology refers to the annual seasonal phenomena exhibited by plants during
their growth process, influenced by the combined effects of climate and
surrounding environmental factors such as temperature, precipitation, soil
conditions, and human activities. It manifests as a cyclical process of
vegetation transitioning from dormancy to growth, senescence, and back to
dormancy[1]. As a sensitive indicator of terrestrial ecosystem
responses to global climate change, the vegetation growing season phenology not
only directly reflects the interaction mechanisms between vegetation and the
environment but also serves as a critical biological indicator of ecosystem
carbon and water cycles and energy balance[2]. Therefore, accurate
monitoring of vegetation growing season phenological parameters (such as the
start and end dates of the growing season) is essential for assessing ecosystem
carbon sink functions and uncovering the pathways through which climate change
impacts the biosphere[3].
Remote sensing
technology, with its capacity for continuous and large-scale vegetation
spectral monitoring, has become a crucial means for achieving large-scale,
long-term time series vegetation phenology retrieval. For global and
hemispheric scale studies, commonly used data sources include the SPOT-VGT
sensor[4], Terra/Aqua Moderate Resolution Imaging Spectroradiometer
(MODIS)[5], and the NOAA Advanced Very High Resolution Radiometer
(AVHRR)[6]. At regional and local scales, the application of
Landsat, Sentinel-2, and spatiotemporally fused data is more widespread.
Currently, phenology extraction algorithms based on biophysical characteristics
such as the Normalized Difference Vegetation Index (NDVI) are widely employed
to derive phenological parameters including the start and end of the growing
season.
The Fengyun-3
(FY-3) series, as China’s second-generation polar-orbiting meteorological
satellites, is equipped with the Visible Infrared Imaging Radiometer (VIRR),
enabling the acquisition of global, all-weather remote sensing data. Among
them, FY-3B an operational satellite inheriting and enhancing all core payloads
from its predecessor has demonstrated significant efficacy in meteorological
and oceanic applications, including sea surface temperature retrieval[7],
soil moisture monitoring[8], and snow cover identification[9],
since it became operational in 2011. However, its potential in terrestrial
ecosystems, particularly for extracting vegetation phenological parameters,
remains underexplored and inadequately validated, thus restricting the in-depth
application of domestic satellite data in ecological remote sensing.
The Gross Primary Productivity (GPP), as the largest CO2 flux
in the global carbon cycle and closely linked to vegetation photosynthesis, has
become an important reference for validating remotely sensed phenology results
in recent years. Based on FY-3B satellite data (2011–2019), this study
reconstructs vegetation index time series by integrating Hampel and
Savitzky-Golay filters, and proposes an improved double-baseline dynamic
threshold algorithm to systematically extract key phenological parameters across
the Northern Hemisphere. Then authors use FLUXNET site-based GPP observations to
validate the accuracy of the extracted vegetation phenological parameters in
the Northern Hemisphere. The research aims to evaluate the potential of Fengyun
satellites in vegetation phenology monitoring. Through
comparative analysis with MODIS phenological products (MCD12Q2)[10],
it reveals the spatiotemporal patterns and interannual variation
characteristics of vegetation growing season phenological parameters in the
Northern Hemisphere from 2011 to 2019, thereby providing a scientific basis for
expanding the application of FY satellites in terrestrial ecosystem dynamic
monitoring.
2 Metadata of the Dataset
The metadata of
Yearly phenological parameters during vegetation growing season in Northern
Hemisphere based on Fengyun satellites images (2011–2019)[11] dataset
is summarized in Table 1. It includes the dataset full name, short name,
authors, year of the dataset, temporal resolution, spatial resolution, data
format, data size, data files, data publisher, and data sharing policy, etc.
Table 1 Metadata summary of the Yearly phenological parameters
during vegetation growing season in Northern Hemisphere based on Fengyun satellites
images (2011–2019)
|
Items
|
Description
|
|
Dataset full name
|
Yearly phenological parameters during vegetation
growing season in Northern Hemisphere based on Fengyun satellites images
(2011–2019)
|
|
Dataset short name
|
FY_GS_2011-2019
|
|
Authors
|
Wang, N., Aerospace Information Research Institute,
Chinese Academy of Sciences, China University of Geosciences,
wangning981229@163.com
Wu, L., China University of Geosciences,
wuling@cugb.edu.cn
Jiao, Q. J., Aerospace Information Research
Institute, Chinese Academy of Sciences, jiaoqj@aircas.ac.cn
Huang, W. J., Aerospace Information Research
Institute, Chinese Academy of Sciences, University of Chinese Academy of
Sciences, huangwj@aircas.ac.cn
Zhang, B., Aerospace Information Research Institute,
Chinese Academy of Sciences, University of Chinese Academy of Sciences,
zhangbing@aircas.ac.cn
|
|
Geographical region
|
0°N–90°N,
–180°–180°
|
|
Year
|
2011–2019
|
|
Temporal resolution
|
Year
|
|
Spatial resolution
|
0.05°×0.05°
|
|
Data format
|
.tif
|
|
|
|
Data size
|
652 MB
|
|
|
|
Data files
|
Yearly vegetation growing season phenological
parameters from 2011 to 2019; Multi-year average growing season phenological
parameters
|
|
Foundations
|
Fengyun Application Pioneering Project of China
Meteorological Administration (FY-APP); National Natural Science Foundation
of China (42071330)
|
|
Data computing environment
|
Matlab 2021b
|
|
Data publisher
|
Global Change
Research Data Publishing & Repository, http://www.geodoi.ac.cn
|
|
Address
|
No. 11A, Datun Road, Chaoyang District,
Beijing 100101, China
|
|
Data sharing policy
|
(1) Data
are openly available and can be free downloaded via the Internet; (2) End
users are encouraged to use Data
subject to citation; (3) Users, who are by definition also value-added
service providers, are welcome to redistribute Data subject to written permission from the GCdataPR Editorial
Office and the issuance of a Data
redistribution license; and (4) If Data
are used to compile new datasets, the “ten percent principle” should be
followed such that Data records
utilized should not surpass 10% of the new dataset contents, while sources
should be clearly noted in suitable places in the new dataset[12]
|
|
Communication and searchable
system
|
DOI, CSTR, Crossref, DCI,
CSCD, CNKI, SciEngine, WDS, GEOSS, PubScholar, CKRSC, OARL
|
3 Methods
This
dataset was primarily derived from the FY-3B VIRR NDVI product[13],
which features a spatial resolution of 0.05°and a temporal resolution of 1 year.
The data were acquired from the Fengyun Satellite Remote Sensing Data Service
System of the National Meteorological Center of China,
covering the period from 2011 to 2019.
3.1 Algorithm
(1) Hampel filtering
The FY-3B NDVI data were first processed
using Hampel filtering[14] to replace outliers. The core principle
of the Hampel filter is to perform local anomaly detection for each data point
using the median and median absolute deviation (MAD), and replace identified
outliers. This approach effectively suppresses the influence of outliers while
preserving the main characteristics of the signal.
(2) Savitzky-Golay filtering
This dataset employs the Savitzky-Golay
(S-G) filter[15] method to fit the NDVI time series data. The S-G
filter can maximally preserve the original shape of the curve and avoid
over-smoothing. The calculation method of S-G filtering is as follows:
 (1)
(1)
where  denotes the original NDVI value,
  represents the
smoothed NDVI,
represents the
smoothed NDVI,  refers to the
filter coefficients,
refers to the
filter coefficients,  corresponds to
the NDVI value of the
corresponds to
the NDVI value of the  image within the
sliding window, and
image within the
sliding window, and  indicates the
width of the sliding window. i represents the relative position within
the sliding window, m is the half-width of the window.
indicates the
width of the sliding window. i represents the relative position within
the sliding window, m is the half-width of the window.
(3) Double-baseline dynamic threshold
method
Phenological parameter extraction commonly
employs the dynamic threshold method[16]. This method calculates a
single minimum vegetation index value for the entire year to identify all
phenological parameters. However, it overlooks the fact that in practice, the
background signals before and after the vegetation growing season (spring and
autumn) are not identical. This discrepancy arises due to annual variations in
factors such as residual green vegetation growth conditions, key temperature
and precipitation patterns, snow cover, and soil moisture during the period
corresponding to the minimum vegetation index value[17]. Therefore,
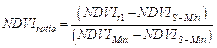
this study proposes an improved double-baseline dynamic threshold method. Based
on the distinct temporal changes in NDVI during vegetation green-up and
senescence phases, the thresholds for the start and end of the growing season
are calculated using their respective minimum values and amplitudes.
Specifically, for the start of the growing season, the minimum NDVI value
during the green-up phase is selected to calculate the amplitude and determine
the start of the growing season (SOS). For the end of the growing season, the
minimum NDVI value during the senescence phase is used to calculate the
amplitude and determine the end of the growing season (EOS). The difference
between the two gives the length of the growing season (LOS). In this study,
the relative NDVI threshold is set at 40%, and the calculation formula is as
follows:
 (2)
(2)
 (3)
(3)
where  denotes the
threshold ratio,
denotes the
threshold ratio,  and
and  represent the
NDVI value during the periods from green-up to the growth peak
represent the
NDVI value during the periods from green-up to the growth peak  and from the
growth peak to senescence t2,
and from the
growth peak to senescence t2, is the maximum annual NDVI value at the growth peak,
  /
/ refer to the minimum NDVI values during the annual
rising/falling phases, the differences between and/ represent the amplitude of NDVI variation during vegetation
growth and senescence phases, respectively, and
refer to the minimum NDVI values during the annual
rising/falling phases, the differences between and/ represent the amplitude of NDVI variation during vegetation
growth and senescence phases, respectively, and  is the Julian day
(d).
is the Julian day
(d).
(4) Trend analysis
The Theil-Sen (TS) estimator and
Mann-Kendall (MK) test, two non-parametric methods, were employed to
investigate the spatiotemporal trends of vegetation growing season phenological
parameters in the Northern Hemisphere[18]. The TS estimator was used
to analyze the trend in time series data, while the MK test was applied to
assess the significance of detected changes. Both methods offer strong
resistance to noise and do not require the data to follow any specific
distribution.
3.2 Technical Route
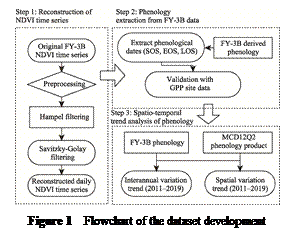 The dataset development
process primarily involved 3 key steps: reconstruction of vegetation index time
series, extraction of growing season phenological parameters, and analysis of
their spatiotemporal trends (Figure 1).
The dataset development
process primarily involved 3 key steps: reconstruction of vegetation index time
series, extraction of growing season phenological parameters, and analysis of
their spatiotemporal trends (Figure 1).
The raw data
underwent initial preprocessing, during which pixels with NDVI values below 0.2
were removed, as such low-value areas
typically represent non-vegetated regions[19]. To mitigate the
impact of noise on the NDVI time series, the data were then interpolated
and reconstructed. Specifically, Hampel filtering was applied for preliminary
denoising to identify and replace outliers with the median value within the
moving window. This step effectively suppressed the influence of outliers while
preserving the primary signal characteristics. Subsequently, the interpolated
time series data were smoothed using Savitzky-Golay filtering. Vegetation
phenological parameters were then extracted using the double-baseline dynamic
threshold method, with the threshold set as a dynamic value equal to 40% of the
difference between the maximum and minimum NDVI. Finally, we compared the
phenological information from this dataset with the MCD12Q2 product to
investigate the spatiotemporal trends of vegetation growing season phenological
parameters in the Northern Hemisphere from 2011 to 2019.
4 Data Results and Validation
4.1 Dataset Composition
The Yearly
phenological parameters during vegetation growing season in Northern Hemisphere
based on Fengyun satellites images (2011–2019) contains information on
vegetation growing season phenological parameters in the Northern Hemisphere
from 2011 to 2019, including the start day, end day, and length of the growing
season. Specifically, it comprises 30 data files, including yearly and
multi-year averages of SOS, EOS, and LOS, archived in .tif format with a
spatial resolution of 0.05° (Table 2).
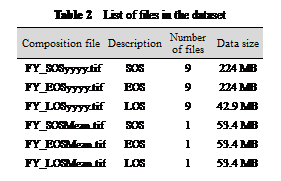 In this dataset, the start of the growing season (SOS), end of the growing
season (EOS), and length of the growing season (LOS) are respectively archived
in files named FY_SOSyyyy.tif, FY_EOSyyyy.tif, and FY_LOSyyyy.tif. Their
corresponding multi-year averages are named
FY_SOSMean. tif, FY_EOSMean.tif, and FY_LOSMean. tif. Here, “FY” stands
for the Fengyun Satellite Vegetation Phenology Dataset, “yyyy” denotes the
specific year.
In this dataset, the start of the growing season (SOS), end of the growing
season (EOS), and length of the growing season (LOS) are respectively archived
in files named FY_SOSyyyy.tif, FY_EOSyyyy.tif, and FY_LOSyyyy.tif. Their
corresponding multi-year averages are named
FY_SOSMean. tif, FY_EOSMean.tif, and FY_LOSMean. tif. Here, “FY” stands
for the Fengyun Satellite Vegetation Phenology Dataset, “yyyy” denotes the
specific year.
4.2 Data Products
By
applying the double-baseline dynamic threshold method to FY-3B NDVI time series
data, the authors extracted a dataset of annual vegetation growing season
phenological parameters for the Northern Hemisphere spanning 2011 to 2019.
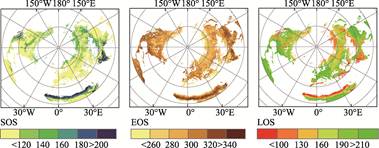
Based on these yearly results, the 9-year average spatial distribution of
vegetation phenology was further calculated (Figure 2). The analysis reveals
that, during the study period, the start of the vegetation growing season in
the Northern Hemisphere primarily occurred between Julian days 105 and 125,
while the end date mainly fell between days 265 and 305. Spatially, the
phenology exhibits a clear latitudinal zonality and distinct land-sea
differentiation. With increasing latitude, the start of the growing season is
progressively delayed, whereas its end date advances significantly. This
pattern results in a more compressed growing season window at high latitudes,
leading to a progressive shortening of the overall growing season length from
low to high latitudes. This spatial distribution suggests that the growing
season length in high-latitude regions is more strongly constrained by
temperature limitations. In terms of land-sea contrasts, vegetation
phenological characteristics at similar latitudes show significant differences due
to varying climate regimes. In Western Europe, moderated by a maritime climate
characterized by milder winters and earlier spring warming, the start of the
growing season generally occurs earlier than in inland East Asia, which is
dominated by a continental climate. This reflects the buffering effect of the
ocean on thermal conditions. Conversely, in maritime climate regions on the
western edges of continents, where autumn cooling is gradual, the end of the
growing season is notably later than in areas at the same latitude on the
eastern continental margins. The difference in growing season length between
western and eastern coastal regions further underscores the significant
influence of land-sea thermal processes on the annual cycle dynamics of vegetation
phenology.
Figure
2 Mean
phenological parameters of vegetation in the Northern Hemisphere (2011–2019)
4.3 Data Validation
The
authors utilized the photosynthetic activity of Gross Primary Productivity
(GPP) to evaluate and validate satellite-derived vegetation growing season
phenology. The GPP data were obtained from the FLUXNET 2015 Tier 1 dataset, and we
selected Eddy Covariance (EC) observations from flux tower sites in the
Northern Hemisphere. This dataset enables long-term monitoring of ecosystem
carbon fluxes, such as Net Ecosystem Exchange (NEE), through EC technology.
Daily-scale daytime partitioned GPP data (GPP_DT_VUT_REF)[20] for
the period 2011–2014 were estimated by applying the Daytime partitioning method
(DT) and the Variable Ustar Threshold (VUT)
filtering approach to the gap-filled NEE data. A comparison between FY-derived
phenology extracted using different methods and ground-based GPP observations
is presented in Figure 3. The results indicate that phenological
metrics
(particularly EOS and LOS) extracted by the double-baseline dynamic threshold
method are significantly more accurate than those obtained from the traditional
dynamic threshold method. Specifically, the method yielded a higher coefficient
of determination (R2) alongside notably lower Root Mean
Square Error (RMSE) and Mean Absolute Error (MAE). These findings demonstrate
that Northern Hemisphere vegetation phenology derived from the double-baseline
dynamic threshold method exhibits better consistency with ground-based GPP
phenology.
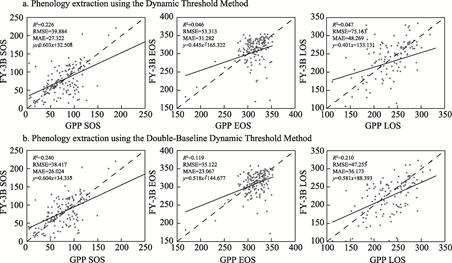
Figure 3 Accuracy verification
chart of FY dataset based on GPP phenology data
In remote sensing studies of vegetation phenology, cross-comparison
and validation using multi-source remote sensing data serve as a critical
approach for assessing dataset reliability and understanding trend uncertainty.
To evaluate the performance of the FY dataset in revealing long-term vegetation
phenological trends, the authors conducted a comparative analysis with the
widely used MCD12Q2 phenological product. Results based on trend analysis
(Figure 4) show that both datasets indicate an overall advancing trend in
vegetation growing season phenological parameters across the Northern
Hemisphere from 2011 to 2019, a temporal pattern consistent with findings
reported by Jiang, et al.[21]
As shown in the spatial distribution of
Northern Hemisphere phenological trends (Figure 5), both the FY and MCD12Q2
datasets show generally low interannual variability in vegetation phenology
across most mid-latitude to high-latitude regions. In contrast, more
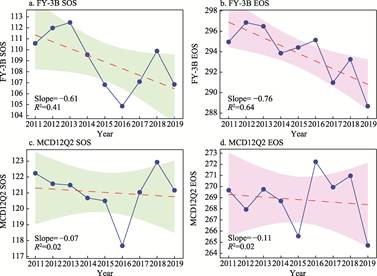
Figure 4
Interannual of trend comparison between FY and MCD12Q2 datasets
(the shaded areas represent the 95% confidence intervals)
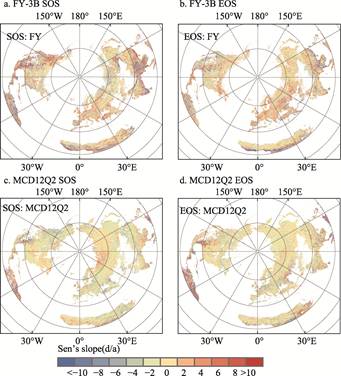
Figure 5 Comparison of spatial trends between FY
and MCD12Q2 datasets
pronounced
phenological variations are observed in mid-latitude areas such as the
central-western United States, the Mediterranean region of Europe, and India,
as well as in low-latitude regions including equatorial Africa and northern
South America. These notable changes are likely linked to stronger vegetation
dependence on precipitation and higher interannual rainfall variability in
these regions. Overall, the FY satellite phenology dataset and the MCD12Q2
product exhibit consistent spatial patterns in growing-season phenological
trends, with their geographical differences reflecting the varying responses of
vegetation phenology to climatic drivers across regions.
5 Discussion and Conclusion
This
study developed a dataset of vegetation growing-season phenological parameters
for the Northern Hemisphere (2011–2019) based on FY-3B satellite NDVI time
series and an improved double-baseline dynamic threshold method. The results
indicate that the double-baseline method achieves higher accuracy for key
phenological parameters from Fengyun satellite data than the conventional
dynamic threshold approach. The dataset validates the application potential of FY
satellites in vegetation phenology remote sensing and provides data to support
for understanding vegetation phenological patterns and their climatic drivers
across the Northern Hemisphere. However, the study has several limitations.
First, data gaps exist in certain regions, such as near the Arctic Circle and
in subtropical coastal areas, largely due to persistent cloud cover. Second, in
multi-cropping agricultural systems region (e.g., the winter wheat-summer maize
rotation region of the North China Plain), the algorithm, which was designed
for natural vegetation growing seasons, shows uncertainty in interpreting
complex crop phenology signals. Future improvements could combine time-series
interpolation with crop-stage-specific monitoring methods to enhance the
dataset’s completeness and regional applicability.
Author
Contributions
Jiao, Q. J. conceived and
designed the overall framework for the dataset algorithm, product development,
and the study. Wu, L. optimized the technical solutions and revised the paper.
Huang, W. J. guided the product application analysis. Zhang, B. defined the
research scope for the product. Wang, N. implemented the algorithms, generated
the data products, and authored the data paper.
Acknowledgements
We acknowledge the Fengyun
satellite data provided by the National Satellite Meteorological Center of
China. This work was also supported by the National Key Research and
Development Program of China (2018YFB0504900, 2018YFB0504905) for technical
assistance in data processing.
Conflicts
of Interest
The authors declare no conflicts of interest.
References
[1]
Wang, Y. P., Liu, Q. Y., Li, R.,
et al. Remote sensing of vegetation phenology in the northern hemisphere
from multi-channel passive microwave measurements of Chinese FengYun-3D
satellite [J]. Remote Sensing of Environment, 2025, 330: 114997.
[2]
Berra, E. F., Gaulton, R.
Remote sensing of temperate and boreal forest phenology: a review of progress,
challenges and opportunities in the intercomparison of in-situ and satellite
phenological metrics [J]. Forest Ecology and Management, 2021, 480:
118663.
[3]
Xie, Z. Y., Zhu, W. Q., He, B.
K., et al. A background-free phenology index for improved monitoring of
vegetation phenology [J]. Agricultural and Forest Meteorology, 2022,
315: 108826.
[4]
Hou, X. H., Niu, Z., Gao, S., et
al. Monitoring vegetation phenology in farming-pastoral zone using SPOT-VGT
NDVI data [J]. Transactions of the Chinese Society of Agricultural
Engineering, 2013, 29(1): 142–150.
[5]
Xu, W. F., Ma, H. Q., Wu, D. H.,
et al. Assessment of the daily cloud-free MODIS snow-cover product for
monitoring the snow-cover phenology over the Qinghai-Tibetan Plateau [J]. Remote
Sensing, 2017, 9(6): 585.
[6]
Shao, Q., Huang, C., Xiao, Y.
J., et al. Selecting of global phenological field observations for
validating coarse AVHRR-derived forest
phenology products based on spatial heterogeneity and temporal consistency [J].
Ecological Informatics, 2025: 103216.
[7]
Zhang, M., Chen, L., Xu, N., et
al. Influences of earth incidence angle on FY-3/MWRI SST retrieval and
evaluation of reprocessed SST [J]. Journal of Tropical Meteorology,
2024, 30(3): 230–240.
[8]
Zhang, P., Yu, H. B., Zhang, Q.
F., et al. Applicability evaluation of FY-3B/3C and AMSR2 soil moisture
products in Xilingol Grassland [J]. Chinese Journal of Agrometeorology,
2023, 44(3): 238–251.
[9]
Zhou, Z., Zhu, L. L., Zhang, Y.
H., et al. Downscaling machine learning snow depth inversion on the
Qinghai-Xizang Plateau based on FY-3B passive microwave data [J]. Journal of
Glaciology and Geocryology, 2024, 46(2): 539–554.
[10]
D’Odorico, P., Gonsamo, A.,
Gough, C. M., et al. The match and mismatch between photosynthesis and
land surface phenology of deciduous forests [J]. Agricultural and Forest
Meteorology, 2015, 214: 25–38.
[11]
Wang, N., Wu, L., Jiao, Q. J.,
et al. Yearly phenological parameters during vegetation growing season in
Northern Hemisphere based on Fengyun satellites images (2011–2019) [J/DB/OL]. Digital Journal of Global Change Data Repository, 2025. https://doi.org/10.3974/geodb.2025.12.05.V1.
[12]
GCdataPR Editorial Office.
GCdataPR data sharing policy [OL]. DOI: 10.3974/dp.policy.2014.05 (Updated
2017).
[13]
Xian, D., Zhang, P., Gao, L., et
al. Fengyun meteorological satellite products for earth system science
applications [J]. Advances in Atmospheric Sciences, 2021, 38(8): 1267–1284.
[14] Pearson, R. K., Neuvo, Y., Astola, J., et al. Generalized
hampel filters [J]. EURASIP Journal on Advances in Signal Processing,
2016, 2016(1): 87.
[15] Li, S., Xu, L., Jing, Y. H., et al. High-quality vegetation
index product generation: a review of NDVI time series reconstruction
techniques [J]. International Journal of Applied Earth Observation and
Geoinformation, 2021, 105: 102640.
[16] White, M. A., Thornton, P. E., Running, S. W. A continental
phenology model for monitoring vegetation responses to interannual climatic
variability [J]. Global Biogeochemical Cycles, 1997, 11(2): 217–234.
[17] Garrity, S. R., Bohrer, G., Maurer, K. D., et al. A
comparison of multiple phenology data sources for estimating seasonal
transitions in deciduous forest carbon exchange [J]. Agricultural and Forest
Meteorology, 2011, 151(12): 1741–1752.
[18] Zhang, J., Zhao, J. J., Wang, Y. Q., et al. Comparison of
land surface phenology in the Northern Hemisphere based on AVHRR GIMMS3g and
MODIS datasets [J]. ISPRS Journal of Photogrammetry and Remote Sensing,
2020, 169: 1–16.
[19]
Shao, Y. T., Wang, J. L.
Vegetation phenology dataset in Mongolia [J]. Journal of Global Change Data &
Discovery, 2022, 6(2): 241–248.
https://doi.org/10.3974/geodp.2022.02.10.
[20]
Zhou, L., Zhou, W., Chen, J. J.,
et al. Land surface phenology detections from multi-source remote
sensing indices capturing canopy photosynthesis phenology across major land
cover types in the Northern Hemisphere [J]. Ecological Indicators, 2022,
135: 108579.
[21] Jiang, B. H., Chen, W., Chen, S. Y., et al. Comparison of the
capability and performance of “photosynthesis”
and “structure” indices in retrieving vegetation phenology in the Northern
Hemisphere [J]. GIScience & Remote Sensing, 2025, 62(1):
2473127.