Dataset
Development of Urban Built Environment Assessment
Unit (2022)
Zhang, S. J. Li, M.* Dan, B. Y. Han, J. B. Hao, L. Q.
China Academy of Urban Planning & Design,
Beijing 100044, China
Abstract:
Urban built-up area and core built-up area are the basic units for urban
built-up environmental assessment, and their size directly affects the level of
built-up environmental indicators. This paper makes full use of the advantages
of multi-source big data, formulates a unified delineation method and technical
process, and produces a dataset of built-up areas and core built-up areas of 19
cities, including Beijing and Shanghai, etc. (2022). For built-up area, the
proportion of impervious surface, road network, POI density and population
density are comprehensively considered, and high-resolution imagery are used to
form a delineation index system and method for built-up area, and the scope of
urban built-up area is scientifically and quickly delineated at the grid scale
of 500 m×500 m. For the core built-up area, the scope of the
core built-up areas of key cities is delineated through 4 steps: identifying
urban centers, identifying high-density streets and towns, verifying the main
functional areas and facilities of the city, and deducting the open space of
large non-construction land. By unifying the data sources and delineation
methods, 2 basic spatial ranges with horizontal comparability in the research
of urban built environment assessment are formed. The dataset is archived in
.shp format and consists of 16 data files with a data size of 2.23 MB
(compressed into 1 file, 1.37 MB).
Keywords: built-up area; core built-up
area; big data; urban built environment
DOI: https://doi.org/10.3974/geodp.2025.04.05
Dataset Availability Statement:
The
dataset supporting this paper was published and is accessible through the Digital
Journal of Global Change Data Repository at:
https://doi.org/10.3974/geodb.2025.03.09.V1.
1 Introduction
As
a space that centrally carries urban basic public service facilities, the
characterization of urban built environment has always attracted the attention
of scholars. By calculating the population density, construction intensity,
commercial density, transportation accessibility, land use mixing and other
indicators within this range, the characteristics of the urban built
environment in terms of social and economic development and spatial form can be
evaluated, which can provide an objective and accurate understanding of the
current situation for urban physical examination and urban renewal, and then
promote the city to achieve high-quality development goals.
The urban
built-up area is where urban development and construction are concentrated, the
area where the main urban functions are arranged, and is also the key area for
urban construction and management. It represents the macro level of
understanding the overall characteristics of the built environment in the city.
The population density and the level of public facility services within the
built-up area are significantly higher than those in surrounding rural areas,
and the natural environment and land use patterns also differ greatly from
rural areas. As a meso-analysis unit, the urban core built-up area is located
in the central urban area, with high population density and construction
intensity, and accommodating core urban functions and facilities. It aids in
the in-depth analysis of built environment characteristics, such as population
density and construction intensity. Based on multi-source big data, this paper
has produced the boundaries of the built-up areas and core built-up areas for
19 cities in our country.
The traditional
method for delineating built-up area is inherently subjective. Urban planners
or city construction managers determine the scope of urban built-up area in a
balanced manner, considering the actual construction of the city, the service
areas of public and utility facilities, and the degree of connection between
social and economic activities and the urban center. Population density, a key
indicator reflecting the intensity of economic activities, was once a
significant criterion for distinguishing towns. However, the statistical units
that can publicly access population data are typically large, and the
demographic statistics cycle is lengthy, making it challenging to promptly and
objectively reflect the dynamic changes in urban areas.
The emergence of
remote sensing data and new big data provides new data support and technical
ideas for the study of boundary delineation in built-up area. At present, there
are 2 main types of built-up area boundaries based on new big data extraction:
single-element method and multi-element comprehensive method. The
single-element method extracts the built-up area boundary by directly setting a
threshold for a determinant or constructing a combined index and then setting
the threshold. Night light remote sensing data offer an intuitive and
comprehensive reflection of human social and economic activities on the ground,
and its advantages of wide format, high temporal resolution, and free access
provide a good data basis for the extraction of boundaries in urban built-up
area[1,2]. POI (Point of Interest ) data can spatially reflect the
distribution characteristics of urban structure and road skeleton, and can
reflect the urban agglomeration effect and scale effect. The difference in the
spatial distribution of density reflects different regional development levels
and is highly correlated with the distribution of urban built-up area, and the
boundaries of urban built-up area can be extracted by setting POI density
thresholds[3]. In order to overcome the problem that a single
element can only reflect a certain aspect of the built-up area and cause
extraction bias, some scholars have proposed to combine night lighting data
with big data such as POI and road network to improve the extraction accuracy
of built-up area[4,5]. However, due to the inevitable
“oversaturation” and “spillover” phenomenon of lighting data at night, and its
low spatial resolution, the extraction accuracy is greatly limited in the
extraction process of built-up areas. Based on the definition of built-up area,
this paper proposes a method to scientifically and quickly extract the
boundaries of built-up area at the grid scale by synthesizing multi-dimensional
discriminant factors such as statistical data, remote sensing interpretation
data, electronic navigation road network data, POI point of interest data, and
Baidu LBS (Location Based Services) data.
The concept of
core built-up area is close to the concepts of inner city and urban central
area, and the research on their delineation methods is even more multi-source.
From the perspective of the smallest units delineated, there are blocks, roads,
and administrative boundaries, which are mainly used for the planning and
control of building forms according to the division of blocks[6,7],
and the division of roads is mainly used for the division of central areas[8].
Chang, et al. used administrative boundaries as the basis for the circle
to compare the scale and density of Beijing and other international cities in
each circle[9]. Wang, et al. delineated the basic units of
density distribution based on the boundaries of street and town administrative
units[10]. In terms of delineation factors, Shi analyzed various
definition criteria, including spatial texture, road network density,
population density, etc., and proposed specific measurement methods such as the
“public service facility index method”[11,12]. Based on the
boundaries of streets and towns, this paper comprehensively uses the
determinant factors such as local activity population density, construction
intensity, main functional areas such as commercial centers and office centers,
and the spatial distribution of large public facilities at the city level to
delineate the boundaries of the core built-up areas of 19 cities.
2 Metadata of the Dataset
The metadata for the Dataset of assessment units for
19 urban built environment of China based on multi-source data (2022)[13],
including the title, authors, geographical region, data
format, data size, data files, etc., is summarized in Table 1.
Table 1 Summary of
metadata of Dataset of assessment units for 19 urban
built environment of China based on multi-source data (2022)
|
Items
|
Description
|
|
Dataset full name
|
Dataset of
assessment units for 19 urban built environment of China based on
multi-source data (2022)
|
|
Dataset short
name
|
BuiltUpUnits
|
|
Authors
|
Zhang, S. J.,
China Academy of Urban Planning & Design, 115417592@qq.com
Li, M., China
Academy of Urban Planning & Design, limeng_go_for_it@163.com
Dan, B. Y., China
Academy of Urban Planning & Design, browndby@163.com
Han, J. B., China
Academy of Urban Planning & Design, hanjingbei@163.com
Hao, L. Q., China
Academy of Urban Planning & Design, 1175513356@qq.com
|
|
Geographical
region
|
19 Cities in
China: Beijing, Shanghai, Guangzhou, Shenzhen, Tianjin, Chongqing, Jinan,
Qingdao, Nanjing, Hangzhou, Zhengzhou, Wuhan, Changsha, Chengdu, Kunming, Xi’an,
Harbin, Shenyang, Dalian
|
|
Year
|
2022
|
|
Data format
|
.shp
|
|
|
|
Data size
|
2.23 MB
|
|
|
|
Data files
|
Data on the
boundaries of built-up areas and core built-up areas of 19 cities
|
|
Data publisher
|
Global Change Research Data Publishing & Repository,
http://www.geodoi.ac.cn
|
|
Address
|
No. 11A, Datun
Road, Chaoyang District, Beijing 100101, China
|
|
Data sharing
policy
|
(1) Data are openly available and can be
free downloaded via the Internet; (2) End users are encouraged to use Data subject to citation; (3) Users,
who are by definition also value-added service providers, are welcome to
redistribute Data subject to written permission from the GCdataPR Editorial
Office and the issuance of a Data
redistribution license; and (4) If Data
are used to compile new datasets, the “ten percent principal” should be
followed such that Data records
utilized should not surpass 10% of the new dataset contents, while sources
should be clearly noted in suitable places in the new dataset[14]
|
|
Communication and searchable system
|
DOI, CSTR,
Crossref, DCI, CSCD, CNKI, SciEngine, WDS, GEOSS, PubScholar, CKRSC
|
3 Methods
Based
on the definition of built-up area and core built-up area, this study makes
full use of the advantages of multi-source big data, comprehensively considers
urban population, buildings, road networks, POI, land use and other factors,
formulates a unified delineation method and technical process, and produced the
datasets of built-up areas and core built-up areas in 19 cities including
Beijing and Shanghai. The specific data sources are shown in Table 2.
Table
2 Data source description
|
Data name
|
Data type
|
Data sources
|
Year
|
|
Impervious surface[15]
|
Grid
|
Referencing the 2022
satellite imagery data acquired from BIGEMAP, the 2017 global land cover
product with a 10-m resolution produced by the team led by Professor Gong,
Peng from the Department of Earth System Science at Tsinghua University was
corrected to obtain the impervious surface data for the target city in 2022
|
2022
|
|
Network
|
Vector (line)
|
NavInfo Co., Ltd.
|
2022
|
|
POI (Point of
Interest)1
|
Vector (point)
|
NavInfo Co., Ltd.
|
2022
|
|
AOI (Area of
Interest)1
|
Vector (polygon)
|
NavInfo Co., Ltd.
|
2022
|
|
Population
|
Vector (point)
|
LBS population data
|
2022
|
|
Building surface[16]
|
Vector (polygon)
|
3D building dataset produced by Professor Liu,
Xiaoping’s team at the Key Laboratory of Urbanization and Geographic
Environment Spatial Simulation of Guangdong Province (3D-GloBFP dataset,
2020)
|
2020
|
|
High-resolution
imagery
|
Raster
|
BIGEMAP
|
2022
|
3.1 Algorithm
3.1.1 Delimitation of Built-up Area
According
to the Basic terminology standards for urban planning[17], urban
built-up area refer to areas within the urban administrative area that have
been completely developed and constructed, with basic municipal and public
facilities in place. In view of the 2 important characteristics of “completely
developed and constructed” and “basic municipal and public facilities are in
place”, multi-source big data is utilized for expression. Among them: (1)
Identification of “fully developed and constructed” areas: using impervious
surface data obtained by interpreting 10-m resolution remote sensing images to
extract the impervious surfaces formed by human construction; (2) Judgment of
“basic municipal facilities”: selecting road network data from navigation electronic
maps (including roads above the township and village level), and reflecting
whether some municipal facilities are available through the road network
density factor. At the same time, the spatial distribution of roads can also
determine whether the map is connected to the central urban area. (3) Judgment
of “basic availability of public facilities”: selecting POI data from
navigation electronic maps, and evaluating the level of public service facility
construction in different areas through the analysis of the spatial
distribution of major public facilities such as education, medical care,
culture, and sports. Finally, local population density data from Baidu LBS and
high-resolution imagery are used as verification factors to correct the
preliminarily delineated potential construction areas.
3.1.2 Delineation of Core Built-up Area
The
core built-up area refers to the central built-up area that undertakes core
functions and exhibits a high-density development pattern. Its connotation is
mainly reflected in the following 3 points: in terms of location, it is located
in the geographical center or the core area of the city that is generally
recognized; In terms of morphology, it shows high construction intensity and
population density. In terms of function, it brings together core functions
such as commerce, finance, administration, history and culture, and is a dense
area of high-level public service facilities. When delineating the core
built-up area, fully consider the data expression of the key points in its
definition. Firstly, the geographical center and cognitive center within the
built-up area are identified to form the central area. At the same time, the
density of each street and township unit is measured to identify the higher
density range; After that, verify whether the core functional areas and main
facilities have been covered by the high-density range; Finally, large
ecological spaces such as major water bodies and regional parks are identified,
which are not included in the calculation scope (Figure 1).
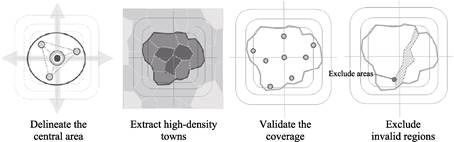
Figure 1 Principle of delineation of core built-up
area
3.2 Technical Route
3.2.1 Delineate Technical Routes in Built-up Areas
The
technical route of built-up area delineation can be summarized as follows:
firstly, the area with surface coverage type impervious surface is extracted
and defined as “developed area”; set a certain threshold in the developed area,
and judge the area where the road network density and POI density are higher
than the threshold as “quasi-built-up area”; Based on the population density of
Baidu grid and high-resolution imagery, the built-up area is checked and
corrected to obtain the boundary of the urban “built-up area” (Figure 2).
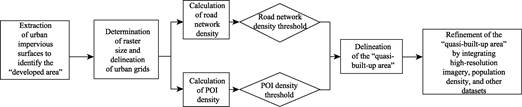
Figure 2 Flowchart
of the built-up area delineation
Taking Beijing
as an example, the extraction process of built-up area is as follows:
Step 1: Identify
“developed area”.
Within the
jurisdiction of the city, based on the land cover data interpreted by
high-resolution imagery, the area of the type impervious surface is regarded as
the “developed area”. According to the Global Land Cover Product (FROM-GLC10)
produced by the Department of Earth System Sciences of Tsinghua University
using AI technology, Beijing has a total developed area of 2,560 km2
(Figure 3).
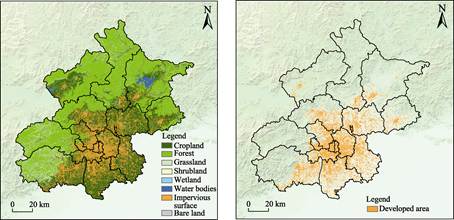
Figure 3 Maps
of land cover type (left) and “developed area” (right) in Beijing
Step 2: Identify
“quasi-built-up area”.
(1) Divide the
municipal area into uniform 500 m×500 m grids. The size of the grid significantly influences the area
and boundary shape of the built-up area, and the large grid can easily lead to
the area error of band-shaped and finger-shaped built-up area, as well as the
area error of small and medium-sized urban built-up area, or the omission of
urban land patches such as development zones and mining areas that are not
connected to the urban center group. If the grid is too small, while the
resolution can be improved, the fragmentation of the patch will bring
unnecessary trouble to the subsequent processing and analysis work, and it is
difficult to evaluate the construction of infrastructure and public service
facilities in a patch that is too small. In this paper, the smallest unit of
the built-up area is set to 500 m grid.
(2) Determine
the thresholds of road network density and POI density at urban grid scale, and
the size of the threshold directly determines the spatial location and area of
the built-up area boundary. Considering that the geographical location,
morphological characteristics, urbanization level, socio-economic development
level and other characteristics of the 19 cities are quite different, each city
should set different thresholds. In this paper, the most widely used mutation
detection method in built-up area is used to extract night light remote sensing
data to determine the threshold values of road network density and POI density.
Based on the morphological characteristics, the urban area will maintain the
integrity of the overall geometry, and the urban built-up area boundary will
shrink along the edge in the process of gradually increasing the threshold, but
when the segmentation threshold reaches a certain point, the built-up area
boundary will no longer shrink along the edge, but will break from the inside,
resulting in a new smaller polygon, which will lead to a sudden increase in the
perimeter of the built-up area boundary, and this point is defined as the
threshold point[1]. This paper argues that there is also a mutation
point (i.e., the boundary of urban built-up area) in the transition from the
central urban area to the peripheral suburbs, and this mutation point is the
threshold of this factor. It is calculated that the road network density
threshold in Beijing’s built-up area delineation method is 4.1 km/km2,
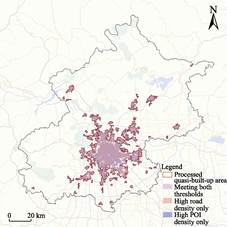
and the POI density threshold is 45 units/km2 (Figure 4).
(3) The grid with road network density or
POI density higher than its corresponding threshold in the “developed area” of
the municipal area is determined as “quasi-built-up area”, and polygon merging,
denoising or filling of the “quasi-built-up area” is carried out. Firstly, the grid in which any index of road
network density and POI density is higher than its corresponding threshold is
extracted, and converted into a vector polygon. Then the vector
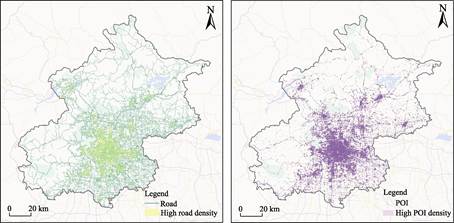
Figure 4 Maps of areas
with road network density above the threshold (left) and areas with POI density
above the threshold (right) in Beijing
polygons
are merged to form a “quasi-built-up area” patch. Then, the fine polygons with
an area of less than 2 km2 (i.e., less than 8 grids) in the
“quasi-built-up area” patch are deleted, and the cavities with an area of less
than 10 km2 (i.e., less than 40 grids) are eliminated, and a
relatively regular “quasi-built-up area” is obtained (Figure 5).
Step 3: Modify
the “quasi-built-up area” to form the boundary of the urban built-up area
(Figure 6).
(1) Calculate
the population density at the urban grid scale. Although the definition of
urban built-up area in the “Basic terminology standard for urban planning” does
not include a description of the urban population, whether it is land developed
and constructed in patches or complete municipal public facilities, it serves
people. Population is one of the important indicators that reflect the
construction status of a city. Based on Baidu LBS data this paper calculates
the urban 500 m×500 m
grid-scale population density index, and uses it as a verification factor to
correct the boundary of urban built-up area.
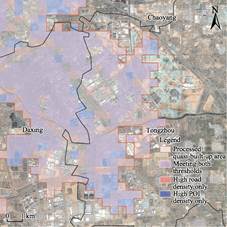
(2) By
integrating high-resolution imagery, Baidu grid population density, urban road
network, and ecological corridors, and the boundaries of the quasi-built-up
area are refined by removing large water bodies and undeveloped land, such as
peripheral mountains to achieve a more precise built-up area delineation.
|
|
|
|
Figure 5 Map of
the quasi-built-up area after merging, denoising, and filling
|
Figure 6 Example of correction of quasi-built-up area based on
check factor
|
3.2.2 Delineate the Technical Route of the Core Built-up Area Data
Development
In
order to ensure the comparability of the built-up environmental indicators
between different cities, and draw on similar concepts at home and abroad (such
as 92.5 km2 in the core area of Beijing[18], 105 km2
in the core area of the Paris metropolitan area[19]), the area is
controlled at about 90–160 km2. The specific delineation process
includes the following four steps (Figure 7):
Step 1:
Delineation of the urban central area. Urban centers include 2 types, one is
the objective geometric center, that is, the geographical center; One is the
subjective public perception of the city. For geographic centers, they can be
identified by geometric centers within the built-up area of the city (usually
the center of a ring road, the intersection of major roads). The cognitive
center identifies representative public facilities and public areas that can
represent the image of the city center, usually commercial districts, cultural
facilities, parks and squares, etc. as the city center.
Step 2:
Identification of high-density towns/sub-districts based on population and
building data. Based on Baidu grid population density data and building base
data, the construction intensity and population density index of each
sub-district or township unit within the urban built-up area are calculated.
Through the spatial distribution of indicators, the higher density range is
identified as the basis for the spatial range of the core built-up area.
Step 3:
Verification of the main urban functional zones and facilities. Verify that the
city’s main functional areas and major city-level facilities are covered by the
high-density range identified in step 2. The layout of commercial centers,
business centers, administrative centers, historical districts and large public
facilities in the city is generally examined, but urban sub-centers that are
far away from the urban center area (such as Beijing Tongzhou sub-center,
Tianjin Binhaixinqu, etc.) are not included in the delineation of the core
built area of this paper.
Step 4:
Exclusion of major open spaces to form the “core built-up area”. Identify
ecological spaces such as large water bodies and country parks with low
construction intensity and less accessible and used by people, and deduct them
from the scope of the core built area. Among them, urban parks are spaces used
by urban residents on a daily basis, which are still included in the
calculation scope of urban core built-up area.
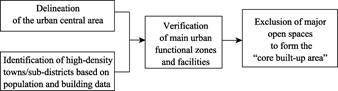
Figure 7 Flowchart
of the core built-up area delineation
4 Data Results and Validation
4.1 Dataset Composition
Based
on multi-source big data, this paper uses unified delineation methods and
delineation processes to produce the built-up areas boundaries and core
built-up areas boundaries of 19 cities in China. The dataset is archived in
.shp format, and the city name, province name and zoning code information of
the built-up area and the core built-up area are declared in the attribute
table (Table 3). The dataset consists of 2 data files with a total data volume
of 2.23 MB (compressed into 1 file, 1.37 MB).
Table 3 Dataset attribute information
|
Field name
|
Field description
|
|
FID
|
Feature identifier
|
|
Shape
|
Geometry type. In this dataset, all features are polygons
|
|
CityName_C
|
Chinese name of the city
|
|
CityName_E
|
English name of the city
|
|
CityCode
|
City administrative division code
|
|
ProName_C
|
Chinese name of the province
|
|
ProName_E
|
English name of the province
|
4.2 Data Products
The
results of the 19 urban built-up areas and core built-up areas delineated in
this paper are shown in Figure 8.
This paper
analyzes the distribution of built-up areas and core built-up areas in each
district and county unit in 19 cities (Figure 9). The analysis results show
that there are significant differences in the urbanization level of districts
and counties within different cities, which
are mainly reflected in the 2 dimensions of built-up area coverage (proportion
of built-up area) and urban core function agglomeration degree (proportion of
core built-up area).
(1) A highly
urbanized core area
Some district and
county units have been highly mature in terms of construction form and core
functional layout, and their built-up area and core built-up area occupy an
absolutely dominant position. Typical representatives include: Beijing
Dongcheng District and Xicheng District (100% of the built-up area, nearly 100%
of the core built-up area), Tianjin Heping District (100%, 100%), Xi’an Xincheng
District (100%, 99.6%), Beilin District (100%, 100%), Shanghai Hongkou District
(97.7%, 97.3%), Qingdao Shinan District (96.4%, 95.9%), Shibei District (97.9%,
97.3%). The built-up areas and core built-up areas of these districts and
counties generally account for more than 95%, which are key areas for
accommodating core urban functions.
(2) Areas with
mature built-up area but insufficient core function agglomeration
Some districts and
counties show high coverage of built-up area but relatively weak core built-up
functions. The proportion of built-up area in Wuhou District of Chengdu is the
highest in the city (96.7%), but the proportion of core built-up area (56.9%)
is significantly lower. This phenomenon shows that these areas are highly
urbanized in terms of spatial construction, but there is still room for
development in carrying and agglomerating the core functions of the city.
(3) Areas with a
low proportion of built-up area
The proportion of
built-up areas in districts and counties in some cities is low (less than 50%),
while the proportion of core built-up area is even lower, reflecting the
characteristics of the distribution of urban built-up area and core built-up
area affected by natural geographical conditions, urban development planning
and other factors. Taking Harbin as an example, Nangang District has the
highest proportion of built-up area and core built-up area in the city, but
only 42.2% and 22.2% (the area includes a large area of farmland); Guandu
District, which has the highest proportion of built-up areas in Kunming, is
only 25.5% (most of the area is mountainous and watery).
The analysis shows that there are
significant hierarchical differences between different district and county
units in carrying urban physical space (built-up area) and core functional
space (core built-up area). This difference profoundly reflects the uneven
development within the city, the gradient of functional distribution and the
constraints of the natural environment, and provides an important basis for
understanding the urban spatial structure and functional layout.
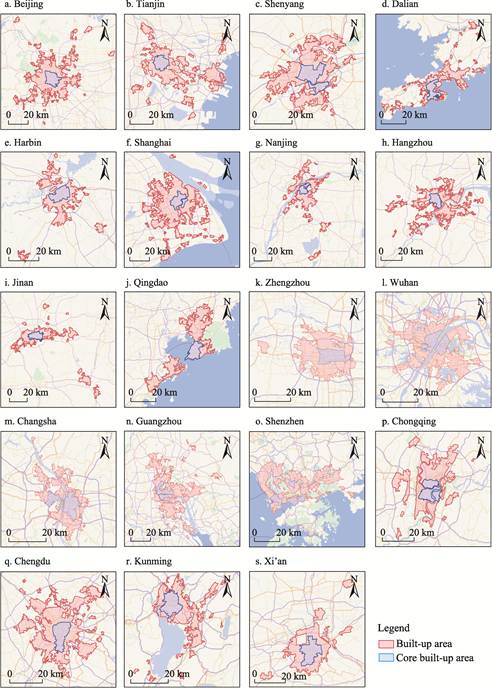
Figure 8
Maps of the spatial scope of 19 urban built-up areas and core built-up
areas of China (2022)
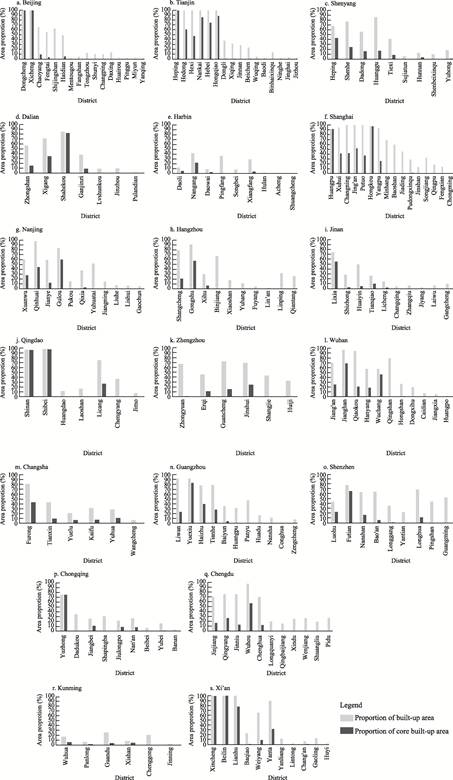
Figure 9 Proportion of built-up areas and core
built-up areas of 19 urban districts and counties of China
4.3 Data Validation
In
order to verify the accuracy of the built-up area delineation results, this
study compared the built-up area data of 19 cities with the built-up area data
used in the 2022 third-party urban physical examination of the Ministry of
Housing and Urban-Rural Development (Figure 10). The results show that the two
are highly consistent in the spatial center position and overall morphology of
the built-up area. The area size is basically the same, but different cities
show certain differences. Specifically, the difference between the built-up
area and the reference data in Tianjin, Nanjing, Changsha, Kunming, Harbin,
Shenyang, Jinan and Hangzhou is less than 1%, showing the best coincidence,
while the area difference in Wuhan, Qingdao, Chongqing and Zhengzhou is more
than 10%, and the difference is relatively significant; The area difference in
the remaining cities is between 1% and 10%, and the difference level is
moderate. The main reason for the difference in area is that there are
differences between the two algorithms in the determination of green space and
water bodies with large areas within and at the edges of the city.
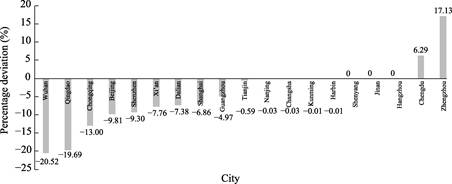
Figure 10
Verification of built-up area results
For example, Shanghai and Beijing have
built-up area of more than 1,500 km2, while Kunming, Harbin,
Changsha, etc. are less than 500 km2. This significant scale
difference leads to unreasonable direct comparison of urban development
evaluation indicators such as facility coverage and population density in each
built-up area. However, the area difference in urban core areas, especially those
with higher density and core functions and facilities, is usually smaller
(Figure 11). Therefore, comparing the level of urban development at this scale
can effectively make up for the limitations based on the overall comparison of
built-up area. Due to the lack of officially published standard datasets for
core built-up area, standard deviation is used as an auxiliary criterion to
evaluate the accuracy of the delineation results. The delineation results show
that the standard deviation of the area of the core built-up areas
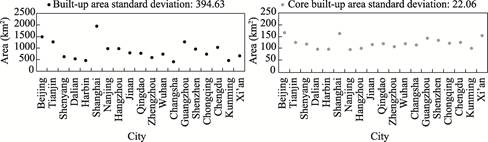
Figure 11 Verification of the results of the core
built-up areas
of
the 19 cases is 22.06, which is much lower than the standard deviation of the
built-up areas (394.63), indicating that the delineation results meet the
expected spatial characteristics (i.e., the difference in the area of the core
area is small), which verifies the effectiveness of the method.
5 Discussion and Conclusion
Urban
built-up area and core built-up area are commonly used spatial boundaries for
evaluating urban built-up environmental indicators, and they are also the basic
spatial boundaries for urban management, planning and construction, urban
renewal and urban physical examination. The traditional delimitation method is
mainly manual and too subjective. With the emergence of new big data and the
advancement of spatial data mining technology, the built-up area delimitation
method has been gradually improved and perfected, and the accuracy and
precision of extraction are also constantly improving. The multi-source data fusion method proposed in this
paper comprehensively uses high-resolution imagery, road networks,
points of interest, Baidu LBS population density and other data to efficiently
identify the boundaries of urban built-up area and core built-up area at the
grid scale. With the advantage of big data, this method provides an accurate
spatial foundation for the study of built environmental assessment. The delineation
method of urban built-up area and core area based on multi-source data has the
same data sources, the same delineation ideas and methods, and unified
technical processes, which can ensure that the extracted urban boundaries can
be compared horizontally, vertically, and updated annually.
However, there
are still some limitations in the method of delineating the boundary of
built-up area. The core problem is that it does not fully respond to the key
dimension of “municipal public facilities are basically available” in the
definition of built-up area. Although this paper fully considers the road
network, an important municipal infrastructure, it fails to effectively
consider equally important municipal pipelines (such as water supply and
drainage, gas, electricity, communication pipeline networks, etc.). It is
mainly limited by 2 factors: first, the degree of electronic and standardized
municipal pipeline data in different cities is significantly different; Second,
such data are often sensitive and not publicly accessible. Consequently, the
current delineation results do not fully satisfy the strict definition of a
built-up area. Besides, the Global Land Cover Product (FROM-GLC10) which was
used in this study is needed to be validated.
In the future,
the range of data sources will be further expanded, and artificial intelligence
technology will be proactively introduced to enhance the automation level of
data processing, feature extraction, and boundary delineation, thereby building
a more accurate, efficient, and standardized urban built environment assessment
data support system.
Author
Contributions
Zhang, S. J. designed the
overall framework for the dataset development and wrote the main part of the
paper; Li, M. extracted the boundaries of urban built-up area and participated
in the writing of the paper; Dan, B. Y. processed the basic data in the text
and participated in the writing of the paper; Han, J. B. delineated the
boundaries of the core built-up area. Hao, L. Q. revised and revised the
dataset and paper.
Conflicts
of Interest
The authors
declare no conflicts of interest.
References
[1]
Shu, S., Yu, B. L., Wu, J. P.
Evaluation and application of urban built-up area extraction method based on
night light data [J]. Remote Sensing Technology and Application, 2011,
26(2): 169–176.
[2]
Yang, Y., Sun, W. B., Han, Y.
H. Extraction method of urban built-up areas based on DMSP/OLS lighting
brightness combination [J]. Remote Sensing for Land & Resources,
2020, 23(3): 39–48.
[3]
Xu, Z. N., Gao, X. L. Boundary
identification method of urban built-up areas based on electronic map points of
interest [J]. Acta Geographica Sinica, 2016, 71(6): 928–939.
[4]
Wang, X. Y., Li, C. M., Chen,
X. D., et al. Extraction method of built-up area based on multi-source
data fusion of night lights [J]. Remote Sensing Information, 2021,
36(5): 114–123.
[5]
Zheng, H. D., Gui, Z. P., Li,
F., et al. Built-up area extraction method combining night lighting data
and point of interest data [J]. Geography and Geographic Information Science,
2019, 35(2): 25–32.
[6]
Huang, N., Xu, Z. H., Xu, S. S.
Empirical research and dynamic optimization of urban construction land
intensity control in Wuhan City [J]. Journal of Urban Planning, 2012(3):
96–101.
[7]
Jin, T. H., Yang, J. Y., Wang,
D. From urban density zoning to spatial morphology zoning: evolution and
empirical evidence [J]. Journal of Urban Planning, 2018(4): 34–40.
[8]
Tang, J. X., Long, Y.
Measurement of street spatial quality in the central area of megacities: a case
study of Beijing’s second and third ring roads and Shanghai inner ring road
[J]. Planner, 2017, 33(2): 68–73.
[9]
Chang, Q., Xu, Q. Z., Yang, C.,
et al. Reflections and exploration on the reduction and control of
construction land in Beijing’s New General Plan [J]. Urban Planning,
2017, 41(11): 33–40.
[10]
Wang, H. F., Shi, S., Rao, X.
J. Spatial distribution logic of urban density: a case study of Shenzhen [J]. Urban
Issues, 2015(8): 22–32.
[11]
Shi, B. X. Quantitative study
on the phenomenon of polar core structure in Asian urban central [D]. Nanjing: Southeast
University, 2015.
[12]
Imhoff, M. L., Lawrence, W. T.,
Stutzer, D. C., et al. A technique for using composite DMSP/OLS “City
Lights” satellite data to accurately map urban areas [J]. Remote Sensing of
Environment, 1997, 61(3): 361–370.
[13]
Zhang, S. J., Li, M., Dan, B.
Y., et al. Dataset of assessment units for 19 urban built environment of
China based on multi-source data (2022) [J/DB/OL]. Digital Journal of Global Change Data Repository, 2025.
https://doi.org/ 10.3974/geodb.2025.03.09.V1.
[14] GCdataPR Editorial Office. GCdataPR
data sharing policy [OL]. https://doi.org/10.3974/dp.policy.2014.05 (Updated
2017).
[15]
Gong, P., Liu, H., Zhang, M., et
al. Stable classification with limited sample: transferring a 30-m
resolution sample set collected in 2015 to mapping 10-m resolution global land
cover in 2017 [J]. Science Bulletin, 2019, 64: 370–373.
[16]
Che, Y., Li, X., Liu, X., et
al. 3D-GloBFP: the first global three-dimensional building footprint
dataset [J]. Earth System Science Data Discussions, 2024, 16(11): 18.
[17]
Ministry of Construction of P.
R. China. Standard for basic terminology of urban planning (GB/T 50280—98) [S].
Beijing: China Architecture Industry Press, 1998.
[18]
Beijing
Municipal Planning and Natural Resources Commission. Beijing Urban Master Plan
(2016–2035) [Z]. Beijing: Beijing Municipal People’s
Government, 2017.
[19]
Ni, J. C. The link of urban and
suburban integration in the Greater Paris Metropolitan Area: Paris metropolitan
(suburban) railway [J]. Urban Rail Transit, 2021(2): 26–31.