Methodology of a Knowledge Graph for the Changes of China’s
Administrative Divisions
LIU Jimeng1 WANG
Shu2,3* DAI Xiaoliang2,3 WANG Chunling2,3 GE Shuangshuang4 HAN Baomin1 ZHU Yunqiang2,5*
1. School of Civil Engineering and Geomatics,
Shandong University of Technology, Zibo 255000, China;
2. State Key Laboratory of
Resources and Environmental Information System, Institute of Geographic Sciences and Natural Resources Research, Chinese
Academy of Sciences, Beijing 100101, China;
3. University of Chinese Academy of Sciences, Beijing
100049, China;
4. College of Surveying and
Mapping Engineering, Heilongjiang Institute of Technology, Harbin 150000,
China;
5. College of Ecology, College of Aerospace Intelligence, Hainan
University, Haikou 570228, China
Abstract: The changes of administrative divisions is a
critical foundation for studying national governance, regional development, and
changes in spatial patterns. However, traditional datasets related to
administrative divisions, such as government gazettes, local chronicles,
statistical yearbooks, and geographical spatial data, which record
administrative regions and their spatiotemporal evolution, are usually stored
in fragmented forms. They lack dynamic association and semantic integration
capabilities, making it difficult to support complex queries and change
analysis. Given the characteristics of administrative division datasets, such
as diverse sources, complex change types, and close spatiotemporal feature
coupling, this paper proposes a method for constructing a knowledge graph of
China’s administrative divisions evolution. At the knowledge modeling level, by
constructing an ontology of administrative divisions evolution, the semantic
expression of entities, attributes, and their evolutionary relationships in
administrative divisions and their spatiotemporal changes is standardized. At
the knowledge extraction level, a multi-path extraction framework is designed
for multi-source heterogeneous data: for structured data, rule mapping and GIS
spatial topological relationship calculation methods are used to extract
spatial and evolutionary information of administrative divisions. For
unstructured announcement text, a joint extraction is carried out by combining
domain ontology and large language models to realize the structured expression
of administrative division nodes, attributes, and evolutionary relationships.
At the knowledge fusion level, entity alignment and fusion are carried out by
comprehensively utilizing the overlapping characteristics and semantic
similarity of entities in the spatial dimension. At the application level, the
fused data is archived in the Neo4j graph database to construct a knowledge
graph of China’s administrative division evolution.
Keywords: administrative divisions;
knowledge graph; evolution of divisions; evolution analysis; China
DOI: https://doi.org/10.3974/geodp.2026.01.08
1 Introduction
Administrative division, regional
politics and their evolution refer to the long-term and sequential dynamic
adjustment process of regional division carried out by the country or regions
in different historical periods according to changes in factors such as
political, economic, ethnic conditions, and historical and geographical
conditions[1,2]. Through the adjustment of administrative levels,
regional reorganization, relocation of administrative seats, etc., the spatial
structure of regions is optimized[3,4], the level of national
governance is improved[5,6], social and economic development is
promoted[7], and thus the high-quality and sustainable development
of regions and the country is promoted[8,9]. The evolution data of
administrative divisions and the laws contained therein are of important
reference value for coordinating and formulating regional development
strategies and national modern governance.
Data of China’s administrative divisions evolution are
mainly recorded and used in 4 forms: First, official gazettes and decrees,
which record the evolution of administrative divisions and related information
in the form of public documents and reports, such as the annual adjustment
announcements issued by the Ministry of Civil Affairs (MCA)[10], local
yearbooks, and chronicles[11], etc.; Second, map images, which use
maps or images as carriers and adopt the form of annual compilation to record
administrative division boundaries and related information, such as Collection
of Administrative Division Maps of China[12,13], Handbook of
Administrative Divisions of China[14], Collection of Evolution of
Administrative Division Maps of China[15], and Collection of Changes
in Administrative Division Maps of China (1980–2017)[16]. Third,
geospatial data, which record administrative boundaries and associated
attributes with high precision on a yearly basis using structured vector and
raster data, such as the Global Administrative Areas (GADM) dataset[17],
OpenStreetMap (OSM) data[18], and the Tianditu administrative
division basemap service[19], etc.; Fourth, research papers, under
the drive of different research objectives, the changes of administrative
division systems, data or systems, such as the evolution of Yangzhou
administrative divisions from the perspective of events[20], the
analysis of the evolution of China’s administrative division pattern[21],
the knowledge graph of administrative divisions and their evolution[22],
etc.
However, existing knowledge graph construction methods for
administrative division evolution still face limitations when processing
massive, multi-source, and heterogeneous data. At present, the ability of the
model to express the process of change is limited, and the spatiotemporal
relationship between administrative divisions and the spatial attributes of
administrative divisions cannot be deeply described in terms of attributes and
characteristics, and it is difficult to fully present the nature and dynamics
of the complex structure between changes. In addition, for the above-mentioned
multi-source heterogeneous data extraction, alignment and integration, there is
still a lack of integrated administrative division information methods, and it
is difficult to accurately mine and integrate.
In view of this, this paper proposes a systematic
construction method for the knowledge graph of China’s administrative division
evolution, aiming to address the issue that existing data cannot support
in-depth, long-term spatiotemporal evolution analysis. The study first
constructs an administrative division ontology to establish a standardized
expression framework for administrative division evolution. Subsequently,
considering the characteristics of multi-source heterogeneous data, it
proposes a set of differentiated knowledge extraction methods, including Large
Language Model (LLM), rule mapping, and GIS topology computation, to achieve
knowledge transformation from datasets such as official gazettes and decrees
and geospatial data to dynamic evolution logic. On this basis, through
spatiotemporal topology constraints and semantic alignment techniques, it
completes the fusion of multi-source entities and, relying on the Neo4j graph
database, constructs a knowledge graph of China’s
administrative division evolution with precise boundaries, semantic
associations, and continuous evolution.
2 Construction Method of Knowledge Graph
for the Evolution of China’s Administrative Divisions
2.1 Overall Framework
To address the issues of multi-source
heterogeneity and complex spatiotemporal evolution in China’s administrative
division historical data, this paper proposes an overall framework for
constructing a knowledge graph of administrative division historical evolution
(Figure 1). This framework takes the ontology model of administrative division
historical evolution as the semantic constraint core, integrating knowledge
extraction and entity alignment methods based on multi-source data to achieve
the unification of administrative division historical knowledge.
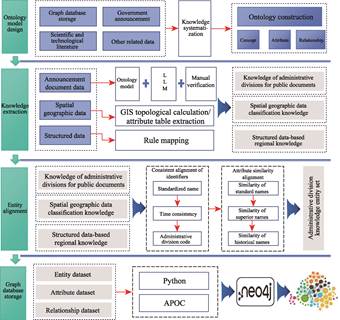
Figure 1 Overall method framework for constructing
the knowledge graph of administrative division evolution
In the design stage of ontology model, the existing
ontology, government announcement, scientific and technological literature, and
other relevant data are comprehensively analyzed. The concepts, attributes and
relationships involved in the process of administrative division evolution are
systematically sorted out. Then the ontology model covering the administrative
division level, attribute system, and evolution relationship is constructed.
In
the knowledge extraction phase, different methods are employed to extract administrative
division entities based on the structure of data sources. For unstructured
texts such as official announcements, semantic extraction is performed using
ontology constraints and LLMs, supplemented by manual verification to enhance
data accuracy. For geographic spatial data, GIS topological calculations and
attribute tables are utilized to extract spatial relationships and attribute
information. Structured data is processed through rule mapping to derive
structured knowledge within the framework of ontology constraints.
During
entity alignment, discrepancies in attribute descriptions may arise due to
varying data sources. For instance, both Beijing City and Changchun City in
Jilin Province have administrative divisions named “Chaoyang District” (same
name but different geographical locations). This necessitates aligning entities
extracted from different data sources. Our study employs a method that combines
the consistency of administrative division identifiers with the similarity of
attribute information to achieve entity alignment.
Finally, Python code and the APOC
(Awesome Procedures on Cypher) library are used to extract and align knowledge,
then store it in the Neo4j graph database according to the ontology model’s
conceptual, attribute, and relational storage structure to achieve
visualization.
2.2 Method of Modeling the
Evolution of Administrative Division
The construction adopts a top-down ontology modeling
method, starting from the top-level concepts of the domain, and defines the
core and most general classifications and logical frameworks within the domain.
Specifically, first, based on existing ontologies in the domain, government
gazettes, scientific and technical documents, and other materials, the
“skeleton” of the ontology is determined. The administrative division entity is
established as the core of the ontology; Second, on the basis of the top-level
administrative division concept, subclasses and subordinate levels are
gradually subdivided downward, and the entity is further subdivided into “provincial-level”,
“prefectural-level”, and “county- level” units for construction; Finally, after
the top-level framework is built, specific attributes and mutual relationships
are defined for each level.
2.3 Knowledge Extraction Method
During the knowledge extraction instance stage, to address
potential inconsistencies in data source formats—for example, geospatial data
are often stored in vector formats, while public notices exist as unstructured
text—different knowledge extraction methods are adopted, including: ontology-semantic-driven
LLM knowledge extraction method, attribute extraction method based on rule
mapping and field analysis, administrative division relationship identification
method based on spatial topological operators, and administrative division
evolution relationship change determination method based on attribute field
changes.
For structured knowledge, for unstructured text data such
as public notices, a knowledge extraction method based on ontology semantics
and driven by large language models (LLMs) is adopted. This approach transforms
the “entity-attribute-relationship” structure of the ontology model into LLM
recognition logic, enabling the large language model to perform targeted
parsing and matching based on the ontology content. In the specific extraction
process, prompt engineering is employed to construct a structured extraction
template (Prompt) through multi-round dialogue and instructions, requiring the
LLM to identify the elements of “subject (S), predicate (P), object (O), and
time (T)”, and output them as a standardized quadruples. The extraction results
are then manually verified in combination with the constraints of the ontology
to eliminate content that does not conform to the ontology semantic
specifications.
For
long-sequence, multi-source GIS-based administrative division information
spatial vector data, it is necessary to standardize the extraction of entity
attributes and the construction of geometric information. Specifically, an
attribute extraction method based on rule mapping and field parsing is adopted:
First, establish a mapping rule library between ontological attributes and GIS
fields, and perform standard conversion on the fields of the attribute table;
then use the open-source geographic information processing tool GeoPandas to
read the spatial vector data of administrative divisions, jointly process the
attribute fields and geometric objects, calculate and extract the spatiotemporal
extents; At the same time, obtain the corresponding year through file names
parsing, uniformly assign it to the entity attributes, and finally form the
entity attribute dataset of administrative divisions.
To
identify the spatial relationships and evolutionary relationships of
administrative divisions, a method for identifying spatial administrative
division relationships based on spatial topological operators is adopted. The
core principle of this method is to abstract vector boundaries into geometric
objects. Through topological judgment and spatial overlay calculation, static
relationships such as adjacency and inclusion of spatial administrative
divisions, as well as dynamic evolutionary relationships such as merger, split,
establishment, and revocation, are identified. In the same year, the DE-9IM matrix[23]
is used to describe the topological relationship between two administrative
division geometric objects A and B, which can be expressed as 9 intersections
between their interiors, boundaries, and exteriors, as shown in Equation 1:
 (1)
(1)
By judging the
combination of the value patterns of each element in the matrix, the type of
topological relationship between two spatial objects can be accurately
characterized. For example, when  and there is at least one boundary intersection in the matrix
that is not
and there is at least one boundary intersection in the matrix
that is not , the two administrative divisions are determined to be
adjacent. When
, the two administrative divisions are determined to be
adjacent. When  and
and  , the two administrative divisions are determined to be in an
inclusion relationship.
, the two administrative divisions are determined to be in an
inclusion relationship.
In the process of evolution relationship extraction, the
GIS overlay analysis method[24]is employed to calculate the spatial
intersection between the administrative division geometric sets and
and at adjacent time nodes t and t+1, thereby
determining whether administrative divisions have persisted or disappeared over
time[25]. For cases where spatial intersections exist, the area
coverage model[26] is introduced to further classify the evolution
type. The spatial coverage of administrative divisions is calculated using the
following Equation 2:
at adjacent time nodes t and t+1, thereby
determining whether administrative divisions have persisted or disappeared over
time[25]. For cases where spatial intersections exist, the area
coverage model[26] is introduced to further classify the evolution
type. The spatial coverage of administrative divisions is calculated using the
following Equation 2:
 (2)
(2)
First, set a coverage
threshold. When the coverage is close to 100%, it indicates that the main body
of the administrative division remains basically unchanged. When multiple  have a coverage of the same
 exceeding the set threshold, it is determined that a merger
has occurred; when a singlehas a coverage of multipleexceeding the set threshold, it is determined that the
administrative division has been split.
exceeding the set threshold, it is determined that a merger
has occurred; when a singlehas a coverage of multipleexceeding the set threshold, it is determined that the
administrative division has been split.
The evolution of
administrative divisions encompasses not only spatial boundary changes through
mergers and splits, but also relationships involving name changes,
administrative level adjustments, and administrative affiliation modifications.
To identify these relationships, an attribute-based evolution analysis method
is employed. The process begins by screening adjacent years’ administrative division pairs that show high
spatial overlap and coverage consistency through overlay analysis, forming a
candidate set for attribute comparison. Subsequently, key attributes including
Chinese names, division codes, administrative levels, affiliated regions, and
government locations are systematically compared. For instance, when spatial
boundaries remain unchanged but Chinese names vary, it is classified as a “name change” relationship.
Similarly, when division codes stay consistent
but affiliations change, it is categorized as an “affiliation adjustment” relationship.
2.4 Entity
Alignment Method
Entity alignment refers to the process of identifying and
resolving instances from multiple data sources that point to the same
real-world entity, while performing heterogeneous disambiguation to achieve
unified representation. In this study, data sources included official
announcements, GIS vector data, and other structured or semi-structured data.
Due to variations in naming conventions and attribute completeness across
different sources, the same administrative division may be inconsistently
described. To address this, we developed 2 alignment methods: entity identifier
consistency alignment and attribute similarity alignment, which are tailored to
varying levels of entity identification completeness.
For entities with standardized identifiers or
standardized names, this study employs the identifier consistency alignment
method[27]. By utilizing the standardized Chinese full names and
unique administrative division codes of administrative entities, precise entity
anchoring is performed under a unified time benchmark T. First, the
entities in two data sources are determined to be on the same time slice. If an
entity possesses identical six-digit administrative division codes, it is
identified as the same entity. If the division code is missing, the
standardized Chinese full name and its affiliated administrative division are
compared. The Equation is expressed as follows:
 (3)
(3)
where, (e1,e2) denotes entities from distinct data sources S1 and S2.  represents the administrative division code, while Name(e) indicates the full Chinese name of the administrative division. Parent(e) denotes the full Chinese name of the parent administrative
division, and T represents the year of the data section. The consistency
score
represents the administrative division code, while Name(e) indicates the full Chinese name of the administrative division. Parent(e) denotes the full Chinese name of the parent administrative
division, and T represents the year of the data section. The consistency
score  is assigned when =1, indicating the entity’s identity.
For
cases where administrative division codes are incomplete or Chinese names are
non-standardized, this study employs an attribute similarity alignment method.
By calculating the similarity between multiple attributes of entities, it
determines whether they belong to the same entity[27]. Let the
attribute sets of administrative division entities  and
and be denoted as
 , and the comprehensive attribute similarity calculation
method is as follows:
, and the comprehensive attribute similarity calculation
method is as follows:
 (4)
(4)
where,  denotes the
weight of attribute
denotes the
weight of attribute  , with ∑
 =1.
=1.  () represents the
similarity function for the corresponding attribute. When aligning
administrative division entities, we first set the decision threshold θ,
using Chinese names and administrative affiliation attributes as core
evaluation metrics. Chinese names are assigned higher weight, while
administrative affiliation serves as auxiliary judgment. The comprehensive
similarity score is calculated through weighted summation of these formulas,
then compared with the preset threshold θ. If
() represents the
similarity function for the corresponding attribute. When aligning
administrative division entities, we first set the decision threshold θ,
using Chinese names and administrative affiliation attributes as core
evaluation metrics. Chinese names are assigned higher weight, while
administrative affiliation serves as auxiliary judgment. The comprehensive
similarity score is calculated through weighted summation of these formulas,
then compared with the preset threshold θ. If  ,the two entities are determined to represent the same
administrative division.
,the two entities are determined to represent the same
administrative division.
3 Knowledge
Graph Construction and Validation of Administrative Division Evolution from
1949 to 2023
3.1
Data Sources
The data for constructing the knowledge graph of administrative
division evolution mainly come from China’s
administrative division vector data of different years, China’s provincial
statistical yearbooks, and announcements of administrative division changes at
or above the county level. For specific sources and explanations, please refer
to the Table 1.
Table 1 Data sources
|
Entry
|
China’s administrative division vector data
|
China’s provincial statistical yearbook
|
Administrative division changes at or above the county
level
|
|
Data
year
|
1949–2014
|
2014–2023
|
1981–2024
|
1978–2023
|
|
Temporal
resolution
|
Yearly
|
Yearly
|
Yearly
|
Yearly
|
|
Spatial
resolution
|
Provincial,
prefectural, and
county levels
|
Provincial,
prefectural, and county
levels
|
Provincial
level
|
Provincial,
prefectural,
and county levels
|
|
Recorded
information
|
Basic
information
of administrative
divisions
|
Basic
information of administrative
divisions
|
Economic
data,
Social data,
Resource data,
etc.
|
Approval
document
name, change date,
and administrative
division changes at or above the county level
|
|
Data
format
|
Shapefile
|
Shapefile
|
.pdf
|
.txt
|
|
Data
size
|
1.08 GB
|
0.87 GB
|
584 MB
|
610 KB
|
|
Data
source
|
Geographic
Information
Database of
University of California, Berkeley
library
|
Based on the county-level
administrative division data from National Geomatics Center of China,supplemented by AMAP (Gaode)
Administrative Division Data,
and MAP WORLD (Tianditu) Administrative Division Data;
Draw based on the administrative divisions
published by the Ministry of Civil Affairs over the years as the attribute
basis[28]
|
National Bureau
of Statistics
|
Ministry of Civil
Affairs of China,
Administrative Division Network
|
Note: The scope of China’s
administrative division vector data and China’s
provincial statistical yearbook data covers the three levels of administrative
divisions (provinces, cities, and counties) in China’s mainland and Hong Kong, Macao,
excluding Taiwan.
The
administrative division vector data of China used in this paper consists of 2
parts. The vector data from 1949 to 2014 is sourced from the Geographic
Information Database of the University of California, Berkeley, while the
vector data from 2014 to 2023 is cited from the China Temporal Sequence
Administrative Map (CTAmap) multi-temporal administrative division database published by Cheng Rui, et al.
(2025)[28]. CTAmap uses the 2020 administrative division pattern of
China as the benchmark, integrating authoritative data such as the basic
geographic information data from the National Geospatial Information Data
Center (NGCC) and the administrative division codes from the Ministry of Civil
Affairs. By combining forward temporal inference with backward retrospective
methods, it reconstructs the spatial boundaries, administrative codes, and
hierarchical affiliations of provincial, municipal, and county-level
administrative divisions from 2009 to 2023. Prior to the study, the spatial
boundaries of the database data were cross-checked against standard
administrative division maps, and key attribute information was verified
against the official administrative division data published by the Ministry of
Civil Affairs over the years. The results showed that the data is highly
consistent with authoritative sources in terms of spatial morphology and
attribute information, making it suitable as the data foundation for
constructing the knowledge graph dataset of the evolution of China’s
administrative divisions.
3.2 Ontology Model of China’s
Administrative Division Evolution
The administrative division
evolution ontology model developed in this study comprises 2 core categories of
concepts, and their attributes, as well as 4 major types of relationships. The
top-level core concepts include administrative divisions (or administrative
units) and administrative centers. Administrative divisions refer to the areas
that a country divides for administrative management, which are the regions
governed by local administrative authorities. They include four levels:
national-level administrative divisions, provincial-level administrative
divisions, prefecture-level administrative divisions, and county-level
administrative divisions. Administrative centers denote the locations of a
nation’s central or local governments, including capital cities and regional
administrative seats. The attributes of administrative divisions primarily
consist of: identification information describing and marking administrative
divisions; management information standardizing hierarchical structures;
spatial information defining geographic boundaries; and temporal information
recording lifecycle changes. Specifically, administrative division entities
contain 2 major categories of attributes: core attributes and extended
attributes. Core attributes exhibit strong correlation with administrative
division evolution, as any changes in divisions inevitably involve alterations
in at least 1 core attribute. Extended attributes provide further descriptive
details about administrative divisions without direct connection to division
changes, though they often evolve with division transformations—for instance,
adjustments to spatial boundaries may lead to corresponding GDP changes.
Administrative center attributes mainly include: identification attributes
clarifying the center’s identity; spatial attributes precisely defining its
location and scope; temporal attributes recording its existence duration; and
management attributes specifying its authority and organizational structure.
For detailed conceptual frameworks and attribute classifications, refer to
Table 2.
The
ontological model of administrative division evolution developed in this study
comprises 4 fundamental relationship types: spatial, hierarchical, and
evolutionary and association relationships. Spatial relationships delineate the
geographical positions of administrative entities, while hierarchical
relationships define their hierarchical subordinations. Evolutionary
relationships, functioning as temporal attributes, document administrative
changes across different periods. Association relationships are used to link
administrative division entities with their economic, natural, and other
indicators. Detailed relationship types and examples are presented in Table 3.
Table 2 Ontology concepts and attribute
classification
|
No.
|
Top-level concept
|
Attribute level
|
Attribute class group
|
Attribute name
|
|
1
|
Administrative
division (administrative division unit)
|
Core attributes
|
Label properties
|
Chinese name
|
|
2
|
Administrative division code
|
|
3
|
Management properties
|
Administrative division
|
|
4
|
Managed administrative
division
|
|
5
|
Spatial attribute
|
Spatial scale
|
|
6
|
Area
|
|
7
|
Temporal attribute
|
Establishment time
|
|
8
|
Change or cancellation time
|
|
9
|
Date
|
|
10
|
Extended properties
|
Social and humanistic
attributes
|
Gross Domestic Product (GDP)
|
|
11
|
GDP of primary industry
|
|
12
|
GDP of secondary industry
|
|
13
|
GDP of tertiary industry
|
|
14
|
Population
|
|
15
|
Population composition by sex
|
|
16
|
Per capita disposable income
|
|
17
|
Statistics time
|
|
18
|
Natural geography
attributes
|
Terrain type
|
|
19
|
Average altitude
|
|
20
|
Name of the river flowing
through
|
|
21
|
Major mineral reserves
|
|
22
|
Average temperature
|
|
23
|
Average precipitation
|
|
24
|
Sown area of food crops
|
|
26
|
Statistics time
|
|
27
|
Administration center
|
Essential attribute
|
Label properties
|
Chinese name
|
|
28
|
Alias
|
|
29
|
Center type
|
|
30
|
Administrative division name
|
|
31
|
Administrative division code
|
|
32
|
Spatial attribute
|
Address
|
|
33
|
Space coordinate
|
|
34
|
Spacial scale
|
|
35
|
Geographic reference system
|
|
36
|
Temporal attribute
|
Establishment date
|
|
37
|
Terminal time
|
|
38
|
Management properties
|
Jurisdiction
|
|
39
|
Include departments
|
|
40
|
Administrative function
|
|
|
|
|
|
|
Note:
The core and extended attributes of administrative divisions include the common
attributes of national-level, provincial-level, prefectural-level, and
county-level administrative regions. Administrative centers share attributes
with both the capital and local government seats.
3.3 Knowledge Extraction
and Alignment
This
experiment targets the various data sources mentioned in Section 3.1,
completing the structured acquisition and organization of administrative
division entities, attributes, and relationships using the knowledge extraction
and alignment methods described in Chapter 2. During the knowledge extraction
phase, for the vector data of China’s administrative divisions, this paper
employed rule mapping and field parsing methods to extract static attributes
such as Chinese names, administrative codes, and affiliations from the vector
data
Table 3 Ontology
part relationship type and instance
data table
|
Relationship category
|
No.
|
Relationship name
|
Example
|
|
Spatial relationship
|
1
|
Adjacent
|
Henan Province is adjacent to
Shandong Province
|
|
2
|
Includes
|
Beijing includes Chaoyang
District
|
|
Hierarchical relationship
|
3
|
Has prefecture-level city
jurisdiction
|
Henan Province has Luoyang
City as its prefecture-level city jurisdiction
|
|
4
|
Has county-level jurisdiction
Under city
|
Luoyang City has Luolong
District as its county-level jurisdiction
|
|
5
|
Has directly administered
county-level jurisdiction
|
Xinjiang Uygur Autonomous
Region has Tiemenguan City as its directly administered county-level
jurisdiction
|
|
Evolutionary relationship
|
6
|
establish
|
Establish Longhai District in
Zhangzhou City
|
|
7
|
The abolition of
administrative
divisions is
|
The county-level Longhai City
is abolished
|
|
8
|
Renamed to
|
Shannan Prefecture was renamed
to Shannan City
|
|
9
|
Merged into region
|
Shannan Prefecture was merged
into Shannan City
|
|
10
|
Split into regions
|
Tacheng Prefecture was split
into Tacheng Prefecture and Huyanghe City
|
|
11
|
Government seat relocation to
|
The seat of Tongchuan
Government has been moved from Hongqi Street in Wangyi District to Zhengyang
Road in Yaozhou District.
|
|
12
|
Administrative divisioncode
changed
|
The administrative division
code of Shaxian District was changed to 350427
|
|
Association relationship
|
13
|
GDP
|
In 2022, Beijing’s regional
GDP was 4,161.09 billion CNY
|
|
|
14
|
GDP of the primary industry is
|
In 2022, Beijing’s GDP of primary
industry was 11.15 billion CNY
|
|
|
15
|
GDP of the secondary industry
is
|
In 2022, Beijing’s GDP of
secondary industry was 660.51 billion CNY
|
|
|
16
|
GDP of the tertiary industry
is
|
In 2022, Beijing’s per capita
GDP was 3,489.43 billion CNY
|
|
|
17
|
Population size is
|
In 2022, Beijing’s population
was 21.84 million
|
|
|
18
|
Per capita disposable income
is
|
In 2022, Beijing’s per capita
disposable income was 77,414.55 CNY
|
|
|
19
|
The average precipitation is
|
In 2022, Beijing’s annual
average precipitation was 585.4 mm
|
|
|
20
|
The average temperature is
|
In 2022, Beijing’s annual
average temperature was 13.4 °C
|
|
|
21
|
The total sown area of crops
is
|
In 2022, Beijing’s total sown
area of crops was 143.8 thousand ha
|
|
|
|
|
…
|
attribute table. Simultaneously, GeoPandas was utilized to
parse spatial geometric objects, serializing administrative boundaries as
spatial range attributes. Based on this, DE-9IM spatial topology operators and
overlay analysis methods were introduced to horizontally identify adjacent
relationships between administrative divisions in the same year, and vertically
determine the evolution relationships of administrative divisions
(establishment, abolition, merger, and division) through comparisons of spatial
objects in adjacent years. For announcements of administrative division changes
at or above the county level, an ontology- driven large language model
extraction method was adopted to identify information such as subjects,
evolution types, time, and approval documents in administrative division change
events, corresponding to the evolution relationships designed in the ontology.
Finally, for statistical indicators in China’s provincial statistical
yearbooks, they were extracted as extended attribute information and
established as attribute associations with corresponding administrative
division entities.
During the knowledge alignment phase, the system
sequentially applied 2 methods to integrate administrative entities extracted
from different data sources: identifier consistency alignment and attribute
similarity alignment. First, precise alignment was performed using
administrative codes, Chinese names, and temporal information from GIS vector
data, statistical yearbooks, and official announcements. For entities with
missing codes or name discrepancies, the attribute similarity alignment method
was employed to comprehensively compare key attributes such as Chinese names
and administrative affiliations, thereby achieving entity merging and
disambiguation. At the relational level, the aligned entity identifiers were
unified to specify spatial relationships and their evolutionary connections.
3.4 Knowledge Graph Storage
This study employed the Neo4j graph database for storing
and managing the knowledge graph of administrative division evolution. As a
native graph database, Neo4j stores data directly in the form of nodes,
attributes, and relationships, allowing entities and their semantic connections
to be naturally mapped into a graph structure. This facilitates efficient
semantic reasoning and path analysis. A connection pool between Python and
Neo4j was established using py2neo, and Neo4j’s APOC batch processing technology
was utilized to store the nodes, attributes, and relationships obtained from
Section 3.3 in batches. Finally, the constructed knowledge graph of China’s
administrative division evolution includes 233,243 administrative division
nodes and 89,073 attribute nodes, with specific node types and corresponding
quantities shown in Table 4; The knowledge graph of China’s administrative
division evolution mainly covers 1,352,945 spatial relationships, 268,689
hierarchical relationships 35,033 evolutionary relationships, and 344,275 association relationships for association expansion.
Examples of relationship types and quantities are provided in Table 5.
Table
4 Examples of node
types and node quantities in the knowledge graph of China’s administrative
division evolution
|
No.
|
Node
type
|
Node number
|
No.
|
Node
type
|
Node number
|
|
1
|
Provincial-level
administrative division
|
2,550
|
4
|
Physical
geographic information
|
36,788
|
|
2
|
Prefecture-level
administrative division
|
24,754
|
5
|
Social
and humanistic information
|
50,447
|
|
3
|
County-level
administrative division
|
205,939
|
|
|
|
Table
5 Examples of
relationship types and relationship quantities in the knowledge graph of China’s
administrative division evolution
|
No.
|
Relationship
name
|
Relationship
number
|
No.
|
Relationship
name
|
Relationship
number
|
|
1
|
Adjacent
|
1,352,945
|
11
|
Administrative Division Code
Changed to
|
2,065
|
|
2
|
Has prefecture-level city
jurisdiction
|
24,755
|
12
|
GDP of the primary industry is
|
2,065
|
|
3
|
Has county-level jurisdiction
under city
|
240,132
|
13
|
GDP of the secondary industry is
|
2,065
|
|
4
|
Has directly administered
county-level jurisdiction
|
3,802
|
14
|
GDP of the tertiary industry is
|
2,065
|
|
5
|
establish
|
6,918
|
15
|
Population size is
|
682
|
|
6
|
The abolition of administrative
divisions is
|
6,186
|
16
|
Per capita disposable income is
|
272
|
|
7
|
Renamed to
|
2,528
|
17
|
The average precipitation is
|
442
|
|
8
|
Merged into region
|
11,443
|
18
|
The average temperature is
|
442
|
|
9
|
Split into regions
|
11,928
|
19
|
The total sown area of crops is
|
2,189
|
|
10
|
Government relocation to
|
9,134
|
|
…
|
|
Figure 2 presents an example of knowledge
graph nodes and relationships. The knowledge graph not only shows the current
administrative boundaries but also includes historical administrative entities
from various periods, each corresponding to a specific timeframe. These rich
attribute details reveal the evolution of administrative divisions. Taking
Chengdu as an example (Figure 3), the knowledge graph displays “Chengdu” nodes
from different periods: Chengdu (2016) and Chengdu (2017) are connected through
an evolution relationship (regional merger), forming a chronological chain.
Similarly, Ziyang City (2016) is linked to Chengdu (2017–2023) via an evolution
relationship (regional division). Overall, this indicates that in 2016, Chengdu
underwent an administrative transformation, merging its original territory with
parts of Ziyang City to form the new Chengdu.
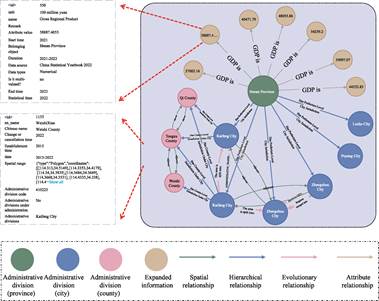
Figure 2 Example diagram
of nodes and relationships in the knowledge graph of
China’s administrative division change
3.5 Feasibility
Test and Quality Change of Knowledge Graph Construction Method
This paper conducts a comparative experiment between the
evolution data recorded in the knowledge graph of administrative division
changes and the county-level and above administrative division changes
published by the Ministry of Civil Affairs, to verify the feasibility and
quality of the systematic construction method of the China administrative
division evolution knowledge graph. Specific steps are: First, collect the
announcement materials of county-level and above administrative division
changes released by the Ministry of Civil Affairs. Second, randomly select the
administrative division change records from different years between 2015 and
2023, and extract the change types, administrative divisions before and after
the changes, as well as the affiliation information before and after the changes
as the validation set. Finally, the knowledge graph was compared with the
announcement of administrative division changes at or above the county level
issued by the Ministry of Civil Affairs, focusing on 4 key aspects of
information:
First,
the revocation and establishment of administrative divisions. In the knowledge
graph, this primarily manifests as whether nodes persist in the subsequent year
after revocation, and whether nodes are successfully generated after
establishment. Second, the accuracy of administrative division names. In the knowledge
graph, this is reflected in whether node attribute information aligns with
official records. Third, the accuracy of administrative division affiliation
information recorded in announcements. In the knowledge graph, this is
represented by the hierarchical relationships between nodes. Finally, the
accuracy of change records, which in the knowledge graph indicates whether
specific evolutionary relationships exist between administrative division nodes
before and after changes. Example comparative results are shown in Table 6.
Table
6 Example of
comparison between the knowledge graph of China’s administrative division
change and the announcement of the Ministry of Civil Affairs
|
Year
|
Official announcement
|
Dataset record
|
Explanation of difference
|
|
2016
|
The Government
of Anhui Province moved from No. 221 Changjiang Road, Luyang District, Hefei,
to No. 1 Zhongshan Road, Baohe District, Hefei
|
Empty in dataset
|
Government seat
attributes are not included in the sources (China administrative division
vector data and provincial statistical yearbooks)
|
|
2016
|
The Government
of Hebei Province moved from No. 46 Weiming South Street, Qiaoxi District,
Shijiazhuang, to No. 113 Yuhua East Road, Chang’an District, Shijiazhuang
|
Empty in dataset
|
Government seat
attributes are not included in the sources
|
|
2016
|
Handan County
was abolished
|
Handan County entry is empty in dataset
|
Handan County is
not included in the sources
|
|
2016
|
Yizhou City was
abolished, and Yizhou District of Hechi City was established
|
Yizhou City entry is empty in dataset
|
Yizhou City is
not included in the sources; Yizhou District has been recorded since 2015
|
|
2018
|
The Government
of Zezhou County relocated to 001 Fucheng Street, Jincun Town
|
Empty in dataset
|
Government seat
attributes are not included in the sources
|
|
2018
|
The Mangya
Administrative Committee and Lenghu Administrative Committee were abolished,
and Mangya City at the county level was established
|
Entries for Mangya and Lenghu Administrative Committees
are empty in dataset
|
The dataset
covers only provincial, prefecture-level, and county-level divisions;
committees are not part of these three levels
|
|
2018
|
The Government
of Beijing Municipality moved from No. 2 Zhengyi Road, Dongcheng District, to
No. 57 Yunhe East Street, Tongzhou District.
|
Empty in dataset
|
Government seat
attributes are not included in the sources
|
|
2020
|
Xisha District
and Nansha District were established under Sansha City, Hainan Province
|
Xisha and Nansha
Districts have attributes dated 2015–
2023 in dataset
|
In the sources,
Xisha and Nansha Districts have been recorded as existing since 2015
|
The discrepancies primarily stem from 3 factors: Firstly,
the knowledge graph only covers provincial, prefectural, and county-level
administrative divisions, excluding special institutions such as administrative
committees, resulting in missing records. Secondly, certain details (e.g., government locations)
lack systematic inclusion in the original data, making them hard to visualize
in the knowledge graph. Thirdly, some administrative adjustments in the data
source are recorded with time discrepancies, causing inconsistencies with the
official announcement dates.
The
validation set was then used to query the knowledge graph of administrative
division evolution, with recall rate, accuracy rate, and F1-score employed to
evaluate its query performance. Comparative analysis revealed that the recorded
administrative division information in the knowledge graph consistently
exceeded 95% in average recall rate, accuracy rate, and F1-score when compared
to the administrative division changes published by the Ministry of Civil
Affairs, with overall records highly consistent with official data,
demonstrating the feasibility of the construction method system proposed in
this paper for the knowledge graph of the evolution of China’s administrative
divisions. Detailed performance
comparison results are presented in Table 7.
 4 Summary
and Future Work
4 Summary
and Future Work
To address the issues of scattered data storage,
difficulties in cross-dataset association, and the complexity of evolutionary
queries caused by diverse sources and heterogeneous formats in traditional
administrative division datasets, this paper proposes and implements a
systematic construction method for the knowledge graph of China’s
administrative division evolution, covering 4 key steps: ontology modeling, multi-source
knowledge extraction, entity alignment and fusion, graph database organization.
First, an ontological model of administrative division evolution is
constructed, with administrative division entities as the core and spatial
relationships, hierarchical relationships, and evolutionary relationships as
the primary relationship types. Second, differentiated knowledge extraction
methods are proposed for vector spatial data, statistical yearbooks, and
announcement texts. Then, an entity alignment method based on identifier
consistency and attribute similarity is designed to resolve issues such as
duplication, homonymy, and ambiguity of administrative division entities in
multi-source data. Finally, by utilizing the batch processing mechanism of
Neo4j graph database and APOC library, the storage and visualization of the
knowledge graph of China’s administrative division evolution were achieved, and
the quality of the graph was also verified.
Future research can be expanded in multiple
directions. First, extending the current time frame to a longer historical
period, we can construct a knowledge graph of administrative division evolution
covering extended cycles to reveal broader evolutionary patterns. Second, by
integrating finer-grained socio-economic data, policy texts, and historical
documents, we can enrich the node attributes and relationship types of the
knowledge graph, thereby exploring the underlying driving mechanisms of
administrative division changes. Finally, combining with large models, we can
leverage their powerful language understanding and generation capabilities to
achieve more intelligent query and analysis functions for administrative
division evolution, reducing user barriers and enabling more intuitive and
convenient exploration and utilization of this knowledge.
Author
Contributions
Liu, J. M., Wang,
S., Zhu, Y. Q., and Han, B. M. contributed to the overall design of the method;
Liu, J. M., Wang, C. L., and Ge, S. S. carried out method research and
conducted method practice, wrote the paper; Dai, X. L. collected the data
sources for the construction of China’s administrative division evolution
knowledge graph; Liu, J. M., Ge, S. S., Wang, S., and Zhu, Y. Q. participated
in the revision of the paper.
Conflicts
of Interest
The
authors declare no conflicts of interest.
References
[1]
Ren, X. R., Ren, F., Chen, H.
P., et al. Design and realization of display system about historical evolution
of Hubei Province’s administrative divisions [J]. Journal of Geomatics,
2017, 42(3): 6.
[2]
Zhao, Y. C., Wang, K. Y., Zhao,
B., et al. Spatio-temporal process and pattern of the establishment of
county-level administrative divisions in China in the past 2200 years [J]. Acta
Geographica Sinica, 2024, 79(4): 890–908.
[3]
Feng, R. D., Wang, K. Y. The
direct and lag effects of administrative division adjustment on urban expansion
patterns in Chinese mega-urban agglomerations [J]. Land Use Policy,
2022, 112: 105805.
[4]
Feng, R. D., Wang, K. Y.
Spatiotemporal effects of administrative division adjustment on urban expansion
in China [J]. Land Use Policy, 2021, 101: 105143.
[5]
Wang, F. L., Liu, Y. G. China’s
urban planning and administrative urbanization: case of Ordos [J]. Urban
design and planning, 2014, 167(5): 196–208.
[6]
Chen, Y. L., Yu, P. H., Wang,
L., et al. Polycentric urban development with state-led administrative
division adjustment: a policy insight for urban spatial transformation [J]. Journal
of Geographical Sciences, 2023, 33(12): 2400–2424.
[7]
Feng, R. D., Wang, K. Y., Wang,
F. Y. Quantifying influences of administrative division adjustment on PM2.5
pollution in China’s mega-urban agglomerations [J]. Journal of environmental
management, 2022, 302: 113993.
[8]
Wei, S., Zheng, W., Wang, L.
Understanding the configuration of bus networks in urban China from the
perspective of network types and administrative division effect [J]. Transport
Policy, 2021, 104: 1–17.
[9]
Zhu, J. H., Chen, X., Chen, T.
Spheres of urban influence and factors in Beijing-Tianjin-Hebei Metropolitan
Region based on viewpoint of administrative division adjustment [J]. Chinese
Geographical Science, 2017, 27(5): 709–721.
[10]
Ministry of Civil Affairs of P.
R. China. Changes in administrative divisions above the county level in China [EB/OL].
(2023-04-03) [2025-09-16]. http://xzqh.mca.gov.cn/description?dcpid=2023.
[11]
Duan, B. R. Beijing Gazetteer ·
Statistics Chronicle [M]. Beijing: Beijing Publishing House, 2016.
[12]
Dai, J. L., Bai, B. Atlas of
Administrative Divisions of P. R. China [M]. Beijing: Sinomap Press, 2005.
[13]
Ministry of Civil Affairs of P.
R. China, National Geomatics Center of China. Atlas of Administrative Divisions
of China [M]. Beijing: Sinomap Press, 2005.
[14]
Dai, J. L. Handbook of
Administrative Divisions of China [M]. Beijing: China Social Science Press,
2009.
[15]
Chen, H. L. Atlas of
Administrative Division Evolution of China (Deluxe Edition) [M]. Beijing: Sinomap
Press, 2003.
[16]
Yang, Y. P. Atlas of
Administrative Division Changes of China (1980–2017) [M]. Beijing: Sinomap Press,
2016.
[17]
Food and Agriculture
Organization of the United Nations (FAO). Administrative boundaries (level 1)-
GADM 3.6 [EB/OL]. (2024-7-30) [2025-09-16].
https://data.apps.fao.org/catalog/dataset/aecbbc85-2a46- 498b-83b4-beca24178f71.
[18]
Geofabrik. China OpenStreetMap dataset
[EB/OL]. (2025-09-15) [2025-09-16]. https://download.geofabrik. de/asia/china.html.
[19]
Map World (Tianditu). China administrative
division dataset [EB/OL]. (2024-05-01) [2025-09-16]. https:// cloudcenter.tianditu.gov.cn/administrativeDivision.
[20]
Lu, Y. X., Zhang, X. Y., Zhang,
C. J. Construction method of knowledge graph for administrative division evolution
from an event-oriented perspective [J]. Journal of Geo-information Science,
2025, 27(10): 2440–2452.
[21]
Zhu, J. H., Chen, T., Wang, K.
Y., et al. Spatial pattern evolution and driving force analysis of
administrative division in China since the reform and opening-up [J]. Geographical
Research, 2015, 34(2): 247–258.
[22]
Chen, S. H. Research on the
construction method of knowledge graph of administrative division evolution
since the founding of China [D]. Nanjing: Nanjing Normal University, 2022.
[23]
Clementini, E., Di Felice, P., van
Oosterom, P. A small set of formal topological relationships suitable for
end-user interaction [J]. Springer Berlin Heidelberg, 2005, 277–295.
[24]
Tai, Y. Y., Wang, Q., Sun, K.
Algorithm on polygon overlaying based on topological information in GIS [J]. Journal
of Southeast University (Natural Science Edition), 2006, 36(3): 442–445.
DOI: 10.3969/j.issn.1001-0505.2006.03.023.
[25]
Wang, C. L., Zhu, Y. Q., Wang,
S., et al. Construction of administrative division knowledge graph considering
spatio-temporal characteristics and evolution relationships [J]. Journal of
Geo-information Science, 2026, 28(1): 89–104
https://doi.org/10.12082/dqxxkx.2026.250471.
[26]
Weng,
J. C., Ge, Y., Wang, C., et al. Transit Travel Index and analysis models
for transit service evaluation [J]. Journal of
Highway and Transportation Research and Development, 2016, 33(1): 130–134
https://doi.org/10.3969/j.issn.1002-0268.2016.01.020.
[27]
Zhuang, Y., Li, G. L., Feng, J.
H. A review of knowledge base entity alignment techniques [J]. Journal of
Computer Research and Development, 2016, 53(1): 165–192.
[28]
Rui, C., Zhang, H. F., Chen, B.
Z. China temporal administrative map: a multitemporal database for Chinese
historical administrative divisions (2009–2023) [C]. Third International
Conference on Environmental Remote Sensing and Geographic Information
Technology (ERSGIT 2024). SPIE, 2025, 13565: 497–507. https://doi.org/10.1117/12.3059430.