TIAN Haozheng1 JIANG Xiaohan2 ZHANG Ning3,4* Abudoula Alimujiang5
WANG Shaohua1
1. State
Key Laboratory of Remote Sensing and Digital Earth, Aerospace Information
Research Institute, Chinese Academy of Sciences,
Beijing 100101, China; 2. Faculty of Architecture and
Urban Planning, Lanzhou Jiaotong University, Lanzhou 730070, China; 3. China Academy of Urban Planning & Design, Beijing
100044, China; 4. Remote Sensing Application Center, Ministry of Housing and
Urban-Rural Development of P. R. China, Beijing 100835, China; 5. Institute of
Geographic Sciences and Natural Resources Research, Chinese Academy of
Sciences, Beijing 100101, China
Abstract: The spatial equity of public
service facility allocation is directly related to urban operational
efficiency, residents’ quality of life, and the fairness of public service
provision. To address the limitations of
existing studies, which mainly focus on single facility type, lack a unified
parameter framework, and have difficulty capturing differentiated service
processes among multiple facility types, this study takes the built-up area of
Beijing as the study area and selects 6 categories of public service facilities—medical
care, education, transportation, commercial shopping, leisure and entertainment,
and life services—as the research objects. By integrating multi-source spatial
data, including road networks, population distribution, built-up areas, and
points of interest, a Multi-Radius Gaussian Two-Step Floating Catchment
Area (MRGS2SFCA) model was constructed to systematically analyze the coverage
pattern and accessibility characteristics of public service facilities. First,
a unified parameter system was developed based on POI semantic cleaning and
hierarchical mapping, transforming differences in service radius, distance
decay, and supply capacity among facility types into comparable model
parameters. Then, the accessibility levels of the six facility types were
measured on unified demand spatial units, and their spatial distribution
patterns and structural differences were comprehensively compared. The results
show that public service facilities in Beijing exhibit a significant “core
concentration-peripheral decline” pattern overall. Areas with high coverage and
high accessibility are mainly concentrated in the core urban districts,
including Dongcheng, Xicheng, central Chaoyang, and southern Haidian, whereas
peripheral areas such as Shunyi, Tongzhou, Daxing, Fangshan, Yanqing, and
Mentougou experience varying degrees of service insufficiency. Although all six
facility types follow the overall gradient structure, their spatial
organization patterns differ significantly: medical and educational facilities
exhibit strong hierarchical and core-concentrated characteristics;
Transportation facilities show strong network continuity; Commercial shopping
facilities display a multi-centered nodal expansion pattern; Leisure and entertainment
facilities are relatively dispersed; and life service facilities are
characterized by high density, wide coverage, and strong grassroots-level
balance. The results further indicate that the MRGS2SFCA model can effectively
overcome the limitations of the traditional Two-Step Floating Catchment Area
(2SFCA) method under fixed thresholds and uniform service radii in representing
multiple facility types, enabling comparable expressions of different
facilities within a unified analytical framework. This study provides methodological
support and empirical evidence for optimizing public service facility
allocation, promoting 15-minute living circle construction, and advancing
refined urban governance in Beijing.
Keywords: public service facilities; POI; accessibility; MRGS2SFCA
model
DOI: https://doi.org/10.3974/geodp.2026.05.04
1 Introduction
Public service facilities, as
fundamental elements supporting urban development, play a critical role in
sustaining urban operations, enhancing residents’ well-being, and promoting
social equity. These facilities cover multiple sectors, including education, medical
care, transportation, commercial shopping, life services, and leisure and entertainment,
directly serve residents’ daily needs[1]. Achieving the spatially
balanced allocation of public service facilities and the coordination between
supply and demand is an important pathway toward improving urban livability and
promoting sustainable development[2]. At the global level, this goal
is highly consistent with the United Nations Sustainable Development Goals,
particularly SDG 11 on sustainable cities and communities[3]; at the
national level, it also responds to China’s new urbanization strategy, which
emphasizes equalization and inclusiveness in public service provision[4,5].
Against the backdrop of rapid urbanization, public service demand in
Beijing has become increasingly diverse and dynamic, while the spatial
imbalance of facility supply has become more pronounced[6,7]. As a
typical megacity, Beijing is characterized by a large spatial extent, complex
functional zoning, and a marked core-periphery structure. Significant
differences exist across areas in terms of population density, employment
activities, transport conditions, and service demand, making the mismatch
between facility supply and demand even more prominent. Reliance solely on
facility counts or per capita indicators is no longer sufficient to accurately
identify real differences in service access within the city.
In recent years, spatio-temporal big-data-based spatial
heterogeneity analysis, statistical modeling, and indicator system construction
have gradually become important technical approaches for monitoring public
service facility coverage and supply-demand relations. Related studies have
mainly focused on 3 aspects: first, methods for characterizing spatial
heterogeneity, such as service evaluation from the perspective of living
circles and demand density analysis based on mobile data[6,7]; second,
the application of intelligent algorithms in facility optimization, such as
commercial solvers, heuristic algorithms, deep reinforcement learning, and
graph convolutional networks[6,8–10]; and third, the integration of
GIS and spatial statistical methods to quantify public service inequalities[8,9].
Meanwhile, POI data can be used to finely depict the spatial distribution of
facilities, population data can reflect potential demand, and road network data
provide the basis for accessibility analysis. The integration of multi-source
data has thus become an important approach for studying urban public service
supply-demand relations[11–13].
Nevertheless, existing studies still face 2 key limitations in the
analysis of multi-type public service facilities. First, different facility
types are usually measured separately, lacking a unified parameter framework.
As a result, although the findings can describe the distribution of individual
services, they are difficult to compare horizontally on the same scale, thereby
weakening the explanatory power regarding the overall urban service structure.
Second, although the traditional Two-Step Floating Catchment Area (2SFCA)
method has been widely used because it balances supply-demand considerations
with computational feasibility, it relies on a fixed service radius and a
binary distance threshold, that is, locations within the service range are
regarded as fully accessible, whereas those outside are regarded as
inaccessible. This “covered versus uncovered” treatment ignores the objective
fact that service effects decay continuously with distance, and it tends to
produce a large number of zero or near-zero values in peripheral and
low-density areas, thereby underestimating the actual service level in outer
areas[14,15].
This limitation is particularly evident in the context of Beijing.
The city exhibits a pronounced core-periphery
structure, with dense facilities and highly concentrated population
activities in the central urban area, whereas peripheral areas are relatively
sparsely served and characterized by longer commuting distances. If fixed
thresholds and uniform service ranges are still adopted, the advantages of the
central area may be overstated, while the possibility for peripheral areas to
obtain services from secondary facilities may be underestimated[16].
This problem becomes even more acute when the research object is extended to 6
types of facilities, namely education, medical care, transportation, commercial
shopping, life services, and leisure and entertainment. These facility types
differ significantly in service coverage scale, supply capacity, frequency of
use, and spatial attractiveness. If a uniform radius or a uniform decay
mechanism is applied, it is difficult not only to reflect hierarchical differences
among facilities but also to accurately characterize the composite structure of
urban public services[17–20].
In this context, the Multi-Radius Gaussian Two-Step Floating
Catchment Area (MRGS2- SFCA) model provides a more interpretable methodological
pathway for analyzing public service accessibility in complex urban settings.
Compared with the traditional 2SFCA, MRGS2SFCA introduces a Gaussian
distance-decay function, multi-level service radii, and differentiated facility
weights, thereby structurally improving the conventional model. It transforms
accessibility from a binary judgment of “covered or not” into a weighted
process that changes continuously with distance, effectively alleviating the
truncation effect caused by fixed thresholds. At the same time, it captures the
spatial influence of facilities at different levels through multi-scale service
ranges and reflects differences in service capacity through hierarchical
weights, thus providing a more realistic description of the spatial interaction
between service supply and demand within the city. Overall, MRGS2SFCA offers a
more suitable methodological foundation for analyzing the supply and demand of
multi-type public service facilities in Beijing and provides a new analytical
framework for revealing spatial heterogeneity and supply-demand mismatches.
2 Methods
2.1 Research Design and Overall Framework
This
study takes the built-up areas of Beijing’s 16 districts as the research scope
and develops an analytical framework integrating multi-source data and multiple
methods to characterize the spatial relationships between public service supply
and demand (Figure 1). First, population data, road network data, building
footprint data, and POI data for six categories of public service facilities
are integrated, and all datasets are uniformly clipped and preprocessed
according to Beijing’s administrative boundary and built-up area extent. On
this basis, the built-up area is subdivided into block units using the road
network, and blocks with a population greater than 100 are selected as the
research units to ensure that the analytical units can realistically reflect
residents’ activity spaces and service demand. Second, the POI data are
semantically cleaned and reclassified into 6 categories of facilities: transportation,
medical care, education, commercial shopping, services, and leisure and entertainment.
A hierarchical parameter system is then constructed by incorporating differences
in service range, service targets, and supply capacity among facilities.
Subsequently, in the spatial analysis stage, built-up area analysis, kernel
density analysis, and the MRGS2SFCA model are jointly applied to examine public
service facilities in
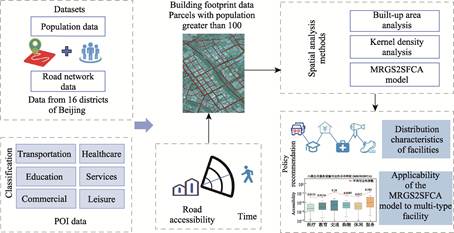
Figure 1 Research
framework
Beijing. Specifically,
built-up area analysis is used to define the effective study space, kernel
density analysis is used to reveal the spatial agglomeration patterns of the
six facility types, and the MRGS2SFCA model is used to measure accessibility and
supply-demand matching relationships for different facilities under a unified
spatial scale. Finally, the results are comprehensively analyzed and evaluated
from 3 aspects: the distribution characteristics of the six categories of
public service facilities, their accessibility patterns, and the applicability
of the MRGS2SFCA model in the study of multiple facility types in Beijing,
thereby providing methodological support for the optimization and refined
governance of public service facility allocation in Beijing.
2.2 Data Collection and Preprocessing
2.2.1 Urban Boundary
and Built-up Area Extraction
The basic datasets used in this study include
administrative boundary data, population data, road network data, and
multi-source remote sensing imagery. The vector data for Beijing’s
administrative boundary were obtained from the National Platform for Common
Geospatial Information Services
(accessed on 2 February 2026), and were used to define the study area and clip
the relevant spatial datasets. The built-up area boundary data of Beijing were
provided by the Remote Sensing Application Center of the Ministry of Housing
and Urban-Rural Development and were derived for the 2025 Urban Physical
Examination Program. These data were used to delineate the effective urban
built-up area for this study.
To ensure spatial
consistency among different datasets, the administrative boundary, built-up
area boundary, population, road network, and POI data were transformed into a
unified coordinate system and spatially matched. All datasets were projected
into the CGCS2000 3 Degree GK CM 117E coordinate system. On this basis, the
road network was overlaid with the built-up area and subdivided by roads to
form urban “block” units. Population data were then linked to the block
attribute table, and blocks with a population greater than 100 were selected as
the final research units[21].
2.2.2 Road Network
The
road network data used in this study were obtained from OpenStreetMap
(accessed on 2 April 2026). First, vector road network data for Beijing were
acquired from the platform and clipped according to the administrative boundary
of Beijing to extract road information within the study area. Subsequently,
road features were organized based on road attribute fields, and dual-line
roads were merged into single-line representations to improve the consistency
of the network structure.
During
preprocessing, topological rules for the road network were established, and
topology checking and repair were conducted to eliminate isolated road
segments, dangling nodes, and broken connections, thereby ensuring network
connectivity and the reliability of subsequent analyses.
2.2.3
Population Data
Population
data were obtained from WorldPop(accessed
on 2 April 2026) using the UN-adjusted “Unconstrained” product with a spatial
resolution of 100 m×100 m. The data were first projected into the CGCS2000 3
Degree GK CM 117E coordinate system and then clipped according to the
administrative boundary of Beijing to ensure consistency with the spatial
extent of the study area.
Subsequently, the population raster data were mapped onto block units
through spatial overlay, enabling consistent representation between population
data and spatial analysis units.
2.2.4
POI Data
The
public service facility data used in this study were obtained from the Amap
Open Platform (accessed on 2 April
2026). POI data within Beijing were acquired through the API interface, and
coordinate transformation and format standardization were carried out so that
all data were unified under the CGCS2000 3 Degree GK CM 117E coordinate system.
During
preprocessing, POI data were classified and organized using a combination of
keyword search and spatial filtering. Facility types closely related to
residents’ daily life were selected, including education, medical care, transportation,
commercial shopping, life services, and leisure and entertainment. The POI data
were then cleaned, deduplicated, and spatially corrected in ArcGIS Pro to
ensure data quality.
Table
1 POI types, subtypes, codes, and maximum travel times
within the living circle
|
Type
|
Subtype
|
Code
|
Maximum travel time in
living circle
|
|
Education
|
Kindergarten
|
160101
|
5 min
|
|
Primary school
|
160102
|
10 min
|
|
Secondary school
|
160103
|
15 min
|
|
Medical care
|
General hospital
|
170101
|
15 min
|
|
Specialized hospital
|
170102
|
15 min
|
|
Nursing home and orphanage
|
170201
|
15 min
|
|
Transportation
|
Subway station
|
230111
|
15 min
|
|
Bus stop
|
230112
|
10 min
|
|
Commercial shopping
|
Shopping mall
|
130102
|
15 min
|
|
Supermarket
|
130106
|
10 min
|
|
Life services
|
Hairdressing and bathing
|
140300
|
15 min
|
|
Telecom service outlet
|
140201
|
15 min
|
|
Leisure and entertainment
|
Park
|
180304
|
15 min
|
|
Square
|
180306
|
15 min
|
2.3 Data Structure and Variable Settings
On
the demand side, gridded population data were used to represent spatial demand
intensity. Each demand unit is characterized by the population size  , whose value is derived from the field grid code. This
variable directly participates in the calculation of the supply- demand ratio
and is used to reflect differences in demand size among spatial units.
On the supply side, 6 categories of facilities
were used. After semantic cleaning and classification, all facilities were
converted into a structurally unified data format. Each facility unit  contains 3 core parameters: service radius (Radius_D),
distance decay parameter (
 ), and supply capacity (Supply_C). Radius_D
is used to define the service influence range, is used to
characterize the decay of service influence with distance, and Supply_C
is used to reflect the relative service capacity of the facility. These
parameters were assigned based on the POI category classification so as to ensure a consistent logical basis for representing
different facilities in the model[22].
2.4 Hierarchical Classification and Construction of
the Parameter System
To
avoid the subjectivity that may arise from assigning parameters directly
according to facility categories, this study introduced a hierarchical
classification scheme to uniformly represent different facility types. The
hierarchy was defined according to service coverage scale and service target
range, and facilities were divided into 5 levels (L1–L5). Facilities capable of
providing cross-regional services with broader coverage were assigned to higher
levels, whereas facilities limited to local areas and mainly serving daily
needs were assigned to lower levels. This classification transforms different
facility types into comparable analytical units under a unified scale and
thereby provides the basis for parameter setting.
Within the
hierarchical system, service radius, distance decay parameter, and supply
capacity are consistently associated with facility level: service radius
increases with hierarchy level to reflect the broader service range of
higher-level facilities; the distance decay parameter is kept on the same scale
as service radius so that service influence decreases continuously in space;
and supply capacity increases with hierarchy level to represent differences in
service provision among facilities. The coordinated setting of these three
types of parameters enables the model to simultaneously express service range,
service strength, and spatial decay mechanisms[23].
2.5 Distance Measurement
and Spatial Consistency Processing
To
ensure consistency between spatial distance calculation and model parameter
settings, all spatial data were projected into the same metric coordinate
system before computation so that service radius (Radius_D) and distance
decay parameter () would share the same unit of measurement. On this basis,
Euclidean distance was used to represent the spatial relationship between
demand points and facility points:
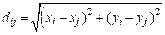 (1)
where
 denotes the spatial distance between demand point
 and facility point , and
 and
 are the planar coordinates of the corresponding points.
Euclidean distance
was adopted mainly because it can directly reflect the spatial relationship
between facilities and population under a unified spatial reference, while
maintaining a balance between computational efficiency and stability. This
makes it suitable for large-scale accessibility analysis involving multiple
facility types. Moreover, with the introduction of the Gaussian decay function,
the effect of distance on service influence is represented continuously,
allowing Euclidean distance to satisfy the model’s need to characterize spatial
gradient variation[24].
2.6
MRGS2SFCA Model Implementation and Multi-Type Coupling
Based
on the previously established data structures and hierarchical parameter
framework, this study applies the MRGS2SFCA to quantify the accessibility of
public service facilities. On the demand side, population grids are used to
represent spatial demand intensity, with each demand cell characterized by its
population size (), indicating potential service requirements. On the supply side, 6
categories of public service facilities are considered, with each facility unit
defined by 3 core parameters: service radius ( ), distance decay parameter (
 ), and supply capacity (
 ). To ensure comparability across facility types, all
facilities are mapped into a unified hierarchical system based on their service
coverage and level, inheriting corresponding parameter values.
The model
calculates accessibility in two steps. First, the supply-to-demand ratio for
each facility is calculated as:
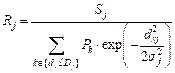 (2)
where  is the supply-to-demand ratio of facility
 ;
 represents its supply capacity;
 is the population
of demand cell
 within the facility’s service radius;
 is the Euclidean distance between the demand cell and the
facility;
 is the service radius; and
 is the distance decay parameter. This step aggregates
population demand within the service radius, weighted by distance, to quantify
the service pressure experienced by each facility.
Second, the
accessibility for each demand point is computed as:
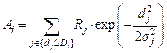 (3)
where
 denotes the
accessibility level of demand point
 , reflecting the level of service obtained after
considering both facility supply capacity and spatial distance. The Gaussian
distance decay function ensures that facility influence decreases continuously
with distance, preventing abrupt changes that can occur when using
fixed-threshold approaches.
This procedure is applied separately to each of the six facility
categories—medical care, education, transportation, commercial shopping, leisure
and entertainment, and life services—and the results are projected onto the
same demand grid. Because all categories share a consistent hierarchical
parameter system and computational framework, the resulting accessibility
measures are directly comparable. This allows the analysis to reveal spatial
distribution characteristics and supply disparities among different public
service systems, providing a robust foundation for subsequent evaluations of
service equity and spatial optimization strategies.
3 Data Results and Analysis
3.1 Spatial Distribution of Facility Coverage in
Beijing
This study takes the
built-up area of Beijing as the study area (Figure 2). As the capital of China
and a typical megacity, Beijing has a large population and a high level of
economic
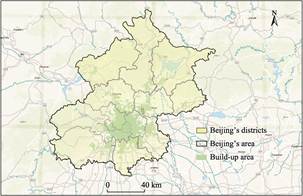
Figure 2 Map of the administrative boundary and built-up area of
Beijing
development,
and is one of the most urbanized and functionally complex cities in China. Over
the long course of urban expansion, Beijing has formed a spatial structure
centered on the urban core and extending progressively outward to peripheral
areas. Significant differences can be observed among different areas in terms
of population distribution, land use, and the allocation of public service
facilities.
The built-up
area of Beijing is the area where population activities and public service
demand are most concentrated, and it is also the spatial unit with the densest
distribution of various public service facilities. With the continuous
advancement of urbanization, public service demand in Beijing has become
increasingly diverse and dynamic, while the spatial imbalance in facility
supply remains prominent, as reflected in the high concentration of service
resources in the central urban area and the relative undersupply in peripheral
areas.
From the
perspective of spatial structure, Beijing exhibits clear functional zoning
characteristics, including core functional zones represented by Dongcheng
District and Xicheng District, high-density development zones represented by
Chaoyang District and Haidian District, and rapidly developing areas such as
Changping and Shunyi. Significant differences in economic development level,
population density, and transport accessibility across these areas give rise to
complex spatial heterogeneity in the supply-demand relationships of public
service facilities.
Therefore,
selecting the built-up area of Beijing as the study area makes it possible to
reveal the intrinsic mechanisms of public service supply-demand relationships
and spatial heterogeneity within the context of a typical megacity, thus
providing a representative basis for subsequent multi-source spatial analysis
and facility optimization.
Figure 3
presents the spatial distribution of comprehensive public service facility coverage
scores at the block scale in Beijing. As shown in the figure, the spatial
distributionof different coverage score levels (1–7) is highly consistent with
Beijing’s urban structure and exhibits a pronounced pattern of “core
concentration-peripheral decline”. High-value areas (levels 6–7) are mainly
concentrated in the urban core, including Dongcheng District, Xicheng District,
central Chaoyang District, and southern Haidian District, where population
density is high, functions are highly concentrated, and the coverage level of
public service facilities is relatively high.
As one moves outward from the urban core
to peripheral areas, coverage scores gradually decline. In suburban areas such
as Fengtai District, Shijingshan District, and southern Changping District,
most blocks fall into medium levels (3–5). In outer suburban areas such as
Shunyi District, Tongzhou District, Daxing District, and Fangshan District,
coverage scores decline further, with most blocks belonging to lower levels
(1–3). In addition, mountainous areas such as Yanqing District and Mentougou
District generally exhibit
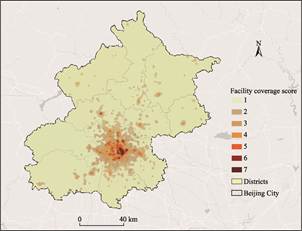
Figure 3 Map of the comprehensive coverage score of public
service facilities in Beijing (2026)
clusters
of low values and relatively low levels of public service facility coverage.
Overall, the
coverage of public service facilities in Beijing shows a clear spatial gradient
structure, with high-value areas concentrated in the urban core and low-value
areas distributed in the urban periphery and ecological zones. This reflects
the significant spatial coupling between facility allocation, population
distribution, and urban functional structure.
Figure 4 shows
the kernel density distribution characteristics of six types of public service
facilities in Beijing. Overall, all facility types display a pronounced “core
concentration- peripheral decline” pattern, although there are clear
differences in the intensity of agglomeration and the extent of spatial
diffusion.
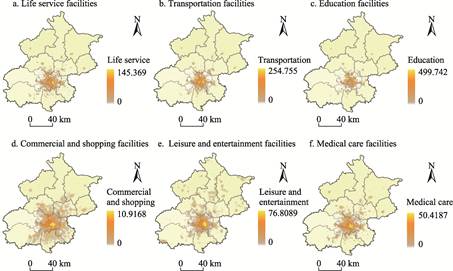
Figure 4 Maps
of the kernel density distribution of the six types of POIs in Beijing (2026)
For educational
facilities, high-density areas are mainly concentrated in the central urban
area, particularly forming obvious clusters in Dongcheng District, Xicheng
District, and southern Haidian District, and then decline rapidly toward the
periphery, indicating that high-quality educational resources are strongly
attached to the urban core. Leisure and entertainment facilities have a
relatively broader distribution range. While high-value areas are formed in the
central urban area, scattered secondary hotspots also appear in some suburban
areas, reflecting a certain degree of spatial diffusion in their service
targets.
Medical
facilities exhibit an overall distribution pattern of “multiple cores + central
strengthening”. In addition to high-density agglomeration in the urban core,
local high-value points are also found in areas such as Tongzhou and Changping,
indicating a certain degree of balanced spatial distribution of medical
resources, although the urban core still remains dominant overall. Commercial
facilities have the highest kernel density and the largest agglomeration range,
forming a significant high-value core in the central urban area and extending
outward along major urban development axes, reflecting the strong dependence of
commercial activities on population and transportation.
Life service
facilities (life services) show a distribution pattern similar to that of
commercial facilities, but with slightly lower agglomeration intensity,
presenting a spatial pattern centered on the urban core and gradually diffusing
toward suburban areas. Transportation facilities, by contrast, exhibit a strong
networked distribution pattern. While high-density nodes are formed in the
central urban area, they also extend outward along major transport corridors,
showing strong spatial continuity and reflecting the supporting role of
transport infrastructure in shaping urban spatial structure.
Overall, the six
types of public service facility POIs in Beijing all exhibit obvious
agglomeration characteristics in space, but differ in terms of agglomeration
intensity, diffusion range, and spatial balance. Commercial and life services
facilities show the most significant agglomeration, followed by educational and
medical facilities, while leisure and entertainment and transportation
facilities exhibit relatively stronger spatial extensibility. These differences
reflect variations in the functional attributes, service targets, and
location-selection mechanisms of different types of public service facilities,
and also reveal the spatial heterogeneity in the allocation of public service
facilities in Beijing.
On this basis, each type of POI was mapped to a
corresponding hierarchical level according to its semantic category and
inherited the associated parameters, thereby completing the transformation
process of “semantic classification-hierarchical mapping-parameter assignment”.
The unified hierarchical parameter system is shown in Table 2 and Figure 5.
Table
2 Hierarchical parameter mapping
scheme of the public service facility in Beijing (2026)
|
Level
|
Service characteristics
|
Service radius (m)
|
Σ (m)
|
Supply coefficient
|
|
L1
|
City-level core facilities (cross-regional service)
|
8,000–12,000
|
2,500–3,500
|
4–5
|
|
L2
|
Regional key facilities (cross-area service)
|
5,000–8,000
|
1,500–2,500
|
3–4
|
|
L3
|
Medium-scale facilities (street/area service)
|
3,000–5,000
|
1,000–1,500
|
2–3
|
|
L4
|
Community-level facilities (local service)
|
1,000–3,000
|
500–1,000
|
1–2
|
|
L5
|
Neighborhood-level facilities (micro-scale daily
service)
|
300–1,000
|
200–500
|
1
|
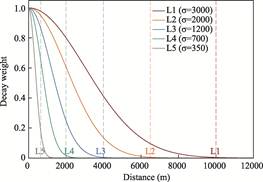
Figure 5 Schematic diagram of the mechanism of hierarchical
parameter action
Through this
hierarchical system, Figure 5 shows that differences in service capacity and
spatial range among different facility types are transformed into a unified
parameter expression, thereby improving the consistency and interpretability of
the model.
3.2 Spatial Distribution of Accessibility for Six
Types of Public Service Facilities
Based on the results
calculated using the MRGS2SFCA model, the six types of public service
facilities in Beijing all exhibit an overall pattern of decreasing
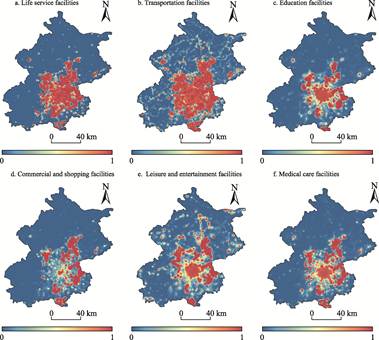
accessibility from the central urban area toward the periphery (Figure 6). However, significant differences can be
observed among facility types in terms of decay intensity and spatial
continuity. Medical facilities display a typical central agglomeration
structure, with high-value areas mainly concentrated in the urban core and
accessibility declining rapidly in peripheral areas, indicating that their
service supply is constrained by both hierarchical systems and resource
concentration. Educational facilities show an overall pattern similar to that
of medical facilities, but local secondary high-value areas are formed in some
sub-centers and cluster areas, suggesting that educational resources exhibit a
certain degree of spatial diffusion, although balanced coverage has not yet
been achieved. Transportation facilities present a high-value network structure
with stronger continuity, where areas of high accessibility extend along major
transport corridors and nodes, and the spatial transition is relatively smooth,
indicating that the connectivity function of transport facilities within the
network structure can effectively reduce spatial impedance. Commercial shopping
facilities exhibit a multi-center distribution pattern, with high-value areas
appearing not only in the urban
core
but also in several regional commercial nodes, suggesting that their spatial
layout depends more strongly on market forces and the distribution of
consumption demand. Leisure and entertainment facilities are distributed in a
relatively scattered manner, with high-value areas appearing as isolated points
or patches and lacking continuous coverage, indicating that their supply is
more strongly influenced by specific resource endowments and functional
positioning. Life service facilities, by contrast, show the most even spatial. distribution
pattern, with high-value areas covering a wide range and spatial decay being
relatively moderate, indicating that under the drive of daily life needs, this
type of facility has formed a relatively dense and stable grassroots service
network
Overall,
although all six facility types exhibit a core-periphery
gradient structure, their formation mechanisms are not identical. Medical care
and education rely more heavily on hierarchical systems and administrative
allocation; Transportation reflects the continuity of network structure; Commercial
shopping reflects market-oriented nodal agglomeration; Leisure and entertainment
facility shows dispersed distribution under the constraints of resources and
function; and life services are characterized by high density and broad
coverage. These differences indicate that different types of public services do
not expand homogeneously within the same urban space, but rather jointly shape
the urban service pattern through different mechanisms.
3.3 Comprehensive Comparison and Structural
Differences in the Accessibility of the Six Types of Facilities
On the basis of spatial
distribution analysis, a statistical comparison of the accessibility of the six
types of facilities can more clearly reveal the differences between their
overall levels and distribution characteristics (Figure 7). In terms of average
accessibility, life services and transportation
facilities are significantly higher than the other types, with life service
facilities having the highest average value, followed by transportation
facilities. This indicates that these two types have stronger universality and
availability in spatial supply. Commercial shopping facilities are at a medium
level. Medical care and education facilities are generally
Figure
6 Distribution maps of accessibility to six types of
public service facilities
in Beijing based on the MRGS2SFCA model (2026)
lower,
reflecting a stronger selectivity in their spatial service supply. Leisure and entertainment
facilities are also at a relatively low level, indicating that their coverage
range and service continuity are relatively limited.
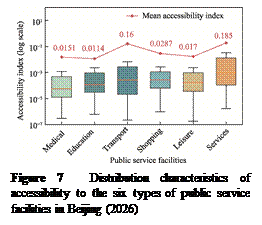 In terms of distribution
patterns, significant differences exist in the degree of dispersion among
facility types. The boxplot ranges of transportation and life service
facilities are relatively concentrated, indicating that their accessibility
varies less across regions and reflects a relatively high degree of spatial
balance. The distributions of medical and educational facilities show more
obvious long-tail characteristics, with high-value areas concentrated but
low-value areas widely distributed, indicating a high degree of spatial
imbalance. Commercial shopping and leisure and entertainment facilities fall
between these two extremes, with their distributions containing both a certain
range of medium- accessibility areas and local coexistence of high and low
values. Combined with Figure 6, these statistical differences can be further
understood as resulting precisely from the different spatial organization
patterns of the various facility types: network-based and high-density
facilities are more likely to form balanced distributions, whereas hierarchical
and resource-dependent facilities are more likely to generate spatial
disparities.
Overall, the statistical results reflected in Figure 7 do not merely
replicate the spatial distribution maps but provide a quantitative expression
of the accessibility differences among six types of public service facilities.
Different facility types exhibit distinct patterns in terms of average
accessibility, interquartile range, and whisker length, indicating that public service provision in Beijing is not homogeneously distributed
but displays pronounced type- specific differentiation. Transportation and life
service facilities show relatively high average accessibility, and their boxes
and whiskers are also comparatively long, suggesting that while their overall
coverage is extensive, there remain noticeable spatial gradients and regional
variations; accessibility across different areas is not uniform but exhibits a
continuous decline from high to low. In contrast, commercial shopping and leisure
facilities are at moderate levels, with spatial patterns situated between those
of transportation/life services and medical/educational facilities, indicating
that their spatial organization relies on a limited number of support nodes,
showing a certain degree of clustering and unevenness. Medical and educational
facilities have relatively low average accessibility, with lower-end values
extending more prominently, reflecting that their service provision is
spatially concentrated and that some areas still experience substantial
accessibility deficits. Therefore, the overall structure of Beijing’s public
service system can be characterized by broadly distributed basic services with
internal gradients, while specialized services are more concentrated and
exhibit greater spatial disparity. These findings provide a foundation for
subsequent analyses focusing on supply mechanisms and spatial optimization.
4 Discussion and Conclusion
Public
service facilities in Beijing as a whole exhibit is a pronounced pattern of
“core concentration-peripheral decline” in space. Areas of high coverage and
high accessibility are mainly concentrated in the core urban districts,
including Dongcheng District, Xicheng District, central Chaoyang District, and
southern Haidian District, whereas peripheral areas such as Shunyi, Tongzhou,
Daxing, Fangshan, Yanqing, and Mentougou experience varying degrees of service
insufficiency. This pattern is highly consistent with the long-established core-periphery
urban structure of Beijing and reflects the significant coupling between public
service facility allocation, population density, land development intensity,
and functional zoning. Further analysis shows that although all six facility
types follow the overall gradient structure, their spatial organization
patterns and formation mechanisms differ significantly: medical and educational
facilities exhibit strong hierarchical and central agglomeration
characteristics; transportation facilities show strong network continuity;
commercial facilities display a multi-centered nodal expansion pattern; leisure
and entertainment facilities are relatively dispersed; and life service
facilities are characterized by high density, broad coverage, and strong
grassroots-level balance. This indicates that Beijing’s public service system
is not a single homogeneous system, but rather a composite structure jointly
shaped by different service scales, supply mechanisms, and functional attributes.
On this basis, this study argues that the traditional Two-Step Floating
Catchment Area method, under fixed thresholds and uniform service radii, cannot
accurately capture differences among multiple facility types in terms of
service range, spatial attractiveness, and supply capacity. By contrast,
MRGS2SFCA introduces continuous distance decay, multi-scale service ranges, and
hierarchical weights, thereby achieving comparable representation of different
facilities within the same analytical framework and more realistically
reflecting the spatial heterogeneity of public service supply and the supply-demand
mismatch within megacities. Overall, Beijing’s public service system exhibits a
structural feature in which “high-frequency basic services tend to be balanced,
whereas professional and hierarchical services show significant disparities”.
The analytical framework constructed in this study not only helps reveal the
spatial differentiation patterns of public service supply within megacities,
but also provides methodological support and empirical evidence for the
optimization of public service facility allocation, the development of living
circles, and refined urban governance in Beijing.
Author
Contributions
Tian,
H. Z. was responsible for data collection and manuscript writing. Jiang, X. H.
and Alimujiang, A. were responsible for data verification and methodology
design. Zhang, N. processed the data and contributed to part of the manuscript
writing. Wang, S. H. reviewed, supervised, revised, and improved the paper.
Acknowledgements
We would like
to thank the Key Laboratory of Historical and Cultural Heritage Monitoring, Ministry
of Housing and Urban-Rural Development for its data and technical support for
this study.
Conflicts of
Interest
The authors declare no conflicts of interest.
References
[1]
Li, Y., Guo, C. Y., Wang, L. Spatial
pattern analysis and influencing factors of urban public service supply level
in China [J]. Science & Technology Review, 2023, 41(16): 145–156.
[2]
Wu, P. P., Zhu, X. C., Wang, W. Study on
the supply-demand matching of public service facilities in Shanghai: an
analysis from the perspective of residents’ heterogeneous demands [J]. Urban
Problems, 2023(4): 87–95.
[3]
Bennett, J., Iossa, E. Building and
managing facilities for public services [J]. Journal of Public Economics,
2006, 90(10–11): 2143–2160.
[4]
Gao, Y. Research on the impact of basic
public health service supply on consumption upgrading [D]. Wuhan: Central China
Normal University, 2025.
[5]
Wei, X. Y., Tian, W. T. The spatial layout
of urban public service facilities, flow of talents and urban spatial
efficiency [J]. Journal of Statistics and Information, 2025, 40(4): 115–128.
[6]
Zhao, M. F., Zhang, L. Q., Wang, D. G. Differental
distribution and influencing factors of urban public service facility distribution
from a life circle perspective: a comparative analysis of cities of different sizes
in the Bejing-Tianjin-Hebei Region [J]. Urban Development Studies, 2024,
31(10): 77–86+107.
[7]
Liang, H., Wang, S., Li, H., et al.
Sponet: solve spatial optimization problem using deep reinforcement learning
for urban spatial decision analysis [J]. International Journal of Digital
Earth, 2024, 17(1): 2299211.
[8]
Chen, G. Q. Research on the construction
and validation of AED allocation plan in Nanning based on the MCLP model [D]. Nanning:
Guangxi Medical University, 2025.
[9]
Xu, G. S. Spatial heterogeneity and
driving factors of ecosystem services in Liaoning Province: a GIS-based
analysis [J]. Beidou and Spatial Information Application Technology,
2025(6): 16–20.
[10]
Zhong, E. S. Deep mapping—a critical engagement
of Cartography with Neuroscience [J]. Geomatics and Information Science of
Wuhan University, 2022, 47(12): 1988–2002.
[11] Chang,
M. Y. Research on the spatial layout and driving factors of public service
facilities in the core district of Zhengzhou based on the perspective of equity
and justice [D]. Zhengzhou: Henan Agricultural University, 2024.
[12]
Li, H. Y., Zhang, Z. B., Chen, L., et
al. Accessibility-based spatial allocation of public service facilities in
Lanzhou New Area [J]. Journal of Arid Land Resources and Environment,
2024, 38(7): 125–134.
[13]
Li, Y. F., Qiao, W. F., Yang, C. H., et
al. Evaluation and optimization strategy of village and town construction pattern
based on the accessibility of public service facilities: a case study of Jintan
District, Changzhou City [J]. Geography and Geo-Information Science,
2024, 40(1): 106–113.
[14]
Fu, L., Wang, Y., Zeng, B., et al. Spatial
accessibility of medical facilities in Beibei District based on modified two-step
floating catchment area method [J]. Journal of Geo-information Science,
2019, 21(10): 1565–1575.
[15]
Yang, X. T., Li, F. X., Luo, T. Y., et
al. Research on the spatial accessibility of indoor emergency shelters based
on improved two-step floating catchment area method: a case study in the urban core
area of Shenzhen [J/OL]. Journal of Catastrophology, 2026(3): 217–226.
[16]
Niu, X. Y., Chen, C. Measuring spatial
equality and justice of basic public services in suburban towns [J]. City
Planning Review, 2018, 42(10): 42–50.
[17]
Zhang, C. Y., Li, J. T., Liu, Y., et al.
Spatial patterns and driving factors of ecosystem service value in the Caizi
Lake [J/OL]. Pratacultural Science, 2026.
[18]
Gao, W., Li, Y. Q., Zhao, M., et al.
Accessibility analysis on public service facilities in Beijing under the supply
and demand of TOD station area [J]. Acta Scientiarum Naturalium
Universitatis Pekinensis, 2025, 61(6): 1091–1104.
[19]
Xu, R. L., Liu, Q. Q., Liao, Y., et al.
Coverage-suitability assessment and optimization of public service facilities
within the 15-minute living circle: a case study of Nanjing’s main urban area [J].
Progress in Geography, 2026, 45(1): 209–224.
[20]
Wei, W., Cai, Y. K., Chen, X. X. How does
the supply of basic public services affect consumption in China: based on an inequality
of opportunity perspective [J]. Consumer Economics, 2023, 39(1): 33–45.
[21] Zhang,
Y., Li, Q. Z., Huang, H. P., et al. The combined
use of remote sensing and social sensing data in fine-grained urban land use
mapping: a case study in Beijing, China [J]. Remote Sensing, 2017,
9(9): 865.
[22] Luo,
W., Wang, F. H. Measures of spatial accessibility to health care in a GIS
environment: synthesis and a case study in the Chicago region [J]. Environment
and Planning B: Planning and Design, 2003, 30(6): 865–884.
[23]
Zhang, H. Hierarchical analysis and
expression of urban road network based on complex network—taking Jinan and
Beijing as examples [D]. Beijing: China University of Geosciences (Beijing),
2021.
[24]
Luo, W., Qi, Y. An enhanced two-step
floating catchment area (E2SFCA) method for measuring spatial accessibility to
primary care physicians [J]. Health & Place, 2009, 15(4):
1100–1107.
[25]
McGrail, M. R., Humphreys, J. S. Measuring
spatial accessibility to primary care in rural areas: improving the
effectiveness of the two-step floating catchment area method [J]. Applied
Geography, 2009, 29(4): 533–541.
[26]
Dai, D. J.
Racial/ethnic and socioeconomic disparities in urban green space accessibility:
where to intervene? [J]. Landscape and Urban Planning,
2011, 102(4): 234–244.
[27]
Wang, F. H. Measurement,
optimization, and impact of health care accessibility: a methodological review [J]. Annals
of the Association of American Geographers, 2012, 102(5): 1104–1112.