Development
of the Global Spatiotemporal Distribution Dataset of Jewelry Auctions from
Sotheby’s and Christie’s (2014–2023)
WANG Yuqing1, 2 CHEN Jie1*
1. Institute of Geographic Sciences and
Natural Resources Research, Chinese Academy of Sciences, Beijing 100101, China;
2. University of
Chinese Academy of Sciences, Beijing 100049, China
Abstract: Jewelry
auctions provide a distinctive perspective for investigating mid-to-high-end
consumption within the framework of consumption geography. This study
systematically compiled global jewelry auction transaction records from
Sotheby’s and Christie’s during 2014–2023, and integrated geospatial big-data
processing techniques with gemological knowledge. Through key procedures
including text data processing, jewelry dictionary construction, jewelry
category identification, and multidimensional data aggregation, The Global
spatiotemporal distribution dataset of jewelry auction from Sotheby’s and
Christie’s (2014–2023) was developed. The dataset includes the spatiotemporal
distribution data for global jewelry auction transactions aggregated from the
two auction houses, and related statistical data. The analytical results showed
that, temporally, the global jewelry auction market underwent a transformation
from “quantity” to “quality”, forming a threefold structure in which white
diamonds maintained market liquidity, colored diamonds led value peaks, and
traditional colored gemstones provided stable support. Spatially, New York,
Geneva, and Hong Kong occupied leading positions in transaction activity and
unit value, constituting the core triangle of the global jewelry auction
market. With respect to jewelry categories, the high concentration of jadeite
in Hong Kong and the value premium of colored diamonds in Geneva indicate the
profound shaping effects of regional culture and consumer preferences on the jewelry
market pattern. The development of this dataset fills a gap in fine-grained
spatiotemporal data for the field of mid-to-high-end consumption. The dataset
is archived in .xlsx and .shp data formats, and consists of 6 data files with
data size of 56.3 KB (compressed into one file with 44.6 KB).
Keywords: global jewelry auction; consumption geography; gemology; Sotheby’s; Christie’s
DOI: https://doi.org/10.3974/geodp.2026.02.06
Dataset Availability Statement:
The dataset
supporting this paper was published and is accessible through the Digital Journal of
Global Change Data Repository at:
https://doi.org/10.3974/geodb.2025.12.07.V1.
1 Introduction
Consumption
geography is an important branch of human geography[1]. Taking
consumption practices as its carrier, consumption geography explores in-depth
the complex interactions and evolution of human-environment relationships.
Traditionally, studies in consumption geography have mainly focused on mass
consumption behavior and its spatial characteristics. With the continuous
socio-economic development of China, residents’ consumption structure has been
steadily upgraded, showing a trend toward mid-to-high-end consumption that goes
beyond the level of mass consumption.
Jewelry, as a
special commodity characterized by beauty, durability, rarity, and
craftsmanship value[2,3], is essentially different from ordinary
mass-consumption goods with respect to consumption behavior. The jewelry
auction market is not only an important mechanism for jewelry price discovery[4–7],
but also a typical arena reflecting trends in mid-to-high-end consumption. It
therefore provides a distinctive perspective from which consumption geography
can investigate mid-to-high-end consumption practices. By systematically
integrating global jewelry auction transaction records and applying geospatial
big-data processing techniques[8], this study developed a global
jewelry auction spatiotemporal distribution dataset. Theoretically, this
dataset can provide a representative empirical case and data foundation for
research on mid-to-high-end consumption in consumption geography. Practically,
it can also offer a scientific basis and decision support for deepening
supply-side structural reform and promoting high-quality development in China’s
jewelry industry.
2 Metadata for the Dataset
The
metadata for the Global spatiotemporal distribution dataset of jewelry auction
from Sotheby’s and Christie’s (2014–2023)[9] is summarized in Table
1. It includes the dataset’s full name, short name, authors, year of the
dataset, temporal resolution, data format, data size, data files, data
publisher, and data-sharing policy.
3 Methods
3.1 Data Sources
The
raw data for this dataset were derived from the jewelry auction transaction
records from Sotheby’s and Christie’s, two long-established and dominant
international auction houses in the global art auction market. More
specifically, this study employed big-data acquisition techniques to
systematically collect jewelry auction transaction records from major auction
center cities worldwide; these jewelry auction results were publicly released
on their official websites from 2014 to 2023[11,12]. Each record corresponds
to a sold jewelry lot and includes information such as transaction date,
transaction location, title, description, estimated price, realized price,
physical image, and identification certificate. According to the statistics of
this study, from 2014 to 2023, Sotheby’s and Christie’s held a combined total
of 225 jewelry auctions across global auction center cities, with 61,894
jewelry lots sold and a cumulative transaction value of USD 9.586 billion.
Table 1 Metadata
summary of the Global spatiotemporal distribution dataset of jewelry auction
from Sotheby’s and Christie’s (2014–2023)
|
Items
|
Description
|
|
Dataset full name
|
Global
spatiotemporal distribution dataset of jewelry auction from Sotheby’s and
Christie’s (2014–2023)
|
|
Dataset short
name
|
GlobalJewelryAuctionResults2014-2023
|
|
Authors
|
Wang, Y. Q.,
Institute of Geographic Sciences and Natural Resources Research,Chinese Academy
of Sciences, wangyuqing0725@igsnrr.ac.cn
Chen, J.,
Institute of Geographic Sciences and Natural Resources Research,Chinese Academy
of Sciences, chenj@lreis.ac.cn
|
|
Geographical
region
|
6 global jewelry
auction center cities of Sotheby’s and Christie’s (Geneva, London, Paris, New
York, Hong Kong, and Dubai)
|
|
Year
|
2014–2023
|
|
Temporal
resolution
|
Year
|
|
Data format
|
.xlsx, .shp
|
|
|
|
Data size
|
56.3 KB
(compressed into one file, 44.6 KB)
|
|
|
|
Data files
|
Spatiotemporal
distribution data of jewelry auction transaction records aggregated from
Sotheby’s and Christie’s in 6 global auction center cities during 2014–2023,
as well as the related statistical data
|
|
Foundation
|
Chinese Academy
of Sciences (XDB0740000)
|
|
Data publisher
|
Global Change Research Data Publishing & Repository,
http://www.geodoi.ac.cn
|
|
Address
|
No. 11A, Datun
Road, Chaoyang District, Beijing 100101, China
|
|
Data sharing
policy
|
(1) Data are openly available and can be
free downloaded via the Internet; (2) End users are encouraged to use Data subject to citation; (3) Users,
who are by definition also value-added service providers, are welcome to
redistribute Data subject to
written permission from the GCdataPR Editorial Office and the issuance of a Data redistribution license; and (4)
If Data are used to compile new
datasets, the “ten per cent principal” should be followed such that Data records utilized should not
surpass 10% of the new dataset contents, while sources should be clearly
noted in suitable places in the new dataset[10]
|
|
Communication and searchable system
|
DOI, CSTR,
Crossref, DCI, CSCD, CNKI, SciEngine, WDS, GEOSS, PubScholar, CKRSC
|
3.2 Data Processing
|
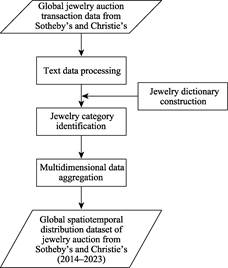
Figure 1 Technical
workflow of the dataset
development
|
On the basis of the above
raw data, this study integrated geospatial big-data processing techniques with
gemological knowledge to design the technical workflow for the Global
spatiotemporal distribution dataset of jewelry auction from Sotheby’s and
Christie’s (2014–2023), as shown in Figure 1. The workflow mainly consisted of 4
key steps: text data processing, jewelry dictionary construction, jewelry
category identification, and multidimensional data aggregation. Through these
steps, unstructured auction records were ultimately transformed into a
standardized spatiotemporal dataset.
(1) Text data
processing
This step aimed to
convert the text data in global jewelry auction transaction records into a
structured and standardized text data table. First, for unstructured text data,
regular expressions were used to extract key fields in a structured manner.
Then, the extracted structured fields were further standardized. For example,
texts in different languages were uniformly translated into English. In
addition to English, the language of global jewelry auction transaction records
included Chinese, French, Italian, and other languages. For text information in
different languages, the Baidu Translation API was used to translate all texts
into English to ensure linguistic consistency in the text data. Additionally,
prices in different currencies were uniformly converted into U.S. dollars
(USD). The estimated prices and realized prices in the global jewelry auction
transaction records were denominated not only in USD, but also in Hong Kong
dollars, Swiss francs, British pounds, and other currencies. According to the international
exchange rate on the transaction date of each lot, the estimated price and
realized price of each jewelry lot were converted into USD to eliminate the
effects of exchange rate fluctuations and different currencies on price
statistics.
(2) Jewelry
dictionary construction
The jewelry
dictionary contains the names of various common jewelry and gemstone
categories. For each jewelry lot in the global jewelry auction transaction
records, this step aimed to establish a criterion for mapping the lot to a
specific jewelry or gemstone category. Specifically, a jewelry category
dictionary was compiled through classification and collation in accordance with
authoritative gemological textbooks and relevant national standards, including
Systematic Gemology[2], Jewelry Appraisal[3], and Gems—Nomenclature
(GB/T 16552—2017)[13]. The dictionary includes the English and
Chinese names of the basic names and trade names of various common jewelry and
gemstone categories, as shown in Table 2.
Table
2 Jewelry dictionary
|
Jewelry name
|
Jewelry name
|
Jewelry name
|
Jewelry name
|
|
colored diamond
|
white sapphire
|
morganite
|
agate
|
|
coloured diamond
|
white jade
|
heliodor
|
malachite
|
|
champagne diamond
|
celadon jade
|
maxixe beryl
|
amethyst
|
|
cognac diamond
|
dark jade
|
cat’s eye
|
citrine
|
|
red diamond
|
russet jade
|
hawk’s eye
|
quartz
|
|
pink diamond
|
yellow jade
|
colored stone
|
pearl
|
|
orange diamond
|
nephrite
|
tanzanite
|
coral
|
|
yellow diamond
|
jadeite
|
tsavorite
|
amber
|
|
green diamond
|
green jade
|
chrysoberyl
|
abalone
|
|
blue diamond
|
greenish-white jade
|
corundum
|
shell
|
|
purple diamond
|
spinach-green jade
|
diamond
|
ivory
|
|
violet diamond
|
mother of pearl
|
ruby
|
moonstone
|
|
brown diamond
|
rock crystal
|
sapphire
|
onyx
|
|
black diamond
|
rose quartz
|
emerald
|
chrysoprase
|
|
colored sapphire
|
smoky quartz
|
opal
|
carnelian
|
|
coloured sapphire
|
green quartz
|
tourmaline
|
cubic zirconia
|
|
pink sapphire
|
tiger’s eye
|
spinel
|
lab diamond
|
|
orange sapphire
|
lapis lazuli
|
peridot
|
moissanite
|
|
yellow sapphire
|
alexandrite
|
topaz
|
synthetic ruby
|
|
green sapphire
|
golden beryl
|
garnet
|
synthetic sapphire
|
|
purple sapphire
|
green beryl
|
jade
|
synthetic emerald
|
|
padparadscha sapphire
|
red beryl
|
turquoise
|
simulated diamond
|
|
padparacha sapphire
|
aquamarine
|
chalcedony
|
|
(3) Jewelry
category identification
This step aimed to
determine the jewelry category corresponding to each jewelry lot. If only one
jewelry category appeared in a lot, that category was directly identified as
the corresponding jewelry category of the lot. For example, for a jadeite
pendant with a green oval cabochon, the corresponding jewelry category can be
directly identified as jadeite. If a lot contains a combination of multiple
jewelry categories, the principal category must be determined according to the
primary-secondary relationship among the components, and that principal
category is then identified as the corresponding jewelry category of the lot.
For example, both sapphire and diamond appear in the lot for a ring that is set
with a 20-carat sapphire as the center stone, two 1-carat white diamonds as
side stones, and mounted in 18k white gold. In this case, sapphire is first
judged as the principal jewelry category according to the primary-secondary
relationship, and the corresponding jewelry category for the lot is therefore
identified as sapphire. Technically, for the text data table for jewelry lots,
the pre-constructed jewelry category dictionary was traversed, and the maximum
forward-matching algorithm was applied to the lot title or description of each
lot for word segmentation to extract all jewelry category terms appearing in
the text. The principal category was then determined according to the
sequential order of the extracted jewelry category terms, and the corresponding
jewelry category for the lot was finally labeled.
(4)
Multidimensional data aggregation
The foregoing
process resulted in global jewelry auction transaction records with clear
structure and explicit category information, with each record containing key
attributes such as time, location, price, and category. In this next step,
these records were aggregated along the three dimensions of “time-location-category,”
and three core indicators were calculated: transaction volume, transaction
value, and average price. On the basis of this process, the Global
spatiotemporal distribution dataset of jewelry auction from Sotheby’s and
Christie’s (2014–2023) was finally generated. The dataset spans 10 years,
spatially covers 6 major global jewelry auction center cities—Geneva, London,
Paris, New York, Hong Kong, and Dubai—and focuses on 7 representative natural
jewelry categories: white diamond, colored diamond, ruby, sapphire, emerald,
jadeite, and pearl. The dataset records a total of 42,445 sold lots, with a
cumulative transaction value of USD 8.939 billion. The transaction value of the
selected seven jewelry categories accounts for more than 93.25% of the total
jewelry transaction value of Sotheby’s and Christie’s during the same period.
This broad coverage indicates that, while maintaining simplicity, the dataset
effectively captures the core transaction characteristics of the global jewelry
auction market and demonstrates good representativeness and application
potential.
4 Data Results
4.1 Dataset Composition
The
final dataset included the spatiotemporal distribution data for jewelry auction
transaction records aggregated from Sotheby’s and Christie’s in 6 global
auction center cities during 2014–2023, as well as the related statistical
data. More specifically, it included the following information. (1) The
spatiotemporal distribution data of global jewelry auction transactions
aggregated from the two auction houses for 2014 to 2023 in the 6 major global
jewelry auction center cities; 7 representative types of mid-to-high-end
jewelry. (2) The related statistical data for jewelry auction transactions from
the two auction houses during 2014–2023: yearly global jewelry auction
transaction scale; transaction scale in 6 global jewelry auction locations;
yearly transaction volume, transaction value, and average price of the 7 major
jewelry categories; and transaction volume, transaction value, and average
price of the 7 major jewelry categories in the 6 global jewelry auction
locations. The dataset is archived in .xlsx and .shp formats. The field
descriptions of the dataset are shown in Table 3.
Table
3 Field descriptions of the dataset
|
No.
|
Field
|
Field name
|
Description
|
|
1
|
Auction year
|
Year
|
2014–2023
|
|
2
|
Auction location (Chinese)
|
Location
|
Geneva, London, etc. (Chinese)
|
|
3
|
Auction location (English)
|
Location_1
|
Geneva, London, etc.
|
|
4
|
Jewelry category (Chinese)
|
Category
|
White diamond, Colored diamond, etc.
|
|
5
|
Jewelry category (English)
|
Category_1
|
White diamond, Colored diamond, etc.
|
|
6
|
Transaction volume (units)
|
Vol (units)
|
e.g., 100
|
|
7
|
Transaction value (100 million USD)
|
Val (100 million USD)
|
e.g., 0.61
|
|
8
|
Average transaction price (10 thousand USD)
|
Avg (10 thousand USD)
|
e.g., 49.87
|
|
9
|
Transaction volume in year YYYY
|
Y_[YYYY]_Vol
|
Field name such as Y_2019_Vol
|
|
10
|
Transaction value in year YYYY
|
Y_[YYYY]_Val
|
Field name such as Y_2019_Val
|
|
11
|
Average transaction price in year YYYY
|
Y_[YYYY]_Avg
|
Field name such as Y_2019_Avg
|
|
12
|
Transaction volume of a given jewelry category
|
[Category]_Vol
|
Field name such as Jadeite_Vol
|
|
13
|
Transaction value of a given jewelry category
|
[Category]_Val
|
Field name such as Jadeite_Val
|
|
14
|
Average transaction price of a given
jewelry category
|
[Category]_Avg
|
Field name such as Jadeite_Avg
|
4.2 Data Results
Analysis
4.2.1 Temporal Distribution of Global Jewelry Auctions from Sotheby’s and
Christie’s
(1)
Transaction scale
Overall, during
2014–2023, with the transition from 2019 to 2020 marking a critical turning
point, the scale of the global jewelry auction market showed a trend of sharp
decline followed by gradual recovery (Figure 2). Specifically, in transaction
volume, the number of lots sold reached 6,526 in 2014, the peak during the
study period. It then declined year by year, and experienced a cliff-like drop
in 2020, decreasing by 54.7% compared with 2019. In 2021, only 1,923 lots were
sold, marking the lowest point of the study period. Although transaction volume
rebounded to 2,740 in 2023, it was still only 42.0% of the 2014 peak level. The
trend in transaction value was similar to that of transaction volume. It
reached the highest point of the study period at USD 1.259 billion in 2014,
then declined synchronously, and fell to the lowest point at USD 518 million in
2020. After 2020, transaction value recovered significantly, rising to USD 958
million in 2023, an increase of 85.0% compared with the 2020 low point. The
trend in average price was markedly different from those for transaction volume
and transaction value. Before 2020, while transaction volume and value fell
substantially, average price remained basically stable, fluctuating within the
range of USD 142,700–192,800 per lot. After 2020, while transaction volume and
value gradually recovered, average price rose sharply, reaching USD 369,000 per
lot in 2021, the highest level during the study period and 81.2% higher than
that in 2014. Overall, the global jewelry auction market experienced a profound
transformation from scale-driven growth to value-driven growth during
2014–2023. Represented by the international jewelry auction market, the demand
for mid-to-high-end jewelry consumption increased dramatically. Against the
background of contraction in total volume, mid-to-high-end jewelry consumption
continued to show a preference for high-priced and high-value lots, thereby
driving the jewelry industry toward refinement and higher value.
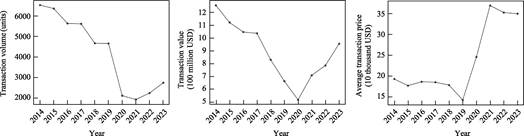
Figure 2 Temporal distribution of transaction scale in global
jewelry auctions from Sotheby’s and Christie’s (2014–2023)
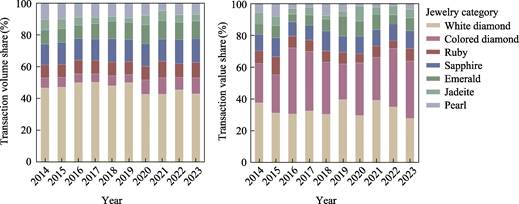
(2) Category
structure
With respect to
transaction volume, from 2014 to 2023, white diamonds consistently ranked first
in volume share and remained the core category in number of lots sold, while
the volume shares of the other six jewelry categories were relatively small and
remained generally stable (Figure 3). In transaction value, white diamonds
maintained a relatively high share, consistently ranging from 25% to 38%.
Colored diamonds were particularly prominent: although their transaction volume
was far lower than that of white diamonds, their share of transaction value was
comparable to that of white diamonds, and even exceeded it in more than half of
the years. In average price, colored diamonds consistently ranked at the top
among the seven jewelry categories and maintained a clear gap from the other
categories (Figure 4). In 2022, the average price of colored diamonds reached
USD 1.6684 million per lot, or 6.17 times that of white diamonds in the same
year. In addition to diamonds, jadeite was noteworthy, as its average price
showed a clear upward trend. Its average price more than doubled from USD
216,100 per lot in 2014 to USD 450,100 per lot in 2023, representing a larger
increase than that of the other jewelry categories. Overall, during 2014–2023,
the global jewelry auction market formed a core pattern in which white diamonds
supported market liquidity, colored diamonds dominated value, and traditional
colored gemstones provided market stability. Changes in the shares of different
categories across years reflect the transformation of the jewelry auction
market toward a stronger focus on high-value categories during the process of
scale contraction.
Figure
3 Temporal distribution of category
structure in global jewelry auctions from Sotheby’s
and Christie’s (2014–2023)
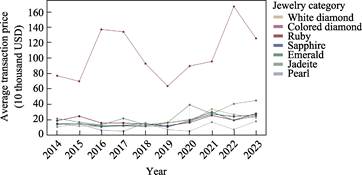
Figure 4 Temporal
distribution of average transaction price by jewelry category in global jewelry
auctions from Sotheby’s and Christie’s (2014–2023)
4.2.2 Spatial Distribution of Global Jewelry Auctions from Sotheby’s and
Christie’s
(1)
Transaction scale
Overall, the
global jewelry auction market is highly concentrated geographically, with core
transactions concentrated in 6 major jewelry auction center cities: New York,
Geneva, Hong Kong, London, Paris, and Dubai (Figure 5). In transaction volume,
New York and London formed the first tier. Of these two cities, New York ranked
first as the most active region in the global jewelry auction market, with
13,333 lots sold during the study period. London ranked second with 10,623 lots
sold. Geneva and Hong Kong formed the second tier, with transaction volumes
ranging from 5,000 to 10,000 lots. Paris and Dubai formed the third tier, each
with fewer than 5,000 lots sold. In transaction value, Geneva ranked first
globally, with a total transaction value of USD 3.573 billion. New York and
Hong Kong formed the second tier, with transaction values ranging from USD 500
million to USD 3 billion. London, Paris, and Dubai comprised the third tier,
each with transaction values of less than USD 500 million. In average price, Hong
Kong and Geneva formed the first tier. Hong Kong ranked first with an average
price of USD 388,400 per lot, while Geneva ranked second with an average price
of USD 377,800 per lot. New York formed the second tier, with an average price
of USD 174,600 per lot. London, Paris, and Dubai remained in the third tier,
each with an average price of less than USD 50,000 per lot. Overall, the six
major auction center cities showed clear tiered differences in transaction
volume, transaction value, and average price, thus forming a distinct spatial
pattern in the global jewelry auction market. Of these, Geneva, Hong Kong, and
New York became the top-tier global jewelry auction centers. Geneva and Hong
Kong jointly constituted the value highlands of that market, while London,
Paris, and Dubai served as secondary high-level trading centers. Together,
these tiers shaped a global spatial pattern of jewelry auctions driven by the
dual cores of “high activity” and “high value”.
(2) Category
structure
Overall, the six major global jewelry
auction center cities exhibited obvious regional differences in preferences for
mainstream jewelry categories (Figure 6). With respect to the transaction
volume shares for the seven major jewelry categories, Geneva, Hong Kong, and
New York showed relatively balanced category structures, whereas London, Paris,
and Dubai displayed a structural feature dominated by white diamond
transactions supplemented by other jewelry categories, with white diamonds
accounting for more than 50% of transaction volume in each city. Additionally,
jadeite accounted for a considerable
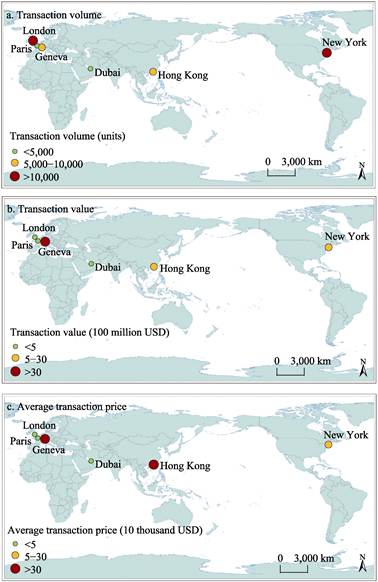
Figure 5 Spatial
distribution maps of transaction scale in global jewelry auctions from
Sotheby’s and Christie’s (2014–2023)
transaction
volume in Hong Kong: from 2014 to 2023, up to 1,625 lots of jadeite were sold
in Hong Kong, accounting for 23.2% of the total transaction volume of the seven
jewelry categories in that city and 79.8% of the total jadeite transaction
volume across all six cities. In transaction value shares, colored diamonds
were particularly prominent in Geneva, Hong Kong, and New York, accounting for
34.9%, 33.5%, and 28.0%, respectively, which were comparable to the transaction
values of white diamonds. Furthermore, the share of jadeite transaction value
in Hong Kong reached 16.0%, far exceeding that in the other jewelry auction
center cities. As for the distribution of average price, all seven mainstream
jewelry categories exhibited a regional pattern, led by Geneva, Hong Kong, and
New York, in value recognition (Figure 7). During 2014–2023, white diamonds,
colored diamonds, and pearls achieved the highest average prices in Geneva,
while rare colored gemstones such as ruby, sapphire, emerald, and jadeite achieved
the highest average prices in Hong Kong. Overall, the six major global jewelry
auction center cities exhibited a clear spatial distribution of jewelry
category preferences. High-quality white diamonds, colored diamonds, and pearls
received higher value recognition in Geneva, whereas jadeite, ruby, sapphire,
and emerald received higher value recognition in Hong Kong. These regional
differences in value recognition profoundly reflect the influence of different
cultural backgrounds and market preferences on the valuation of jewelry
categories.
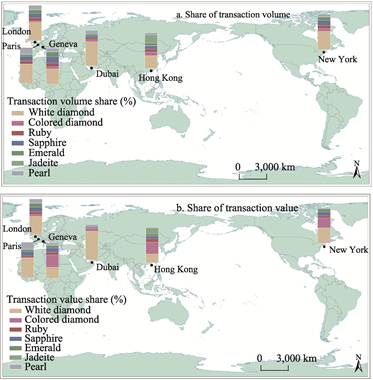
Figure
6 Spatial distribution maps of category
structure in global jewelry auctions from Sotheby’s
and Christie’s (2014–2023)
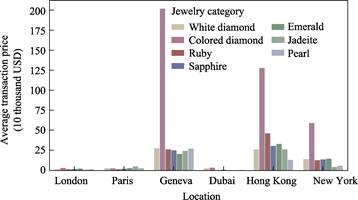
Figure
7 Spatial distribution of average
transaction price by jewelry category in global jewelry
auctions from Sotheby’s and Christie’s (2014–2023)
5 Discussion and Conclusion
Using the global
jewelry auction data publicly released by Sotheby’s and Christie’s during
2014–2023, this study successfully constructed the first jewelry auction
spatiotemporal dataset for consumption geography research through a series of
standardized processing procedures. The analytical results showed that, in the
temporal dimension, the global jewelry auction market experienced a
transformation from “quantity” to “quality”, thereby forming a threefold
structure in which white diamonds maintained market liquidity, colored diamonds
led value peaks, and traditional colored gemstones provided stable support. In
the spatial dimension, New York, Geneva, and Hong Kong occupied leading
positions in transaction activity and unit value, constituting the core triangle
of the global jewelry auction market. Notably, the high concentration of
jadeite in Hong Kong and the value premium of colored diamonds in Geneva
revealed the profound shaping effects of regional culture and consumer
preferences on the jewelry market pattern. The development of this dataset not
only fills the gap in fine-grained spatiotemporal data for the field of
mid-to-high-end consumption, but also provides a new tool for understanding the
mechanisms underlying the spatial differentiation of global jewelry
consumption. At the practical level, the new dataset can provide decision
support for Chinese jewelry enterprises in accurately positioning themselves in
the international market, in optimizing product structure, and enhancing brand
value. In turn, these outcomes serve the strategic goals of industrial
transformation and upgrading and facilitate the improvement of global
competitiveness.
This dataset has certain limitations at
present that should be noted. One, the raw data in the dataset were derived
from only two international auction houses, Sotheby’s and Christie’s. While
highly representative, these data still cannot fully cover all jewelry auction
center cities worldwide. Two, the dataset spans only 10 years, which is
somewhat insufficient for revealing longer-term evolutionary patterns of
mid-to-high-end consumption under the influence of economic cycles,
international politics, and other factors. Therefore, in future work, the
dataset can be further improved in the following aspects. First, jewelry
auction transaction data from other major international auction houses and
regionally well-known jewelry auction houses may be incorporated to enrich the
spatial distribution of global jewelry auction center cities. Second, the
temporal coverage of global jewelry auction transaction records may be extended
to support research on longer-term spatiotemporal evolution patterns of jewelry
auctions. Finally, for the study of mid-to-high-end jewelry consumption,
additional sources and levels of jewelry consumption data—such as retail sales
data of consumer goods and international commodity trade data—may also be
introduced to build a more multidimensional and comprehensive global jewelry
consumption data system, thereby better serving consumption geography research
and the development of global jewelry industry.
Author Contributions
Chen,
J. was responsible for the overall design of the dataset development and
revision of the manuscript; Wang, Y. Q. was responsible for the specific
implementation of the dataset development and manuscript writing.
Conflicts of Interest
The
authors declare no conflicts of interest.
References
[1]
Zhang, H., Sun, J. X. The
review and prospect of consumption geography [J]. Human Geography,
2022(5): 24–31.
[2]
Zhang, B. L. Systematic
Gemology, 2nd ed. [M]. Beijing: Geological Publishing House, 2006.
[3]
Zhang, B. L. Jewelry Appraisal,
2nd ed. [M]. Beijing: Geological Publishing House, 2018.
[4]
Xu, Y. L., Zhou, Q. S., Chen,
Q. L., et al. Jewelry auction market and rules: take Sotheby for example
[J]. Journal of Gems & Gemmology, 2015, 17(3): 48–53.
[5]
Peng, S. Y., Qiu, Z. L., Li, L.
F., et al. Statistical analysis and revelation on pricing factors of
colored diamonds in international auction market [J]. Journal of Gems &
Gemmology, 2013, 15(1): 43–51.
[6]
Zhou, Q. S., Xie, M., Liu, H., et
al. Research on global colourless diamond product auction market based on
data analysis [J]. Journal of Gems & Gemmology, 2020, 22(4):
43–52.
[7]
Zhou, Q. S., Wang, B. Y., Liu,
H., et al. Overview of the international ruby jewelry auction market and
analysis of its price influencing factor [J]. Journal of Gems &
Gemmology, 2021, 23(3): 63–71.
[8]
Pei, T., Liu, Y. X., Guo, S.
H., et al. Principle of big geodata mining [J]. Acta Geographica
Sinica, 2019, 74(3): 586–598.
[9]
Wang, Y. Q., Chen, J. Global spatiotemporal
distribution dataset of jewelry auction from Sotheby’s and Christie’s (2014–2023)
[J/DB/OL]. Digital Journal of Global Change Data Repository, 2025.
https://doi.org/10.3974/geodb.2025.12.07.V1.
[10]
GCdataPR Editorial Office.
GCdataPR data sharing policy [OL]. https://doi.org/10.3974/dp.policy.2014.05
(Updated 2017).
[11]
Sotheby’ s. Auction Results
[OL]. https://www.sothebys.com/en/results?locale=en.
[12]
Christie’ s. Auction Results
[OL]. https://www.christies.com/en/results.
[13]
General Administration of
Quality Supervision, Inspection and Quarantine of P. R. China, National
Standardization Administration. Gems—Nomenclature [S]. Beijing: Standards Press
of China, 2017.