CUI Jing1 DAI Xiaoai2,3* LIU Yan4,5*
1. College of Earth and Planetary Sciences, Chengdu
University of Technology, Chengdu 610059, China;
2. College of Geography and Planning, Chengdu
University of Technology, Chengdu 610059, China;
3. State
Key Laboratory of Geohazard Prevention and Geoenvironment Protection, Chengdu
University of Technology, Chengdu 610059, China;
4. Institute of Desert Meteorology, China
Meteorological Administration, Urumqi 830002, China;
5. Field
Scientific Experiment Base of Akdala Atmospheric Background, China
Meteorological Administration, Urumqi 830002, China
Abstract: The Yili Region of Xinjiang,
located in the inland region of Central Asia, experiences complex and variable
climatic conditions. Blizzard disasters rank among the most prevalent natural
hazards in this area, posing serious threats to regional ecology, agriculture,
animal husbandry, and residents’ livelihoods. However, current assessments of
systematic risks associated with blizzard disasters in this region are
insufficient, and there is a lack of risk prediction data for future scenarios,
limiting the refinement of disaster prevention and mitigation decisions. Using
the Random Forest model, the authors integrated meteorological elements
(including air temperature, snow cover, and wind speed) with topographic and
geomorphological factors to simulate and evaluate annual blizzard disaster
risks for the Yili Region during the historical period (2000–2020) and under
the SSP2-4.5 scenario for 2050. Blizzard disaster risk is defined as the
probability of significant socioeconomic losses caused by blizzard events
within a specific geographic context. All risk values are normalized to the
[0,1] range, with higher values indicating greater risk. The dataset is
archived in .tif format with missing values represented as –9999. It features a
spatial resolution of 500 m and comprises 22
data files totaling 78.5 MB (compressed into one package with 16.8 MB). This dataset supported the completion of the first author’s Master of
Engineering thesis.
Keywords: blizzard
disaster; Yili Region; Random Forest; risk assessment; future scenario; 2050; Master
of Engineering thesis
DOI: https://doi.org/10.3974/geodp.2026.02.05
Dataset Availability Statement:
The
dataset supporting this paper was published and is accessible through the Digital
Journal of Global Change Data Repository at: https://doi.org/10.3974/geodb.2025.11.07.V1.
1 Introduction
Xinjiang Uygur Autonomous Region is one of the
regions in China prone to frequent blizzard disasters, where snow disasters
caused by blizzards result in varying degrees of losses almost every year[1–3].
Such extreme weather events not only inflict direct economic losses but also
exert profound impacts on regional socio-economic development, human
activities, and the ecological environment[4]. The Yili Region has
become a key area for blizzard disaster research due to its distinctive
geographical and climatic conditions. Nestled between the northern and southern
branches of the Tianshan Mountains, the Yili River Valley features a humid
continental climate that generates extremely heavy snowfall[5].
Characterized by long winters and intense snowfall, this region has
significantly greater snow depth and higher snowfall frequency than other parts
of Xinjiang, making it a high‑risk zone for blizzard disasters and severely
disrupting local production and residents’ daily lives[2,5–7].
According to the precipitation intensity criteria
issued by the National Meteorological Center, a 24-hour snowfall accumulation
of ≥10 mm is classified as a blizzard[8]. Blizzard disaster risk is
generally defined as the probability that blizzard events will result in
substantial socio‑economic losses (including casualties, housing damage, and
declines in agricultural and livestock production) under specific geographical
and environmental conditions. Existing research data indicate that a total of
81 blizzard events were recorded in the Yili Region between 2000 and 2020.
These events not only resulted in casualties and housing damage but also
severely impacted local agricultural and livestock production, establishing
blizzards as a significant risk factor constraining regional ecology and
economic development[5]. Against the backdrop of global climate
change, extreme weather events is likely to increase further in the future. To
address this, there is an urgent need to construct a long-term, high-precision
dataset for assessing blizzard disaster risks to support the improvement of
regional risk prevention and control systems. However, current systematic risk
assessment research on blizzard disasters in the Yili Region remains
inadequate, with a particular scarcity of risk prediction data for future
scenarios. This situation makes it challenging to meet the decision-making
requirements for refined disaster prevention and mitigation.
A comprehensive
assessment of blizzard disaster risk requires the consideration of
multidimensional factors, including meteorology, topography, snow cover, and
socio- economic conditions[9,10]. The complexity of this assessment
process imposes higher requirements on research methodologies and data
integration. A review of relevant domestic and international research indicates
that current methods for snow disaster risk assessment are shifting from
traditional statistical analysis towards the integration of machine learning,
and from single data sources towards multi-source data integration. Domestic
studies have predominantly relied on traditional statistical methods such as
Analytic Hierarchy Process and Logistic regression, with a focus on pastoral
and plateau regions. These studies typically construct risk regionalization
frameworks based on disaster-causing factors, disaster-prone environments, and
disaster-bearing bodies[11–15]. In contrast, international research
places greater emphasis on methodological innovation and framework development.
For instance, Yang, et al.[16] actively explored machine
learning algorithms, utilizing the XGBoost model to identify high-risk areas,
while Lee, et al.[17] established a DPSIR (Driving forces- Pressure-State-Impact-Response)
assessment framework incorporating socio-economic factors. Xu, et al.[18]
applied Copula functions to improve the precision of hazard assessment.
Furthermore, international studies have more extensively integrated
multi-source remote sensing data, such as MODIS and GRACE[19,20].
However, the statistical analyses or empirical models commonly adopted in
traditional research often struggle to capture the complex nonlinear
relationships among multiple factors. Machine learning algorithms, with their
core advantages in handling complex data and uncovering potential correlations,
can effectively overcome this limitation. As a classic ensemble learning
algorithm in the field of machine learning, the Random Forest (RF) model offers
high accuracy, resistance to overfitting, and strong interpretability. With the
rapid development of artificial intelligence in recent years, it has been
widely applied in various evaluation studies[21].
This study
integrates multi-source data and employs the RF model to quantitatively assess
the historical blizzard disaster risk in the Yili Region. Furthermore, by
incorporating future data under the SSP2-4.5 scenario, it predicts and
generates blizzard disaster risk data for 2050. The 2050 projections focus on
the Shared Socioeconomic Pathway 2—medium radiative forcing scenario
(SSP2-4.5), which represents moderate socio-economic development and medium
climate mitigation efforts. This scenario aligns relatively well with the
current development trends in Yili[22] and can provide a reasonable
reference for short-to-medium term disaster prevention planning.
2 Metadata of the Dataset
The metadata of the Blizzard disaster risk
assessment dataset in 2050 based on the simulation model from 2000 to 2020 in
Yili Region, Xinjiang, China[23] is summarized in Table 1. It
includes the dataset full name, short name, authors, year of the dataset,
temporal resolution, spatial resolution, data format, data size, data files,
data publisher, and data sharing policy, etc.
Table 1 Metadata summary of the Blizzard
disaster risk assessment dataset in 2050 based on the simulation model from
2000 to 2020 in Yili Region, Xinjiang, China
|
Items
|
Description
|
|
Dataset full name
|
Blizzard disaster risk
assessment dataset in 2050 based on the simulation model from 2000 to 2020 in
Yili Region, Xinjiang, China
|
|
Dataset short
name
|
Blizzard_Risk_Yili2000-2020&2050
|
|
Authors
|
Cui, J., College
of Earth and Planetary Sciences, Chengdu University of Technology,
cuijing@stu.cdut.edu.cn
Dai, X. A.,
College of Geography and Planning, Chengdu University of Technology,
daixiaoa@cdut.edu.cn
Liu,
Y., Institute of Desert Meteorology, China Meteorological Administration,
liuyan@idm.cn
|
|
Geographical
region
|
Yili Region in
Xinjiang
|
|
Year
|
2000–2020; 2050 (SSP2-4.5
scenario)
|
|
Temporal
resolution
|
Year
|
|
Spatial
resolution
|
500 m
|
|
Data format
|
.tif
|
|
Data size
|
78.5 MB (16.8 MB
after compression)
|
|
Data files
|
Annual
blizzard disaster risk assessment data from 2000 to 2020, and blizzard
disaster risk prediction data for 2050 under the SSP2-4.5 scenario
|
|
Foundation
|
Ministry of
Science and Technology of P. R. China (2022xjkk0602); S&T Development
Fund of IDM (KJFZ202601); S&T Development Fund of CAMS (2021KJ034)
|
|
Data publisher
|
Global Change Research Data Publishing & Repository,
http://www.geodoi.ac.cn
|
|
Address
|
No. 11A, Datun
Road, Chaoyang District, Beijing 100101, China
|
|
Data sharing
policy
|
(1) Data are openly
available and can be free downloaded via the Internet; (2) End users are
encouraged to use Data subject to citation; (3)
Users, who are by definition also value-added service providers, are welcome
to redistribute Data subject to written permission from the GCdataPR
Editorial Office and the issuance of a Data redistribution license; and
(4) If Data are used to compile new datasets, the “ten percent
principal” should be followed such that Data records utilized should not
surpass 10% of the new dataset contents, while sources should be clearly
noted in suitable places in the new dataset[24]
|
|
Communication and searchable system
|
DOI, CSTR, Crossref, DCI, CSCD, CNKI, SciEngine, WDS,
GEOSS, PubScholar, CKRSC
|
3 Methods
The
development process of this dataset is shown in Figure 1. First, based on
recorded blizzard events in Yili Region, historical blizzard disaster points
were extracted. By integrating multi-source data—including meteorological, snow
cover, topographic, socio-economic, and land use factors—12 key influencing
factors were identified. Subsequently, training samples were generated based on
the historical blizzard disaster points, and the RF machine learning algorithm
was adopted for model training. After the model learned the complex
relationships between the various factors and the disasters, it ultimately
output the annual blizzard disaster risk data of Yili Region from 2000 to 2020,
as well as the risk data for 2050 under the SSP2-4.5 scenario.
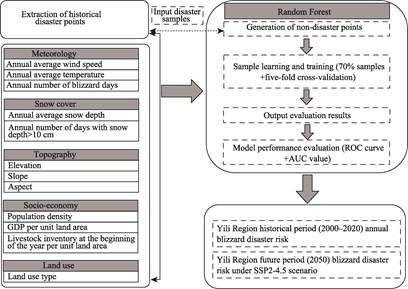
Figure 1 Flowchart of the dataset development
3.1 Data Preprocessing
3.1.1 Extraction of Blizzard Disaster Point Data
Compiling
the snow disaster data for the year 2000 from the Encyclopedia of Meteorological
Disasters in China—Xinjiang, along with the snow disaster data (2001–2020) from
the Department of Civil Affairs, we obtained 81 blizzard events in the Yili
Region from 2000 to 2020. Based on this data, disaster points were further
selected. For the disaster clearly confined to a county seat, considering that
the administrative centers of county seats were usually representative, with
relatively fixed and easily determinable locations, the administrative center
of the county was selected as the disaster point. For areas with a more
ambiguous impact scope, the number of randomly selected points was determined
based on factors such as the area size, terrain complexity, and land use type
distribution, to ensure that these points could reasonably reflect the disaster
distribution in the area. For example, in the northern mountainous areas or
eastern pastoral areas of a certain county, due to the lack of clear location information
for disaster points, combined with the characteristics of topography,
geomorphology and land use types, 51 representative blizzard disaster points
were ultimately extracted from the original data.
3.1.2 Extraction of Indicator Factors
First, based on the mechanisms of snow disaster
formation and relevant studies[25,26], combined with the
topographic, meteorological, snow cover, and socio-economic characteristics of
the Yili Region, a total of 12 disaster-impacting factors were selected. These
factors include elevation, slope, aspect, annual average temperature, annual
average wind speed, annual average snow depth, annual number of days with snow
depth greater than 10 cm, population density, GDP per unit land area, livestock
inventory at the beginning of the year per unit land area, and land use type.
Second, the foundational data used for extracting these impact factors were
collected and sorted out. The data information and sources are presented in
Table 2. Subsequently, the factor data were calculated, and the process is as
follows:
Annual average
temperature and wind speed were calculated based on daily raster data. The
daily temperature data for 2019–2020 were reconstructed via the ANUSPLIN
interpolation algorithm[27] utilizing observations from 15
meteorological stations in the Yili Region. According to the method proposed by
the China Meteorological Administration, where snowfall is identified when
daily precipitation occurs alongside temperatures below 3 °C[28].
The annual number of blizzard days was extracted by integrating daily
precipitation and temperature data. For the historical period, data on
livestock inventory at the beginning of the year per unit land area were
obtained from the Xinjiang Statistical Yearbook. To project these figures for
2050, the framework was constructed using a RF regression model that
incorporated factors such as temperature, precipitation, population, and GDP[29,30].
The historical annual average snow depth and the annual number of days with
snow depth greater than 10 cm were calculated based on daily raster data. For
future projections, surface snow water equivalent data from the ACCESS-ESM1-5
model’s r1i1p1f1 ensemble of the Coupled Model Intercomparison Project Phase 6
(CMIP6) were used[31]. The data for the historical simulation period
(1981–2014) and the projection period (2025–2058) were cropped into 34-year
equal-length sequences corresponding to common and leap years, so as to reduce
interannual fluctuations. Subsequently, using the long-term series of daily
snow depth dataset in China as the reference data, bilinear interpolation was
applied to resample the data to a consistent 0.25°×0.25°spatial resolution, maintaining
spatial continuity and ensuring spatial matching for subsequent bias correction[31].
Following this, localized calibration was performed by incorporating the
density of snow in the Xinjiang region[32], converting surface snow
water equivalent to snow depth to reduce systematic bias. The future data were
then corrected using historical deviations (CMIP6 historical simulation data minus
reference data)[31] to ensure the physical rationality and accuracy
of the data. Furthermore, population density, GDP per unit land area, and land
use type were treated as annual variables and utilized directly after
preprocessing. Among these, the codes of land use type data from different
sources were unified. In addition, slope and aspect were extracted from DEM
data.
In view of the
differences in spatiotemporal resolution and format among the multi-source
data, all data have been co-registered to the Albers coordinate system, and all
factors were ultimately resampled to a 500-m resolution and converted into the
.tif raster format.
3.2 Construction Method
of the Assessment Model
This
study employs the RF algorithm to construct a blizzard disaster risk assessment
model for the Yili Region. As an ensemble learning method, the RF generates
multiple training subsets through Bootstrap sampling, randomly selects features
for node splitting in each decision tree, and ultimately determines the
classification results through a voting mechanism[33]. This method
can effectively handle the complex nonlinear relationships in meteorological
and geographical data and has demonstrated good performance in small-scale
disaster risk assessments[21].
Table
2 Statistical table of basic data
information and sources
|
Type
|
Name
|
Year
|
Resolution
|
Source
|
|
Livestock inventory data
|
Livestock inventory at the
beginning of the year
|
2000–2020
|
county
|
Statistical Yearbook of Xinjiang and the Xinjiang Production and
Construction Corps
|
|
Meteorological data
|
A dataset of daily near-surface
air temperature in China
|
2000–2018
|
1 km
|
National Tibetan Plateau Data Center
|
|
China meteorological forcing
dataset v2.0
|
2000–2020
|
0.1°
|
National Tibetan Plateau Data Center
|
|
NOAA meteorological station data
(daily average temperature)
|
2019–2020
|
/
|
https://www.ncei.noaa.gov/data/
|
|
DEM
|
Global 90 m resolution ocean and
land DEM data product (GDEM_2022)
|
2022
|
90 m
|
https://cloud.tsinghua.edu.cn/d/695ed43696564904980f/?p=%2F&mode=list
|
|
Land use
|
Annual China land cover dataset (CLCD)
|
2000–2020
|
30 m
|
https://zenodo.org/records/12779975
|
|
Detailed global future land
use/land cover data (LULC)
|
2050
|
1 km
|
https://doi.org/10.6084/m9.figshare.23542860
|
|
Snow depth
|
Long-term series of daily snow
depth dataset in China (1979–2023)
|
2000–2020
|
25 km
|
Pie-engine (https://engine.
piesat.cn/engine/home)
|
|
Population
|
Worldpop population dataset
|
2000–2020
|
1 km
|
http://www.worldpop.org/methods/populations/
|
|
Projecting 1-km grid population
distributions from 2020 to 2100 globally under shared socioeconomic pathways
|
2050
|
1 km
|
https://doi.org/10.6084/m9.figshare.19608594.v2
|
|
GDP
|
Global 1 km × 1 km gridded
revised real Gross Domestic Product
|
2000–2019
|
1 km
|
www.gis5g.com
|
|
GDP raster
dataset from 2014 to 2020
|
2020
|
1 km
|
www.gis5g.com
|
|
Gridded datasets for economy
under Shared Socioeconomic Pathways
|
2050
|
1 km
|
https://cstr.cn/31253.11.sciencedb.01683
|
|
Precipitation data
|
China daily precipitation dataset
|
2000–2020
|
0.1°
|
National Tibetan Plateau Data Center
|
|
CMIP6 temperature and
precipitation data
|
High-resolution
CMIP6 downscaled daily climate projections over China
|
2050
|
0.1°
|
National Tibetan Plateau Data Center
|
|
CMIP6 wind speed data
|
China downscaled CMIP6
precipitation, temperature and wind speed dataset (1979–2100)
|
2050
|
0.25°
|
National Tibetan Plateau Data Center
|
|
Snow cover climate model data
|
CMIP6
surface snow water equivalent data (variable name: snw)
|
2050
|
1.875°×1.25°
|
https://esgf-index1.ceda.ac.uk/search/cmip6-ceda/
|
In the specific implementation process of the
model, key features were first extracted from the pre-processed
blizzard-related meteorological and geographical data—such as snowfall,
temperature, wind speed, and topographic information—through feature engineering.
Subsequently, Bootstrap Sampling was employed to generate B training
subsets Db from the original dataset D, where each
subset was obtained via random sampling with replacement, maintaining a sample
size consistent with the original dataset. In this study, B was set to
200. The model was trained employing five-fold cross-validation to optimize
parameters[16,34], with 70% of the samples allocated for
training and 30% for validation. For each training subset Db,
a decision tree Tb was constructed. During the splitting of
each node in the tree,  features were
randomly selected from all P features to constitute a candidate feature
subset, and the optimal split point was chosen based on the principle of
minimizing Gini impurity to reduce the risk of overfitting. For a sample x
to be predicted, each decision tree generates a prediction probability pb
(x), and the average probability of blizzard disaster
occurrence is finally obtained by synthesizing the prediction results of all
decision trees through a weighted voting mechanism:
features were
randomly selected from all P features to constitute a candidate feature
subset, and the optimal split point was chosen based on the principle of
minimizing Gini impurity to reduce the risk of overfitting. For a sample x
to be predicted, each decision tree generates a prediction probability pb
(x), and the average probability of blizzard disaster
occurrence is finally obtained by synthesizing the prediction results of all
decision trees through a weighted voting mechanism:
 (1)
(1)
For high-altitude areas above 3,000 m (which
are sparsely populated regions in both historical and future periods, with
population density below 1 person/km2), a risk down-weighting
process was implemented based on population distribution characteristics. The
corrected risk value is defined as:
 (2)
(2)
Where
H(x) is the elevation of the sample point,  (x)∈[min,1] is the
down-weighting coefficient based on normalized population density, and min
is the preset minimum weight threshold.
(x)∈[min,1] is the
down-weighting coefficient based on normalized population density, and min
is the preset minimum weight threshold.
During the model
validation phase, the Receiver Operating Characteristic Curve (ROC) and the
Area Under the Curve (AUC) were used to evaluate the model’s discriminative
ability[35]. After the accuracy met the requirements, blizzard
disaster risk assessment data for 2000–2020 were generated based on historical
observation data. Furthermore, by integrating future data under the SSP2-4.5
scenario, blizzard disaster risk data for 2050 were predicted and generated.
Finally, all output results were normalized to the [0,1] interval.
4 Data Results and Validation
4.1 Dataset
Composition
This
dataset, archived in a folder named “Blizzard_Risk_Yili2000-2020&2050”,
contains the annual blizzard disaster risk data for the historical period
(2000–2020) and the under the SSP2-4.5 scenario in 2050. The annual data files
for the historical period (2000–2020) are named “BlizRisk_yyyy.tif” (where yyyy
represents the specific year), and the future scenario data file for 2050 is
named “BlizRisk_2050_SSP2-4.5.tif”.
All data feature
a spatial resolution of 500 m and are in .tif format, comprising 22 files with
a total data volume of 78.5 MB (16.8 MB when compressed). The data values
represent a normalized risk index ranging from 0 to 1, where higher values
indicate a greater risk of blizzard disasters.
4.2 Data Results
Analysis
As
shown in Figure 2, influenced by topography and geomorphology, the blizzard
disaster risk in the Yili Region exhibited significant spatial differentiation
from 2000 to 2020. Specifically, the risk was relatively
low in mountainous areas such as the Narat Mountains in
the south, the Keguqin Mountains in the north, and the Wusun Mountains in the
central part. In contrast, the risk in the north and south river valley areas was significantly higher than
that in the mountainous areas due to dense population and easy snow
accumulation. The spatial
distribution of risk was relatively stable over the 21 years, with certain fluctuations in local areas. For example, the risk in the southern
river valley areas gradually decreased after 2013.
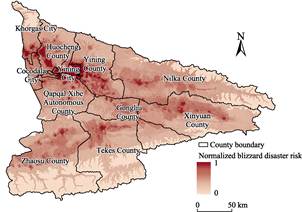
As shown in
Figures 3 and 4, under the SSP2-4.5 scenario, the overall blizzard disaster
risk in the Yili Region is projected to increase by 2050. The risk increase is
more significant in the southern valley areas, as well as in the northwestern
and central mountainous regions. Compared with the average risk level during
2000–2020, the areas with increased risk primarily rose from the interval of
0.20–0.30 to the 0.36–0.63. The area with risk values above 0.63 changed
little, with only a slight increase in risk observed in small parts of the
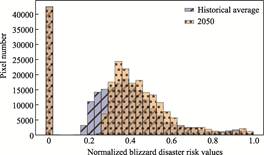
northern and southern river valley areas (Figure 5).
4.3 Data Validation for
2000–2020
The underlying assumption
for validating this dataset is that if the RF model can accurately
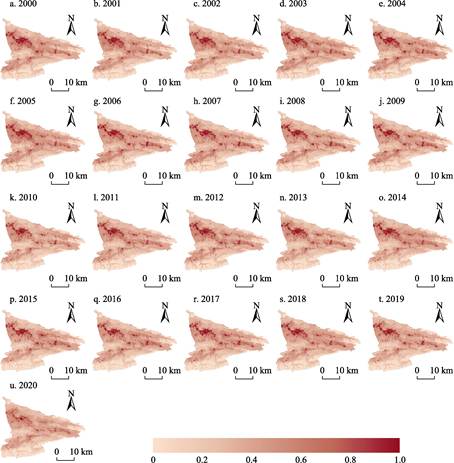
Figure 2 Annual spatial distribution maps of blizzard disaster
risk in the Yili Region (2000–2020)
Figure
3 Spatial distribution map of blizzard disaster risk in
the Yili Region under the
SSP2-4.5 scenario for 2050
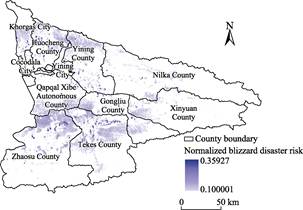
Figure 4 Spatial distribution map of the normalized difference
in blizzard disaster risk between 2050 and the historical average in the Yili
Region
|
Figure
5 Frequency distribution of normalized blizzard
disaster risk values in 2050 and the historical average in the Yili Region
Figure
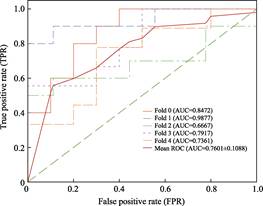
6 ROC curves for the cross-validation of the blizzard
disaster risk assessment model in the Yili Region
|
simulate
historical blizzard disaster risks, it can also reliably predict future
blizzard disaster risks. As illustrated in Figure 6, the model validation
results indicate that the RF model exhibits favorable predictive performance,
with an average AUC value of 0.760,1± 0.108,8.
Compared with
existing research on blizzard disasters in the Yili Region[9], the
spatial risk patterns in this dataset show high consistency with those studies,
indicating strong agreement in the spatial characteristics of risk
distribution. Temporally, the annual blizzard disaster risk results were
standardized using Z-scores to measure their deviation from the multi-year mean
in terms of standard deviations. A threshold of Z-score >1.5 was used to
identify high-risk abnormal areas; this threshold corresponds to a one-tailed
probability of approximately 6.68% under a standard normal distribution and can
effectively differentiate between regular fluctuations and high-risk states[36,37].
Combined with the condition of a risk value
>0.5, abnormal areas that significantly deviate from the mean and
have a relatively high-risk level were identified. By sorting these abnormal
areas in descending order based on their proportion, it was ultimately
determined that the years 2005, 2001, 2010, 2000, 2003, 2012, and 2014 ranked
among the top seven for the proportion of abnormal areas during the historical
period of 2000–2020. Their proportions fell within the 1.8% to 6.0% range,
significantly exceeding the average risk level of the historical period,
identifying them as high-risk abnormal years. Combined with the blizzard
disaster loss data for the Yili Region from 2000 to 2020 (including population
affected, fatalities, house collapses, crop damage, and large livestock
deaths), a disaster loss index was calculated to analyze the interannual
distribution of the occurrence frequency of snow disaster intensity levels[5].
The years identified as having relatively severe disasters were 2003, 2005,
2006, 2010, 2011, 2012, and 2014, yielding a precision of 71.4% and a recall of
71.4%. Among them, although the risk value in 2010 was not the highest, the
simulated high-risk areas highly overlapped with the areas of high population
and economic exposure, resulting in the most severe actual disaster losses. It
can be concluded that the high-risk years identified by the model are highly
consistent with the actual disaster loss index, which verifies the
effectiveness of the model in the temporal dimension.
5 Discussion and Conclusion
Based
on the RF model, this study integrated multi-source data, including
meteorological, topographic, snow cover, and socio-economic factors. It first
simulated the historical blizzard disaster risk in the Yili Region for the
period 2000–2020, and subsequently predicted and generated the blizzard
disaster risk for this region under the SSP2-4.5 scenario for 2050. From 2000
to 2020, the blizzard disaster risk in the Yili Region exhibited a spatial
distribution pattern of “high risk in river valley areas and low risk in the
northern and southern mountainous areas”. Under the SSP2-4.5 scenario for 2050,
the overall blizzard disaster risk in the Yili Region shows an increasing
trend, with a more significant risk increase in the central and northwestern
mountainous areas, as well as the southern valley. Model validation
demonstrates good predictive performance (AUC=0.760,1±0.108,8), and the
high-risk years identified by the model are highly consistent with actual
disaster records, demonstrating the strong applicability and reliability of the
model. Based on the above results, the following recommendations for disaster
prevention and mitigation are proposed: First, for river valley areas with
persistently high risks, the existing disaster prevention and mitigation
systems should be maintained, and monitoring, material reserves, and emergency
response mechanisms should be consolidated; Second, for areas with concentrated
agriculture and animal husbandry and increasing risks, such as the northern
parts of Zhaosu County and Tekes County, the layout of disaster prevention
facilities and the reserve of disaster-resistant materials should be optimized
to enhance disaster resilience capacity.
This dataset
continues and refines the overall distribution pattern of “high risk in the
central valley and low risk in the northern and southern mountainous areas”
revealed by our team’s previous research, further
validating the spatial differentiation characteristics of blizzard disaster
risk in the Yili Region. Previous studies, designed to meet the disaster
prevention deployment needs of the Scientific Expedition Office, employed
geographic data and comprehensive evaluation methods based on county-level
administrative units. The assessment results presented the characteristics of
risk agglomeration at the county level, facilitating direct integration with
regional disaster prevention work. On this basis, the present study
incorporates historical disaster point data and leverages the powerful
nonlinear relationship capture capability of the RF algorithm to achieve a more
refined spatial expression of risk distribution, reflecting our team’s
continuous optimization of blizzard disaster risk assessment methodologies.
Utilizing the RF
model, this study builds upon the strengths of integrating multi-source data
and capturing complex nonlinear relationships, incorporates future climate
scenarios and population down-weighting processing, thereby enhancing the
regional applicability and forward-looking nature of the assessment.
Nevertheless, certain uncertainties exist in the future projections: On one
hand, due to the limitation of using a single CMIP6 model, the simulation
biases inherent in the model itself may propagate to the assessment results.
The subsequent work needs to further reduce uncertainty by integrating
multi-model ensembles. On the other hand, there still remains room for
improvement in terms of model parameter optimization and the setting of
multiple future scenarios. This dataset supported the completion of the first
author’s Master of Engineering thesis.
Author Contributions
Cui, J. agreed with
and adopted the overall design scheme for dataset development proposed by Dai,
X. A. and Liu, Y., collected and processed the data, and wrote the data paper; Dai,
X. A. and Liu, Y. reviewed the data and revised the data paper.
Conflicts of Interest
The
authors declare no conflicts of interest.
References
[1]
Wang, Q. X., Liu, W. P., Li, Y.
Y., et al. Different regional animal husbandry in Xinjiang snow disaster
losses time-frequency characteristics [J]. Journal of Glaciology and
Geocryology, 2015, 37(4): 905–915.
[2]
Wei, J. J., Li, N., Wan, Y., et
al. Mechanisms and causes of typical snowstorms in Urumqi [J]. Arid Land
Geography, 2022, 45(5): 1381–1391.
[3]
Yang, Q., Qin, L., Gao, P., et
al. Prediction of maximum snow depth based on RBF network in severe snow
disaster area of Xinjiang [J]. Desert and Oasis Meteorology, 2024,
18(1): 89–95.
[4]
He, W. X., Hao, X. H., Liu, F.
G., et al. A multi-source information fusion model construction and risk
grading study of snowstorm risk assessment on roads in Ili Region [J]. Remote
Sensing Technology and Application, 2025, 40(1): 177–191.
[5]
Huo, H., Liu, Y., Maiwulaxia,
M. Spatiotemporal distribution characteristics and impact assessment of snow
disasters in the Ili Region of Xinjiang from 1990 to 2020 [J]. Arid Land
Geography, 2024, 47(11): 1828–1840.
[6]
Wang, X., Chu, C. J., Mou, H.
Spatial pattern and interannual variation characteristics of snow disaster in
Xinjiang [J]. Arid Zone Research, 2020, 37(6): 1488–1495.
[7]
Wang, X. Q., Lu, X. Y., Ma, Y.,
et al. Study on snow disaster assessment method and snow disaster
regionalization in Xinjiang [J]. Journal of Glaciology and Geocryology,
2019, 41(4): 836–844.
[8]
General Administration of
Quality Supervision, Inspection and Quarantine of P. R. China, National
Standardization Administration. Grade of precipitation (GB/T 28592—2012) [S].
Beijing: Standards Press of China, 2012.
[9]
Huang,
Y. Y, Dai, X. A., Liu, Y., et al. Research on blizzard disaster risk
zoning in Ili Region, Xinjiang [J]. Meteorological,
Hydrological and Marine Instruments, 2025, 42(2): 104–107.
[10]
Ma, X. F., Huang, X. D., Deng,
J., et al. Comprehensive risk assessment of snow disasters in Qinghai
Province [J]. Acta Prataculturae Sinica, 2017, 26(2): 10–20.
[11]
Ding, Y. L., Sun, X. R., Gao, Y.,
et al. Assessment and division of forest snow disaster risk in Inner
Mongolia [J]. Arid Zone Research, 2019, 36(2): 486–493.
[12]
Delegerima, Li, Y. P., Meng, X.
F., et al. Study of the risk evaluation of snow disaster in pastoral
areas of Xilingol League, Inner Mongolia [J]. Journal of Glaciology and
Geocryology, 2020, 42(4): 1353–1362.
[13]
Chen, H. J., Yang, J. P., Ding,
Y. J., et al. Quantitative assessment of snow risk about livestock in
the Qinghai-Xizang Plateau [J]. Journal of Catastrophology, 2022, 37(2):
102–110.
[14]
Li, F., Hou, G. L., E, C. Y., et
al. Township unit-based risk assessment of snowstorm hazard in Guoluo
Prefecture of Qinghai Plateau [J]. Journal of Natural Disasters, 2014,
23(6): 141–148.
[15]
Miao, A. M., Wang, H. X., Lu, Z.
Y.. Risk regionalization of blizzard disaster in Shanxi Province based on GIS [J].
Chinese Agricultural Science Bulletin, 2016, 32(20): 133–140.
[16]
Yang, Z. Y., Gokon, H., Yu, Q.
Machine learning-based identification and assessment of snow disaster risks
using multi-source data: insights from Fukui Prefecture, Japan [J]. Progress
in Disaster Science, 2025, 26: 0100426.
[17]
Lee, H., Kim, D., Chung, G.
Classification of risk levels for snow damage estimation considering
socioeconomic factors in South Korea [J]. Applied Water Science, 2024,
14(11): 1–17.
[18]
Xu, Q. X., Huang, F. Y., Mou, S.
H., et al. Snow disaster hazard assessment on the Tibetan Plateau based
on copula function [J]. Sustainability, 2023, 15(13):10639.
[19]
Singh, D., Zhu, Y., Liu, S. Y.,
et al. Exploring the links between variations in snow cover area and climatic variables in a Himalayan
catchment using earth observations and CMIP6 climate change scenarios [J].
Journal of Hydrology, 2022, 608: 127648.
[20]
Sahu,
R., Ramsankaran, R., Bhambri, R., et al. Evolution of supraglacial lakes
from 1990 to 2020 in the Himalaya-Karakoram Region using cloud-based Google Earth Engine platform [J]. Journal of the Indian Society of Remote Sensing,
2023, 51(12): 2379–2390.
[21]
Wang, Q. L., Ma, X. X., Liu, X.
X., et al. Mountain torrent disaster risk assessment method and
application based on Random Forest [J]. Yellow River, 2022, 44(4):
63–66,73.
[22]
Bureau of Statistics of Ili
Kazak Autonomous Prefecture. Statistical Yearbook of Ili Kazak Autonomous
Prefecture on the 2024 National Economic and Social Development [EB/OL].
(2025-04-09). https://www. xjyl.gov.cn/xjylz/c112816/202504/67c6814847cb40a0a33773fb1df5466b.shtml.
[23]
Cui, J., Dai, X. A., Liu, Y.
Blizzard disaster risk assessment dataset in 2050 based on the simulation model
from 2000 to 2020 in Yili Region, Xinjiang, China [J/DB/OL]. Digital Journal
of Global Change Data Repository, 2025.
0https://doi.org/10.3974/geodb.2025.11.07.V1.
[24]
GCdataPR Editorial Office.
GCdataPR data sharing policy [OL]. https://doi.org/10.3974/dp.policy.2014.05
(Updated 2017).
[25]
Yu, D., Du, H. R., Guo, J., et
al. Research of snow disaster risk assessment in the Three-River-Source
Area based on multi-source data [J]. Advances in Meteorological Science and
Technology, 2023, 13(4): 34–40.
[26]
Zhuang, X. C., Zhou, H. K.,
Wang, L., et al. Evaluation and cause study on the snow disasters in
Pastoral Areas of Northern Xinjiang [J]. Arid Zone Research, 2015,
32(5): 1000–1006.
[27]
Qian, Y. L., Lv, H. Q., Zhang,
Y. H. Application and evaluation of daily meteorological element interpolation
method based on ANUSPLIN software [J]. Journal of Meteorology and
Environment, 2010, 26(2): 7–15.
[28]
Liu, D., Zhang, L. J., Jiang, S.
Y., et al. Hazard prediction and risk regionalization of snowstorms in Northeast
China [J]. Physics and Chemistry of the Earth, Parts A/B/C,
2020, 116: 102832.
[29]
Zhou, J., Niu, J., Wu, N., et
al. Annual high-resolution grazing-intensity maps on the Qinghai-Tibet
Plateau from 1990 to 2020 [J]. Earth System Science Data Discussions,
2023, 16(11): 5171–5189.
[30]
Zhang, X. Z., Li, M., Wu, J. S.,
et al. Alpine grassland aboveground biomass and theoretical livestock
carrying capacity on the Tibetan Plateau [J]. Journal of Resources and
Ecology, 2022, 13(1): 129–141.
[31]
Chen,
T., Gao, G., Du, X. H., et al. CMIP6 projected changes in snow cover in
the Qinghai-Tibet Plateau [J]. Scientia Geographica
Sinica, 2024, 44(5): 901–910.
[32]
Wang, H. D., Zhang, X. L., Xiao,
P. F., et al. Towards large-scale daily snow density mapping with
spatiotemporally aware model and multi-source data [J]. The Cryosphere,
2023, 17(1): 33–50.
[33]
Yang, S., Li, D. Y., Yan, L. X.,
et al. Landslide susceptibility assessment in high and steep bank slopes
along Wujiang River based on Random Forest model [J]. Safety and
Environmental Engineering, 2021, 28(4): 131–138.
[34]
Huang, C. Y., She, D. X., Liu,
X. B., et al. Predicting future meteorological drought risk in mainland
China using random forest model [J]. Journal of Hydrology: Regional Studies,
2025, 61: 102633.
[35]
Liang, Z., Wang, C. M., Duan, Z.
J., et al. A hybrid model consisting of supervised and unsupervised
learning for landslide susceptibility mapping [J]. Remote Sensing, 2021,
13(8): 1464.
[36]
Ruijsch, D., van Mourik, J.,
Biemans, H., et al. Thrive or wither: exploring the impacts of multiyear
droughts on vegetation [J]. Journal of Geophysical Research: Biogeosciences,
2025, 130(7): e2025JG008992.
[37]
Wang, X. X., Wu, Y. H., Luo, M.
L., et al. Exports of organic matter, phosphorus and nitrogen from
Sichuan Basin: a critical region regulating water quality of the Upper Yangtze
River, China [J]. Journal of Hydrology, 2025, 662: 133889.